
Key Insights
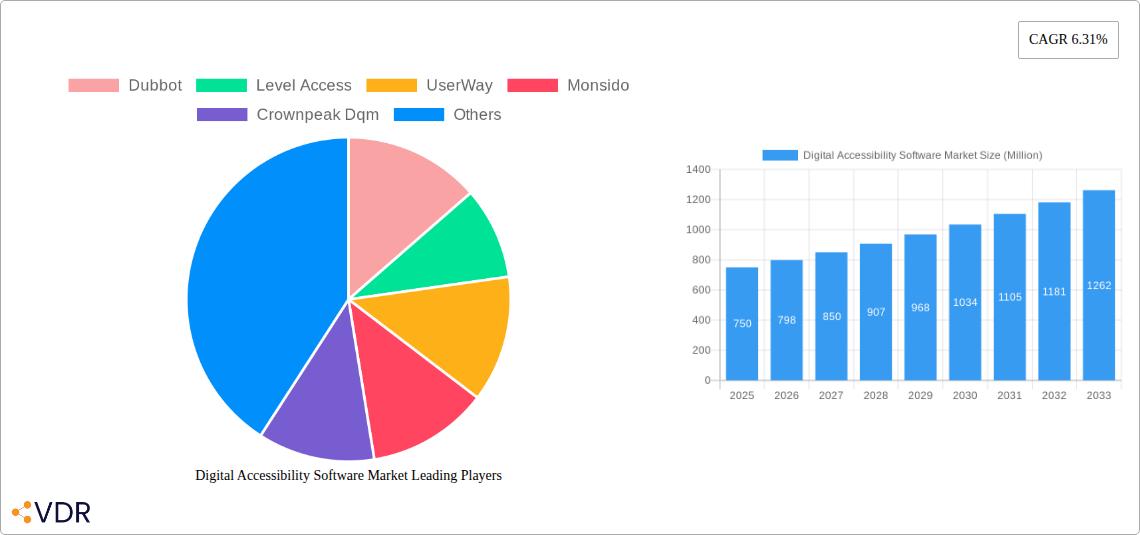
The Digital Accessibility Software market, currently valued at $0.75 billion in 2025, is projected to experience robust growth, fueled by increasing regulatory mandates (like the Americans with Disabilities Act and WCAG guidelines) and a rising awareness of inclusive design principles. The market's Compound Annual Growth Rate (CAGR) of 6.31% from 2025 to 2033 indicates a steady expansion, driven by the adoption of accessibility software by both small and medium-sized enterprises (SMEs) and large enterprises. The increasing availability of user-friendly software solutions, coupled with the cost-effectiveness of early accessibility implementation compared to the potential legal and reputational damages of non-compliance, are key drivers. Growing demand for color contrast checker software and website accessibility software within these segments contributes significantly to market expansion. While specific regional breakdowns are unavailable, we can reasonably infer that North America and Europe, possessing mature digital economies and stringent accessibility regulations, will likely hold significant market shares. The market growth is also being spurred by ongoing technological advancements, improving the usability and efficiency of accessibility tools. Furthermore, the increasing prevalence of remote work and e-commerce are boosting demand for accessible digital experiences across all sectors.
Despite this positive outlook, market growth could face some restraints. High initial investment costs for implementing accessibility software might deter some smaller businesses, particularly those with limited IT budgets. Additionally, the complexity of achieving full website accessibility for older or legacy systems can pose challenges for some organizations. However, the long-term benefits of accessibility, including enhanced brand reputation, wider market reach, and avoidance of costly litigation, are likely to outweigh these initial hurdles, fostering sustained market expansion. The increasing availability of affordable and user-friendly solutions is mitigating some of the initial cost concerns and simplifying implementation. Competition among established players like Dubbot, Level Access, UserWay, and others is likely to intensify, potentially driving innovation and further price reductions in the coming years.
This comprehensive report provides a detailed analysis of the Digital Accessibility Software Market, encompassing market dynamics, growth trends, regional segmentation, product landscape, key players, and future outlook. The study period covers 2019-2033, with 2025 as the base and estimated year, and a forecast period of 2025-2033. The historical period analyzed is 2019-2024. The market is segmented by organization size (Small and Medium Enterprises, Large Enterprises) and by type (Color Contrast Checker Software, Website Accessibility Software). This report is essential for businesses, investors, and industry professionals seeking insights into this rapidly evolving market.
Digital Accessibility Software Market Dynamics & Structure
The digital accessibility software market is experiencing robust growth, driven by increasing regulatory compliance mandates, heightened awareness of inclusivity, and technological advancements. Market concentration is currently moderate, with a few major players holding significant market share, but a large number of smaller, specialized players also contributing. The market is characterized by continuous technological innovation, particularly in AI-powered accessibility solutions. Stringent regulatory frameworks like the ADA, Section 508, AODA, EAA, WCAG 2.2, and EN 301 549 are key drivers, pushing organizations to adopt compliance solutions. Competitive substitutes include manual accessibility audits, which are often less efficient and more expensive. The end-user demographic is broad, encompassing businesses of all sizes and across various sectors. M&A activity is significant, as demonstrated by recent events like the Level Access's planned acquisition of UserWay (January 2024).
- Market Concentration: Moderate, with a few major players and numerous smaller niche providers. Market share for the top 5 players is estimated at xx%.
- Technological Innovation: AI-powered automation, assistive technology integration, and improved user experience are key drivers. Innovation barriers include the complexity of accessibility standards and the need for ongoing updates.
- Regulatory Frameworks: Stringent regulations like ADA, Section 508, WCAG 2.2, and others are significantly driving market growth.
- Competitive Substitutes: Manual accessibility audits pose a less efficient and costlier alternative.
- End-User Demographics: Businesses across all sizes and sectors, including government agencies and educational institutions.
- M&A Trends: Increasing consolidation, with xx M&A deals recorded in the past five years. The Level Access - UserWay deal signifies the ongoing consolidation trend.
Digital Accessibility Software Market Growth Trends & Insights
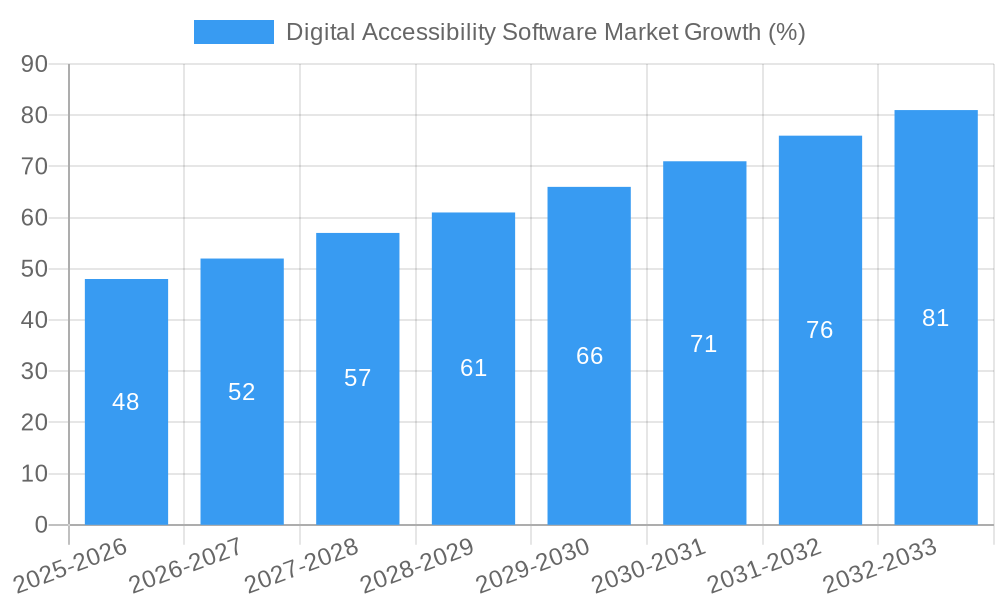
The digital accessibility software market has witnessed significant expansion, with a Compound Annual Growth Rate (CAGR) of xx% during the historical period (2019-2024). This growth is projected to continue at a CAGR of xx% during the forecast period (2025-2033), reaching a market size of xx million units by 2033. This robust growth is fueled by a rising awareness of accessibility standards among organizations and increasing adoption of software solutions to streamline compliance efforts. Technological advancements, such as the integration of AI and machine learning, are further driving market penetration and improving the efficacy of accessibility testing and remediation tools. Shifting consumer behavior towards greater digital inclusion also plays a significant role. Market penetration is currently at xx%, with significant room for growth.
Dominant Regions, Countries, or Segments in Digital Accessibility Software Market
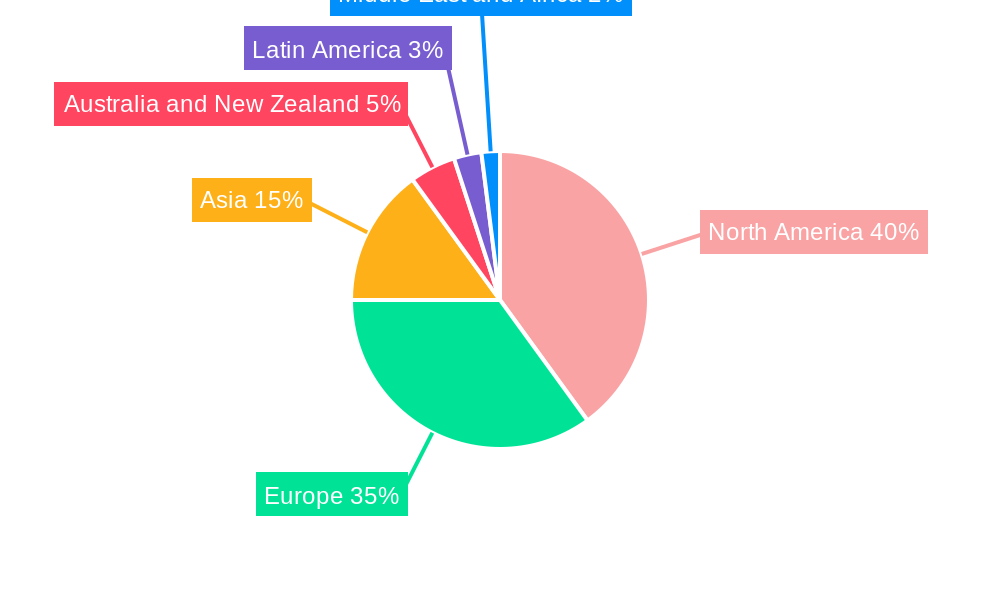
North America currently holds the largest market share in the digital accessibility software market, driven by robust regulatory frameworks (ADA compliance) and high adoption rates among large enterprises. Within North America, the United States is the leading country. The European Union follows closely, with strong growth spurred by similar regulatory requirements and a large digital economy. In terms of segments, Large Enterprises currently dominate the market due to higher budgets and complex websites needing comprehensive accessibility solutions. However, Small and Medium Enterprises (SMEs) are showing significant growth potential as awareness increases and cost-effective solutions become available. Website Accessibility Software constitutes a larger segment compared to Color Contrast Checker Software due to its comprehensive nature.
- Key Drivers for North America: Stringent regulations, high awareness, large enterprise adoption.
- Key Drivers for Europe: Strong regulatory environment, growing digital economy, increasing awareness.
- Large Enterprises: High budgets, complex websites, higher adoption rates.
- Small and Medium Enterprises (SMEs): Increasing awareness, cost-effective solutions driving growth.
- Website Accessibility Software: Comprehensive nature, addressing multiple accessibility needs.
Digital Accessibility Software Market Product Landscape
The digital accessibility software market offers a range of products, from simple color contrast checkers to sophisticated automated testing and remediation tools. Innovations focus on improving accuracy, speed, and ease of use. Many solutions integrate AI and machine learning to automate testing and provide actionable remediation recommendations. Key performance metrics include testing speed, accuracy of identifying accessibility issues, and the ease of implementing the suggested fixes. Unique selling propositions often center on the ease of integration with existing content management systems and the ability to handle various web technologies.
Key Drivers, Barriers & Challenges in Digital Accessibility Software Market
Key Drivers:
- Increasing regulatory compliance requirements (ADA, WCAG 2.2, etc.).
- Growing awareness of digital inclusion and disability rights.
- Technological advancements in AI-powered accessibility solutions.
- Increasing demand for automated accessibility testing and remediation.
Key Challenges and Restraints:
- High initial investment costs for some advanced solutions can be a barrier for SMEs.
- Complexity of accessibility standards requires continuous updates and expertise.
- Competition from manual audits and alternative testing methodologies exists.
- The ongoing evolution of web technologies presents an ongoing challenge in maintaining software effectiveness. This factor represents a xx% impact on market growth.
Emerging Opportunities in Digital Accessibility Software Market
Emerging opportunities lie in the expansion of AI-powered solutions, the development of tools that support accessibility in emerging technologies (e.g., VR/AR), and a focus on providing solutions specifically tailored to the needs of SMEs. Untapped markets in developing economies and the growing focus on mobile app accessibility present significant growth potential. The personalization of accessibility solutions based on user needs presents a strong emerging opportunity.
Growth Accelerators in the Digital Accessibility Software Market Industry
Long-term growth will be driven by continued advancements in AI, machine learning, and automation; strategic partnerships between software providers and accessibility consulting firms; and the expansion into new geographical markets, particularly developing countries. A focus on integrating accessibility testing directly into software development lifecycles and the development of user-friendly solutions that empower smaller companies are crucial growth accelerators.
Key Players Shaping the Digital Accessibility Software Market Market
- Dubbot
- Level Access
- UserWay
- Monsido
- Crownpeak DQM
- UsableNet AQA
- Chrome Len
- Siteimprove
- Silktide
- Wave API
Notable Milestones in Digital Accessibility Software Market Sector
- January 2024: Level Access's planned acquisition of UserWay significantly impacts market consolidation.
- October 2023: UserWay's WCAG 2.2 upgrade enhances its product offerings and underscores industry alignment with evolving standards.
In-Depth Digital Accessibility Software Market Market Outlook
The digital accessibility software market is poised for sustained growth, driven by the factors outlined above. Future opportunities lie in leveraging AI for more proactive and efficient accessibility solutions, catering to the unique needs of diverse user groups, and expanding into new geographic regions and emerging technologies. Strategic partnerships and a continued emphasis on user-friendly, cost-effective solutions for SMEs will be crucial for maximizing market penetration and driving long-term growth.
Digital Accessibility Software Market Segmentation
-
1. Type
- 1.1. Color Contrast Checker Software
- 1.2. Website Accessibility Software
-
2. Organisation Size
- 2.1. Small and Medium Enterprises
- 2.2. Large Enterprises
Digital Accessibility Software Market Segmentation By Geography
- 1. North America
- 2. Europe
- 3. Asia
- 4. Australia and New Zealand
- 5. Latin America
- 6. Middle East and Africa
Digital Accessibility Software Market REPORT HIGHLIGHTS
| Aspects | Details |
|---|---|
| Study Period | 2019-2033 |
| Base Year | 2024 |
| Estimated Year | 2025 |
| Forecast Period | 2025-2033 |
| Historical Period | 2019-2024 |
| Growth Rate | CAGR of 6.31% from 2019-2033 |
| Segmentation |
|
Table of Contents
- 1. Introduction
- 1.1. Research Scope
- 1.2. Market Segmentation
- 1.3. Research Methodology
- 1.4. Definitions and Assumptions
- 2. Executive Summary
- 2.1. Introduction
- 3. Market Dynamics
- 3.1. Introduction
- 3.2. Market Drivers
- 3.2.1 Due to embedded accessibility features Smartphones present a useful tool for persons with disabilities
- 3.2.2 will drive market; Government schemes for disabled people
- 3.3. Market Restrains
- 3.3.1. lack of awareness of mobile accessibility features and mobile internet are key barriers
- 3.4. Market Trends
- 3.4.1. Government policies and laws will drive the market further
- 4. Market Factor Analysis
- 4.1. Porters Five Forces
- 4.2. Supply/Value Chain
- 4.3. PESTEL analysis
- 4.4. Market Entropy
- 4.5. Patent/Trademark Analysis
- 5. Global Digital Accessibility Software Market Analysis, Insights and Forecast, 2019-2031
- 5.1. Market Analysis, Insights and Forecast - by Type
- 5.1.1. Color Contrast Checker Software
- 5.1.2. Website Accessibility Software
- 5.2. Market Analysis, Insights and Forecast - by Organisation Size
- 5.2.1. Small and Medium Enterprises
- 5.2.2. Large Enterprises
- 5.3. Market Analysis, Insights and Forecast - by Region
- 5.3.1. North America
- 5.3.2. Europe
- 5.3.3. Asia
- 5.3.4. Australia and New Zealand
- 5.3.5. Latin America
- 5.3.6. Middle East and Africa
- 5.1. Market Analysis, Insights and Forecast - by Type
- 6. North America Digital Accessibility Software Market Analysis, Insights and Forecast, 2019-2031
- 6.1. Market Analysis, Insights and Forecast - by Type
- 6.1.1. Color Contrast Checker Software
- 6.1.2. Website Accessibility Software
- 6.2. Market Analysis, Insights and Forecast - by Organisation Size
- 6.2.1. Small and Medium Enterprises
- 6.2.2. Large Enterprises
- 6.1. Market Analysis, Insights and Forecast - by Type
- 7. Europe Digital Accessibility Software Market Analysis, Insights and Forecast, 2019-2031
- 7.1. Market Analysis, Insights and Forecast - by Type
- 7.1.1. Color Contrast Checker Software
- 7.1.2. Website Accessibility Software
- 7.2. Market Analysis, Insights and Forecast - by Organisation Size
- 7.2.1. Small and Medium Enterprises
- 7.2.2. Large Enterprises
- 7.1. Market Analysis, Insights and Forecast - by Type
- 8. Asia Digital Accessibility Software Market Analysis, Insights and Forecast, 2019-2031
- 8.1. Market Analysis, Insights and Forecast - by Type
- 8.1.1. Color Contrast Checker Software
- 8.1.2. Website Accessibility Software
- 8.2. Market Analysis, Insights and Forecast - by Organisation Size
- 8.2.1. Small and Medium Enterprises
- 8.2.2. Large Enterprises
- 8.1. Market Analysis, Insights and Forecast - by Type
- 9. Australia and New Zealand Digital Accessibility Software Market Analysis, Insights and Forecast, 2019-2031
- 9.1. Market Analysis, Insights and Forecast - by Type
- 9.1.1. Color Contrast Checker Software
- 9.1.2. Website Accessibility Software
- 9.2. Market Analysis, Insights and Forecast - by Organisation Size
- 9.2.1. Small and Medium Enterprises
- 9.2.2. Large Enterprises
- 9.1. Market Analysis, Insights and Forecast - by Type
- 10. Latin America Digital Accessibility Software Market Analysis, Insights and Forecast, 2019-2031
- 10.1. Market Analysis, Insights and Forecast - by Type
- 10.1.1. Color Contrast Checker Software
- 10.1.2. Website Accessibility Software
- 10.2. Market Analysis, Insights and Forecast - by Organisation Size
- 10.2.1. Small and Medium Enterprises
- 10.2.2. Large Enterprises
- 10.1. Market Analysis, Insights and Forecast - by Type
- 11. Middle East and Africa Digital Accessibility Software Market Analysis, Insights and Forecast, 2019-2031
- 11.1. Market Analysis, Insights and Forecast - by Type
- 11.1.1. Color Contrast Checker Software
- 11.1.2. Website Accessibility Software
- 11.2. Market Analysis, Insights and Forecast - by Organisation Size
- 11.2.1. Small and Medium Enterprises
- 11.2.2. Large Enterprises
- 11.1. Market Analysis, Insights and Forecast - by Type
- 12. North America Digital Accessibility Software Market Analysis, Insights and Forecast, 2019-2031
- 12.1. Market Analysis, Insights and Forecast - By Country/Sub-region
- 12.1.1.
- 13. Europe Digital Accessibility Software Market Analysis, Insights and Forecast, 2019-2031
- 13.1. Market Analysis, Insights and Forecast - By Country/Sub-region
- 13.1.1.
- 14. Asia Digital Accessibility Software Market Analysis, Insights and Forecast, 2019-2031
- 14.1. Market Analysis, Insights and Forecast - By Country/Sub-region
- 14.1.1.
- 15. Australia and New Zealand Digital Accessibility Software Market Analysis, Insights and Forecast, 2019-2031
- 15.1. Market Analysis, Insights and Forecast - By Country/Sub-region
- 15.1.1.
- 16. Latin America Digital Accessibility Software Market Analysis, Insights and Forecast, 2019-2031
- 16.1. Market Analysis, Insights and Forecast - By Country/Sub-region
- 16.1.1.
- 17. Middle East and Africa Digital Accessibility Software Market Analysis, Insights and Forecast, 2019-2031
- 17.1. Market Analysis, Insights and Forecast - By Country/Sub-region
- 17.1.1.
- 18. Competitive Analysis
- 18.1. Global Market Share Analysis 2024
- 18.2. Company Profiles
- 18.2.1 Dubbot
- 18.2.1.1. Overview
- 18.2.1.2. Products
- 18.2.1.3. SWOT Analysis
- 18.2.1.4. Recent Developments
- 18.2.1.5. Financials (Based on Availability)
- 18.2.2 Level Access
- 18.2.2.1. Overview
- 18.2.2.2. Products
- 18.2.2.3. SWOT Analysis
- 18.2.2.4. Recent Developments
- 18.2.2.5. Financials (Based on Availability)
- 18.2.3 UserWay
- 18.2.3.1. Overview
- 18.2.3.2. Products
- 18.2.3.3. SWOT Analysis
- 18.2.3.4. Recent Developments
- 18.2.3.5. Financials (Based on Availability)
- 18.2.4 Monsido
- 18.2.4.1. Overview
- 18.2.4.2. Products
- 18.2.4.3. SWOT Analysis
- 18.2.4.4. Recent Developments
- 18.2.4.5. Financials (Based on Availability)
- 18.2.5 Crownpeak Dqm
- 18.2.5.1. Overview
- 18.2.5.2. Products
- 18.2.5.3. SWOT Analysis
- 18.2.5.4. Recent Developments
- 18.2.5.5. Financials (Based on Availability)
- 18.2.6 UsableNet AQA
- 18.2.6.1. Overview
- 18.2.6.2. Products
- 18.2.6.3. SWOT Analysis
- 18.2.6.4. Recent Developments
- 18.2.6.5. Financials (Based on Availability)
- 18.2.7 Chrome Len
- 18.2.7.1. Overview
- 18.2.7.2. Products
- 18.2.7.3. SWOT Analysis
- 18.2.7.4. Recent Developments
- 18.2.7.5. Financials (Based on Availability)
- 18.2.8 Siteimprove
- 18.2.8.1. Overview
- 18.2.8.2. Products
- 18.2.8.3. SWOT Analysis
- 18.2.8.4. Recent Developments
- 18.2.8.5. Financials (Based on Availability)
- 18.2.9 Silktide
- 18.2.9.1. Overview
- 18.2.9.2. Products
- 18.2.9.3. SWOT Analysis
- 18.2.9.4. Recent Developments
- 18.2.9.5. Financials (Based on Availability)
- 18.2.10 Wave API
- 18.2.10.1. Overview
- 18.2.10.2. Products
- 18.2.10.3. SWOT Analysis
- 18.2.10.4. Recent Developments
- 18.2.10.5. Financials (Based on Availability)
- 18.2.1 Dubbot
List of Figures
- Figure 1: Global Digital Accessibility Software Market Revenue Breakdown (Million, %) by Region 2024 & 2032
- Figure 2: North America Digital Accessibility Software Market Revenue (Million), by Country 2024 & 2032
- Figure 3: North America Digital Accessibility Software Market Revenue Share (%), by Country 2024 & 2032
- Figure 4: Europe Digital Accessibility Software Market Revenue (Million), by Country 2024 & 2032
- Figure 5: Europe Digital Accessibility Software Market Revenue Share (%), by Country 2024 & 2032
- Figure 6: Asia Digital Accessibility Software Market Revenue (Million), by Country 2024 & 2032
- Figure 7: Asia Digital Accessibility Software Market Revenue Share (%), by Country 2024 & 2032
- Figure 8: Australia and New Zealand Digital Accessibility Software Market Revenue (Million), by Country 2024 & 2032
- Figure 9: Australia and New Zealand Digital Accessibility Software Market Revenue Share (%), by Country 2024 & 2032
- Figure 10: Latin America Digital Accessibility Software Market Revenue (Million), by Country 2024 & 2032
- Figure 11: Latin America Digital Accessibility Software Market Revenue Share (%), by Country 2024 & 2032
- Figure 12: Middle East and Africa Digital Accessibility Software Market Revenue (Million), by Country 2024 & 2032
- Figure 13: Middle East and Africa Digital Accessibility Software Market Revenue Share (%), by Country 2024 & 2032
- Figure 14: North America Digital Accessibility Software Market Revenue (Million), by Type 2024 & 2032
- Figure 15: North America Digital Accessibility Software Market Revenue Share (%), by Type 2024 & 2032
- Figure 16: North America Digital Accessibility Software Market Revenue (Million), by Organisation Size 2024 & 2032
- Figure 17: North America Digital Accessibility Software Market Revenue Share (%), by Organisation Size 2024 & 2032
- Figure 18: North America Digital Accessibility Software Market Revenue (Million), by Country 2024 & 2032
- Figure 19: North America Digital Accessibility Software Market Revenue Share (%), by Country 2024 & 2032
- Figure 20: Europe Digital Accessibility Software Market Revenue (Million), by Type 2024 & 2032
- Figure 21: Europe Digital Accessibility Software Market Revenue Share (%), by Type 2024 & 2032
- Figure 22: Europe Digital Accessibility Software Market Revenue (Million), by Organisation Size 2024 & 2032
- Figure 23: Europe Digital Accessibility Software Market Revenue Share (%), by Organisation Size 2024 & 2032
- Figure 24: Europe Digital Accessibility Software Market Revenue (Million), by Country 2024 & 2032
- Figure 25: Europe Digital Accessibility Software Market Revenue Share (%), by Country 2024 & 2032
- Figure 26: Asia Digital Accessibility Software Market Revenue (Million), by Type 2024 & 2032
- Figure 27: Asia Digital Accessibility Software Market Revenue Share (%), by Type 2024 & 2032
- Figure 28: Asia Digital Accessibility Software Market Revenue (Million), by Organisation Size 2024 & 2032
- Figure 29: Asia Digital Accessibility Software Market Revenue Share (%), by Organisation Size 2024 & 2032
- Figure 30: Asia Digital Accessibility Software Market Revenue (Million), by Country 2024 & 2032
- Figure 31: Asia Digital Accessibility Software Market Revenue Share (%), by Country 2024 & 2032
- Figure 32: Australia and New Zealand Digital Accessibility Software Market Revenue (Million), by Type 2024 & 2032
- Figure 33: Australia and New Zealand Digital Accessibility Software Market Revenue Share (%), by Type 2024 & 2032
- Figure 34: Australia and New Zealand Digital Accessibility Software Market Revenue (Million), by Organisation Size 2024 & 2032
- Figure 35: Australia and New Zealand Digital Accessibility Software Market Revenue Share (%), by Organisation Size 2024 & 2032
- Figure 36: Australia and New Zealand Digital Accessibility Software Market Revenue (Million), by Country 2024 & 2032
- Figure 37: Australia and New Zealand Digital Accessibility Software Market Revenue Share (%), by Country 2024 & 2032
- Figure 38: Latin America Digital Accessibility Software Market Revenue (Million), by Type 2024 & 2032
- Figure 39: Latin America Digital Accessibility Software Market Revenue Share (%), by Type 2024 & 2032
- Figure 40: Latin America Digital Accessibility Software Market Revenue (Million), by Organisation Size 2024 & 2032
- Figure 41: Latin America Digital Accessibility Software Market Revenue Share (%), by Organisation Size 2024 & 2032
- Figure 42: Latin America Digital Accessibility Software Market Revenue (Million), by Country 2024 & 2032
- Figure 43: Latin America Digital Accessibility Software Market Revenue Share (%), by Country 2024 & 2032
- Figure 44: Middle East and Africa Digital Accessibility Software Market Revenue (Million), by Type 2024 & 2032
- Figure 45: Middle East and Africa Digital Accessibility Software Market Revenue Share (%), by Type 2024 & 2032
- Figure 46: Middle East and Africa Digital Accessibility Software Market Revenue (Million), by Organisation Size 2024 & 2032
- Figure 47: Middle East and Africa Digital Accessibility Software Market Revenue Share (%), by Organisation Size 2024 & 2032
- Figure 48: Middle East and Africa Digital Accessibility Software Market Revenue (Million), by Country 2024 & 2032
- Figure 49: Middle East and Africa Digital Accessibility Software Market Revenue Share (%), by Country 2024 & 2032
List of Tables
- Table 1: Global Digital Accessibility Software Market Revenue Million Forecast, by Region 2019 & 2032
- Table 2: Global Digital Accessibility Software Market Revenue Million Forecast, by Type 2019 & 2032
- Table 3: Global Digital Accessibility Software Market Revenue Million Forecast, by Organisation Size 2019 & 2032
- Table 4: Global Digital Accessibility Software Market Revenue Million Forecast, by Region 2019 & 2032
- Table 5: Global Digital Accessibility Software Market Revenue Million Forecast, by Country 2019 & 2032
- Table 6: Digital Accessibility Software Market Revenue (Million) Forecast, by Application 2019 & 2032
- Table 7: Global Digital Accessibility Software Market Revenue Million Forecast, by Country 2019 & 2032
- Table 8: Digital Accessibility Software Market Revenue (Million) Forecast, by Application 2019 & 2032
- Table 9: Global Digital Accessibility Software Market Revenue Million Forecast, by Country 2019 & 2032
- Table 10: Digital Accessibility Software Market Revenue (Million) Forecast, by Application 2019 & 2032
- Table 11: Global Digital Accessibility Software Market Revenue Million Forecast, by Country 2019 & 2032
- Table 12: Digital Accessibility Software Market Revenue (Million) Forecast, by Application 2019 & 2032
- Table 13: Global Digital Accessibility Software Market Revenue Million Forecast, by Country 2019 & 2032
- Table 14: Digital Accessibility Software Market Revenue (Million) Forecast, by Application 2019 & 2032
- Table 15: Global Digital Accessibility Software Market Revenue Million Forecast, by Country 2019 & 2032
- Table 16: Digital Accessibility Software Market Revenue (Million) Forecast, by Application 2019 & 2032
- Table 17: Global Digital Accessibility Software Market Revenue Million Forecast, by Type 2019 & 2032
- Table 18: Global Digital Accessibility Software Market Revenue Million Forecast, by Organisation Size 2019 & 2032
- Table 19: Global Digital Accessibility Software Market Revenue Million Forecast, by Country 2019 & 2032
- Table 20: Global Digital Accessibility Software Market Revenue Million Forecast, by Type 2019 & 2032
- Table 21: Global Digital Accessibility Software Market Revenue Million Forecast, by Organisation Size 2019 & 2032
- Table 22: Global Digital Accessibility Software Market Revenue Million Forecast, by Country 2019 & 2032
- Table 23: Global Digital Accessibility Software Market Revenue Million Forecast, by Type 2019 & 2032
- Table 24: Global Digital Accessibility Software Market Revenue Million Forecast, by Organisation Size 2019 & 2032
- Table 25: Global Digital Accessibility Software Market Revenue Million Forecast, by Country 2019 & 2032
- Table 26: Global Digital Accessibility Software Market Revenue Million Forecast, by Type 2019 & 2032
- Table 27: Global Digital Accessibility Software Market Revenue Million Forecast, by Organisation Size 2019 & 2032
- Table 28: Global Digital Accessibility Software Market Revenue Million Forecast, by Country 2019 & 2032
- Table 29: Global Digital Accessibility Software Market Revenue Million Forecast, by Type 2019 & 2032
- Table 30: Global Digital Accessibility Software Market Revenue Million Forecast, by Organisation Size 2019 & 2032
- Table 31: Global Digital Accessibility Software Market Revenue Million Forecast, by Country 2019 & 2032
- Table 32: Global Digital Accessibility Software Market Revenue Million Forecast, by Type 2019 & 2032
- Table 33: Global Digital Accessibility Software Market Revenue Million Forecast, by Organisation Size 2019 & 2032
- Table 34: Global Digital Accessibility Software Market Revenue Million Forecast, by Country 2019 & 2032
Frequently Asked Questions
1. What is the projected Compound Annual Growth Rate (CAGR) of the Digital Accessibility Software Market?
The projected CAGR is approximately 6.31%.
2. Which companies are prominent players in the Digital Accessibility Software Market?
Key companies in the market include Dubbot, Level Access, UserWay, Monsido, Crownpeak Dqm, UsableNet AQA, Chrome Len, Siteimprove, Silktide, Wave API.
3. What are the main segments of the Digital Accessibility Software Market?
The market segments include Type, Organisation Size.
4. Can you provide details about the market size?
The market size is estimated to be USD 0.75 Million as of 2022.
5. What are some drivers contributing to market growth?
Due to embedded accessibility features Smartphones present a useful tool for persons with disabilities. will drive market; Government schemes for disabled people.
6. What are the notable trends driving market growth?
Government policies and laws will drive the market further.
7. Are there any restraints impacting market growth?
lack of awareness of mobile accessibility features and mobile internet are key barriers.
8. Can you provide examples of recent developments in the market?
January 2024 - Level Access is poised to acquire UserWay, one of the leading innovators in digital accessibility. UserWay, a renowned provider of comprehensive digital accessibility software solutions, is the go-to choice for millions of websites globally, enhancing usability for individuals with disabilities. Leveraging cutting-edge AI technologies, UserWay empowers websites, apps, and digital documents to meet accessibility regulations, including the ADA, Section 508, AODA, and EAA, and global benchmarks like WCAG 2.2 and EN 301 549.
9. What pricing options are available for accessing the report?
Pricing options include single-user, multi-user, and enterprise licenses priced at USD 4750, USD 5250, and USD 8750 respectively.
10. Is the market size provided in terms of value or volume?
The market size is provided in terms of value, measured in Million.
11. Are there any specific market keywords associated with the report?
Yes, the market keyword associated with the report is "Digital Accessibility Software Market," which aids in identifying and referencing the specific market segment covered.
12. How do I determine which pricing option suits my needs best?
The pricing options vary based on user requirements and access needs. Individual users may opt for single-user licenses, while businesses requiring broader access may choose multi-user or enterprise licenses for cost-effective access to the report.
13. Are there any additional resources or data provided in the Digital Accessibility Software Market report?
While the report offers comprehensive insights, it's advisable to review the specific contents or supplementary materials provided to ascertain if additional resources or data are available.
14. How can I stay updated on further developments or reports in the Digital Accessibility Software Market?
To stay informed about further developments, trends, and reports in the Digital Accessibility Software Market, consider subscribing to industry newsletters, following relevant companies and organizations, or regularly checking reputable industry news sources and publications.
Methodology
Step 1 - Identification of Relevant Samples Size from Population Database


Step 2 - Approaches for Defining Global Market Size (Value, Volume* & Price*)

Note*: In applicable scenarios
Step 3 - Data Sources
Primary Research
- Web Analytics
- Survey Reports
- Research Institute
- Latest Research Reports
- Opinion Leaders
Secondary Research
- Annual Reports
- White Paper
- Latest Press Release
- Industry Association
- Paid Database
- Investor Presentations

Step 4 - Data Triangulation
Involves using different sources of information in order to increase the validity of a study
These sources are likely to be stakeholders in a program - participants, other researchers, program staff, other community members, and so on.
Then we put all data in single framework & apply various statistical tools to find out the dynamic on the market.
During the analysis stage, feedback from the stakeholder groups would be compared to determine areas of agreement as well as areas of divergence


