
Key Insights
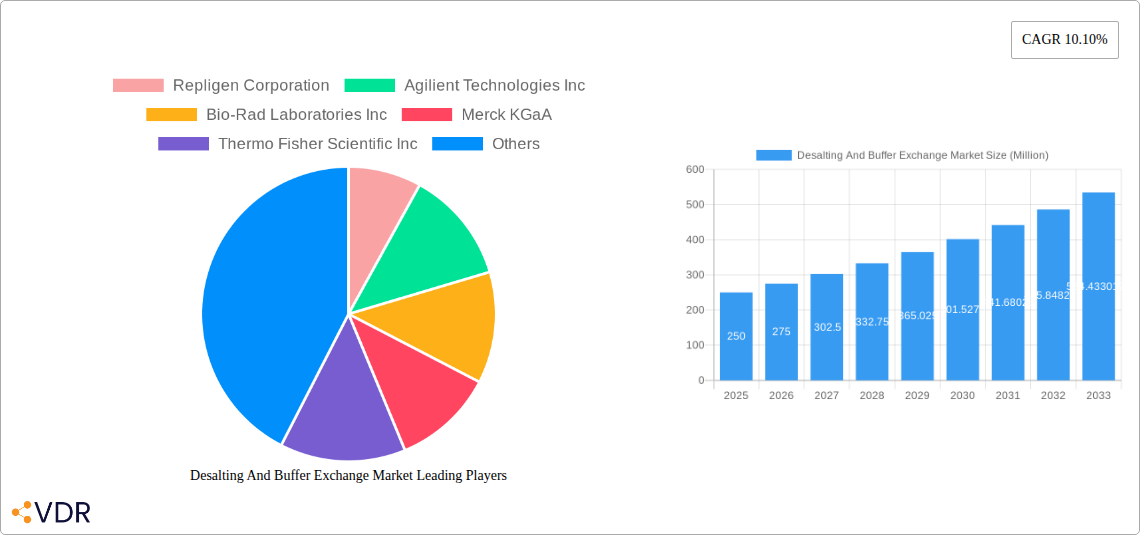
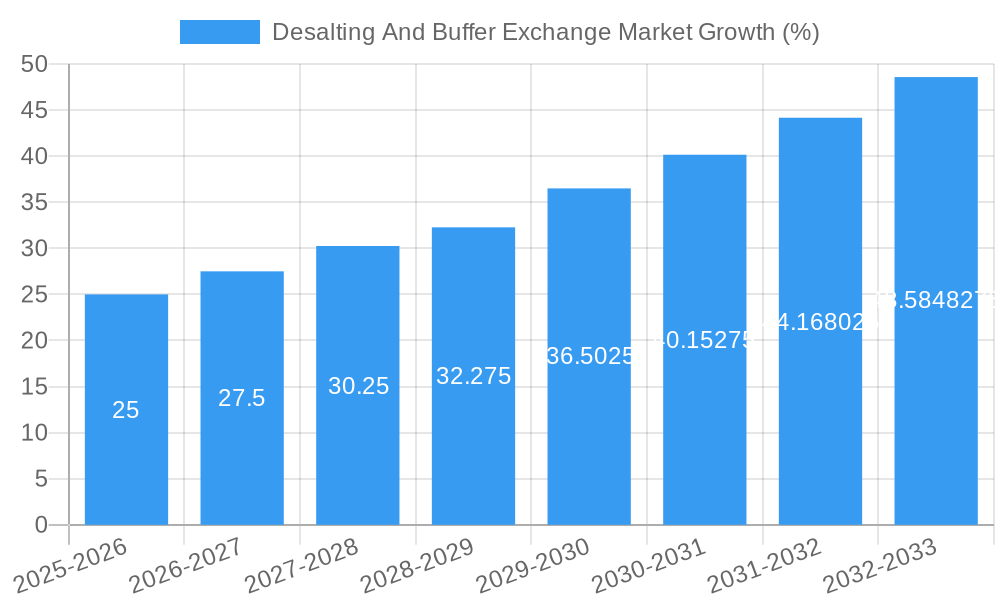
The Desalting and Buffer Exchange market, valued at approximately $XX million in 2025, is projected to experience robust growth, driven by a Compound Annual Growth Rate (CAGR) of 10.10% from 2025 to 2033. This expansion is fueled by several key factors. The pharmaceutical and biotechnology industries are major consumers, relying heavily on desalting and buffer exchange techniques for protein purification and other critical processes in drug development and manufacturing. The increasing prevalence of chronic diseases globally is driving demand for advanced diagnostics, further boosting market growth. Technological advancements, including the development of more efficient and automated systems like cassettes and cartridges, are streamlining workflows and enhancing the efficiency of these processes. Furthermore, the growing adoption of filtration techniques due to their cost-effectiveness and ease of use contributes significantly to market expansion. While challenges like the high cost of sophisticated chromatography systems exist, the overall market trajectory remains positive.
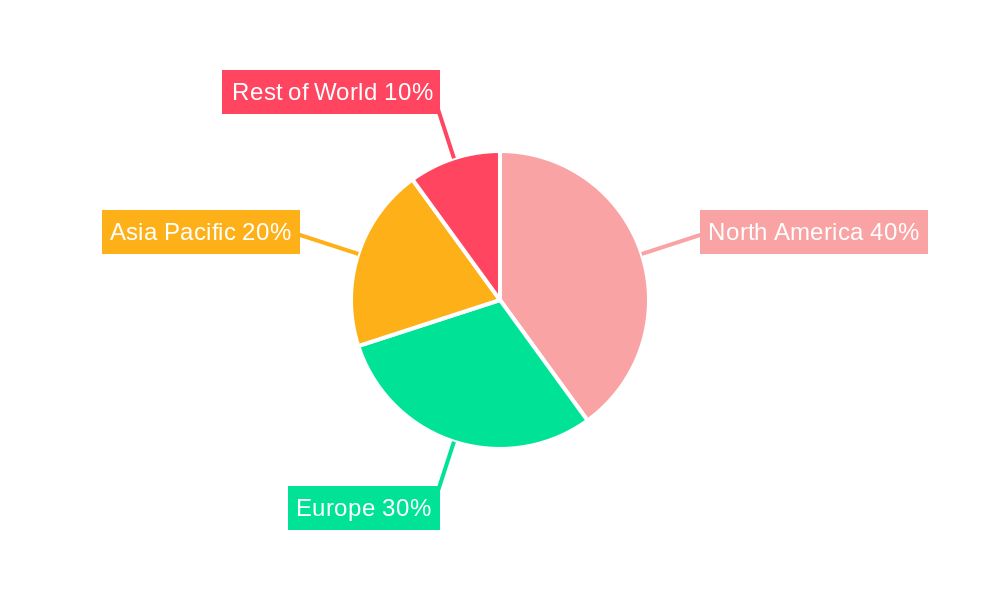
Market segmentation reveals that filtration techniques currently dominate, given their widespread application and relative affordability. However, chromatography is expected to show significant growth over the forecast period, driven by its superior resolution and ability to handle complex samples. Within applications, the pharmaceutical and biotechnology sectors hold the largest market share, followed by diagnostic applications. North America and Europe are currently leading regional markets, owing to strong regulatory frameworks and well-established research infrastructure. However, the Asia-Pacific region is anticipated to exhibit the fastest growth due to increasing investments in healthcare infrastructure and burgeoning pharmaceutical industries in countries like China and India. The competitive landscape is characterized by established players like Thermo Fisher Scientific, Merck KGaA, and Danaher Corporation, alongside several smaller, specialized companies. This competitive environment drives innovation and fosters the development of new products and technologies within the desalting and buffer exchange market.
Desalting and Buffer Exchange Market Report: 2019-2033
This comprehensive report provides a detailed analysis of the Desalting and Buffer Exchange Market, encompassing market dynamics, growth trends, regional analysis, product landscape, and key players. The report covers the period 2019-2033, with a base year of 2025 and a forecast period of 2025-2033. It segments the market by technique (Filtration, Chromatography, Precipitation), application (Pharmaceutical and Biotechnology Industries, Diagnostic Applications, Other Applications), and product (Cassettes and Cartridges, Kits, Filter Plates, Other Products). The market size is valued in million units.
Desalting and Buffer Exchange Market Dynamics & Structure
The Desalting and Buffer Exchange market is experiencing significant growth driven by technological advancements, increasing demand from the pharmaceutical and biotechnology industries, and rising adoption in diagnostic applications. Market concentration is moderate, with several key players holding significant market share. The market's structure is influenced by factors such as regulatory frameworks, technological innovation, and the presence of competitive substitute technologies. Mergers and acquisitions (M&A) activity is another key driver of market consolidation and innovation.
Market Structure Highlights:
- Market Concentration: Moderately concentrated, with top 5 players holding approximately xx% market share in 2024.
- Technological Innovation: Continuous advancements in filtration, chromatography, and precipitation techniques are driving market growth. Innovation barriers include high R&D costs and regulatory approvals.
- Regulatory Frameworks: Stringent regulatory requirements for pharmaceutical and diagnostic applications impact market dynamics. Compliance costs and timelines significantly influence the market.
- Competitive Product Substitutes: Limited direct substitutes exist; however, alternative purification methods can impact market share.
- End-User Demographics: The primary end-users are pharmaceutical and biotechnology companies, contract research organizations (CROs), and diagnostic labs.
- M&A Trends: Increasing M&A activity reflects the market's consolidation and the pursuit of technological advancements and expansion into new markets. An estimated xx M&A deals occurred between 2019 and 2024.
Desalting and Buffer Exchange Market Growth Trends & Insights
The Desalting and Buffer Exchange market exhibits robust growth, driven by the expanding pharmaceutical and biotechnology sectors, increased demand for personalized medicine, and a rising number of diagnostic tests. The market size experienced a CAGR of xx% from 2019 to 2024, and is projected to reach xx million units by 2033, with a CAGR of xx% during the forecast period (2025-2033). This growth is fueled by technological advancements leading to higher efficiency and automation in purification processes. Adoption rates are increasing across various applications, particularly in the pharmaceutical and biotechnology industries. Consumer behavior shifts towards higher quality and automated solutions contribute to the market expansion.
Dominant Regions, Countries, or Segments in Desalting and Buffer Exchange Market
North America currently holds the largest market share, followed by Europe and Asia Pacific. This dominance is attributed to the high concentration of pharmaceutical and biotechnology companies, well-established research infrastructure, and strong regulatory frameworks. The Pharmaceutical and Biotechnology Industries segment dominates the application sector due to high demand for efficient purification processes in drug discovery and development. Chromatography is the leading technique, owing to its high resolution and selectivity.
Key Drivers by Region/Segment:
- North America: Strong R&D investments, presence of major pharmaceutical companies, and advanced infrastructure.
- Europe: Growing pharmaceutical industry, stringent regulatory frameworks driving innovation, and increased adoption of advanced technologies.
- Asia Pacific: Rapid economic growth, rising healthcare expenditure, expanding biotechnology sector, and increasing government support for R&D.
- Pharmaceutical and Biotechnology Industries: High demand for efficient purification techniques in drug manufacturing and bioprocessing.
- Chromatography Technique: Superior resolution, selectivity, and suitability for various applications.
Desalting and Buffer Exchange Market Product Landscape
The product landscape includes cassettes and cartridges, kits, filter plates, and other specialized products. Innovation is focused on improving efficiency, automation, and scalability. Cassettes and cartridges are witnessing high demand due to convenience and ease of use. Kits are preferred for their all-in-one solutions, while filter plates are gaining popularity in high-throughput screening applications. Technological advancements include the development of novel membrane materials, improved chromatography resins, and automated systems.
Key Drivers, Barriers & Challenges in Desalting and Buffer Exchange Market
Key Drivers:
- Increasing demand from the pharmaceutical and biotechnology industries.
- Technological advancements leading to improved efficiency and automation.
- Rising adoption in diagnostic applications.
Challenges & Restraints:
- High cost of advanced technologies.
- Stringent regulatory requirements.
- Competition from alternative purification methods. The impact of these factors on market growth is estimated at approximately xx% reduction in projected growth.
Emerging Opportunities in Desalting and Buffer Exchange Market
- Growing demand for personalized medicine is driving the need for advanced purification technologies.
- Expanding applications in diagnostics and other fields offer new market opportunities.
- Development of novel materials and improved automation systems provides significant growth potential.
Growth Accelerators in the Desalting and Buffer Exchange Market Industry
Strategic partnerships, technological breakthroughs (e.g., microfluidic devices), and expansion into emerging markets are key growth accelerators. The increasing adoption of automation and digital technologies will further enhance efficiency and reduce operational costs, stimulating market growth.
Key Players Shaping the Desalting and Buffer Exchange Market Market
- Repligen Corporation
- Agilent Technologies Inc
- Bio-Rad Laboratories Inc
- Merck KGaA
- Thermo Fisher Scientific Inc
- Danaher Corporation (Cytvia)
- Bio-Works Technologies
- Sartorius AG
- GE HealthCare Technologies Inc
- Norgen Bioteck Corp
Notable Milestones in Desalting and Buffer Exchange Market Sector
- January 2023: Sartorius extended a strategic collaboration partnership agreement with RoosterBio Inc., strengthening its bioprocessing portfolio.
- June 2022: Trajan Group Holdings Limited acquired Chromatography Research Supplies, Inc. (CRS), expanding its consumables offerings.
- February 2022: Sartorius acquired the Novasep chromatography division, expanding its market share and product portfolio.
In-Depth Desalting and Buffer Exchange Market Market Outlook
The Desalting and Buffer Exchange market is poised for continued strong growth, driven by technological innovation, increasing demand from key sectors, and strategic partnerships. The market's future potential lies in the development of advanced, automated, and cost-effective purification technologies. Strategic alliances and expansion into emerging markets will play a crucial role in shaping the market landscape over the forecast period.
Desalting And Buffer Exchange Market Segmentation
-
1. Product
- 1.1. Cassettes and Catridges
- 1.2. Kits
- 1.3. Filter plates
- 1.4. Other Products
-
2. Technique
- 2.1. Filtration
- 2.2. Chromatography
- 2.3. Precipitation
-
3. Application
- 3.1. Pharmaceutical and Biotechnology Industries
- 3.2. Diagnostic Applications
- 3.3. Other Applications
Desalting And Buffer Exchange Market Segmentation By Geography
-
1. North America
- 1.1. United States
- 1.2. Canada
- 1.3. Mexico
-
2. Europe
- 2.1. Germany
- 2.2. United Kingdom
- 2.3. France
- 2.4. Italy
- 2.5. Spain
- 2.6. Rest of Europe
-
3. Asia Pacific
- 3.1. China
- 3.2. Japan
- 3.3. India
- 3.4. Australia
- 3.5. South Korea
- 3.6. Rest of Asia Pacific
-
4. Middle East and Africa
- 4.1. GCC
- 4.2. South Africa
- 4.3. Rest of Middle East and Africa
-
5. South America
- 5.1. Brazil
- 5.2. Argentina
- 5.3. Rest of South America
Desalting And Buffer Exchange Market REPORT HIGHLIGHTS
| Aspects | Details |
|---|---|
| Study Period | 2019-2033 |
| Base Year | 2024 |
| Estimated Year | 2025 |
| Forecast Period | 2025-2033 |
| Historical Period | 2019-2024 |
| Growth Rate | CAGR of 10.10% from 2019-2033 |
| Segmentation |
|
Table of Contents
- 1. Introduction
- 1.1. Research Scope
- 1.2. Market Segmentation
- 1.3. Research Methodology
- 1.4. Definitions and Assumptions
- 2. Executive Summary
- 2.1. Introduction
- 3. Market Dynamics
- 3.1. Introduction
- 3.2. Market Drivers
- 3.2.1. Increasing Research and Development by Biopharmaceutical Industries; Rising Focus on the Proteomic and Genomic Research
- 3.3. Market Restrains
- 3.3.1. Lack of Skilled Professionals
- 3.4. Market Trends
- 3.4.1. The Pharmaceutical and Biotechnology Industries Segment is Expected to Witness Significant Growth Over the Forecast Period
- 4. Market Factor Analysis
- 4.1. Porters Five Forces
- 4.2. Supply/Value Chain
- 4.3. PESTEL analysis
- 4.4. Market Entropy
- 4.5. Patent/Trademark Analysis
- 5. Global Desalting And Buffer Exchange Market Analysis, Insights and Forecast, 2019-2031
- 5.1. Market Analysis, Insights and Forecast - by Product
- 5.1.1. Cassettes and Catridges
- 5.1.2. Kits
- 5.1.3. Filter plates
- 5.1.4. Other Products
- 5.2. Market Analysis, Insights and Forecast - by Technique
- 5.2.1. Filtration
- 5.2.2. Chromatography
- 5.2.3. Precipitation
- 5.3. Market Analysis, Insights and Forecast - by Application
- 5.3.1. Pharmaceutical and Biotechnology Industries
- 5.3.2. Diagnostic Applications
- 5.3.3. Other Applications
- 5.4. Market Analysis, Insights and Forecast - by Region
- 5.4.1. North America
- 5.4.2. Europe
- 5.4.3. Asia Pacific
- 5.4.4. Middle East and Africa
- 5.4.5. South America
- 5.1. Market Analysis, Insights and Forecast - by Product
- 6. North America Desalting And Buffer Exchange Market Analysis, Insights and Forecast, 2019-2031
- 6.1. Market Analysis, Insights and Forecast - by Product
- 6.1.1. Cassettes and Catridges
- 6.1.2. Kits
- 6.1.3. Filter plates
- 6.1.4. Other Products
- 6.2. Market Analysis, Insights and Forecast - by Technique
- 6.2.1. Filtration
- 6.2.2. Chromatography
- 6.2.3. Precipitation
- 6.3. Market Analysis, Insights and Forecast - by Application
- 6.3.1. Pharmaceutical and Biotechnology Industries
- 6.3.2. Diagnostic Applications
- 6.3.3. Other Applications
- 6.1. Market Analysis, Insights and Forecast - by Product
- 7. Europe Desalting And Buffer Exchange Market Analysis, Insights and Forecast, 2019-2031
- 7.1. Market Analysis, Insights and Forecast - by Product
- 7.1.1. Cassettes and Catridges
- 7.1.2. Kits
- 7.1.3. Filter plates
- 7.1.4. Other Products
- 7.2. Market Analysis, Insights and Forecast - by Technique
- 7.2.1. Filtration
- 7.2.2. Chromatography
- 7.2.3. Precipitation
- 7.3. Market Analysis, Insights and Forecast - by Application
- 7.3.1. Pharmaceutical and Biotechnology Industries
- 7.3.2. Diagnostic Applications
- 7.3.3. Other Applications
- 7.1. Market Analysis, Insights and Forecast - by Product
- 8. Asia Pacific Desalting And Buffer Exchange Market Analysis, Insights and Forecast, 2019-2031
- 8.1. Market Analysis, Insights and Forecast - by Product
- 8.1.1. Cassettes and Catridges
- 8.1.2. Kits
- 8.1.3. Filter plates
- 8.1.4. Other Products
- 8.2. Market Analysis, Insights and Forecast - by Technique
- 8.2.1. Filtration
- 8.2.2. Chromatography
- 8.2.3. Precipitation
- 8.3. Market Analysis, Insights and Forecast - by Application
- 8.3.1. Pharmaceutical and Biotechnology Industries
- 8.3.2. Diagnostic Applications
- 8.3.3. Other Applications
- 8.1. Market Analysis, Insights and Forecast - by Product
- 9. Middle East and Africa Desalting And Buffer Exchange Market Analysis, Insights and Forecast, 2019-2031
- 9.1. Market Analysis, Insights and Forecast - by Product
- 9.1.1. Cassettes and Catridges
- 9.1.2. Kits
- 9.1.3. Filter plates
- 9.1.4. Other Products
- 9.2. Market Analysis, Insights and Forecast - by Technique
- 9.2.1. Filtration
- 9.2.2. Chromatography
- 9.2.3. Precipitation
- 9.3. Market Analysis, Insights and Forecast - by Application
- 9.3.1. Pharmaceutical and Biotechnology Industries
- 9.3.2. Diagnostic Applications
- 9.3.3. Other Applications
- 9.1. Market Analysis, Insights and Forecast - by Product
- 10. South America Desalting And Buffer Exchange Market Analysis, Insights and Forecast, 2019-2031
- 10.1. Market Analysis, Insights and Forecast - by Product
- 10.1.1. Cassettes and Catridges
- 10.1.2. Kits
- 10.1.3. Filter plates
- 10.1.4. Other Products
- 10.2. Market Analysis, Insights and Forecast - by Technique
- 10.2.1. Filtration
- 10.2.2. Chromatography
- 10.2.3. Precipitation
- 10.3. Market Analysis, Insights and Forecast - by Application
- 10.3.1. Pharmaceutical and Biotechnology Industries
- 10.3.2. Diagnostic Applications
- 10.3.3. Other Applications
- 10.1. Market Analysis, Insights and Forecast - by Product
- 11. North America Desalting And Buffer Exchange Market Analysis, Insights and Forecast, 2019-2031
- 11.1. Market Analysis, Insights and Forecast - By Country/Sub-region
- 11.1.1 United States
- 11.1.2 Canada
- 11.1.3 Mexico
- 12. Europe Desalting And Buffer Exchange Market Analysis, Insights and Forecast, 2019-2031
- 12.1. Market Analysis, Insights and Forecast - By Country/Sub-region
- 12.1.1 Germany
- 12.1.2 United Kingdom
- 12.1.3 France
- 12.1.4 Italy
- 12.1.5 Spain
- 12.1.6 Rest of Europe
- 13. Asia Pacific Desalting And Buffer Exchange Market Analysis, Insights and Forecast, 2019-2031
- 13.1. Market Analysis, Insights and Forecast - By Country/Sub-region
- 13.1.1 China
- 13.1.2 Japan
- 13.1.3 India
- 13.1.4 Australia
- 13.1.5 South Korea
- 13.1.6 Rest of Asia Pacific
- 14. Middle East and Africa Desalting And Buffer Exchange Market Analysis, Insights and Forecast, 2019-2031
- 14.1. Market Analysis, Insights and Forecast - By Country/Sub-region
- 14.1.1 GCC
- 14.1.2 South Africa
- 14.1.3 Rest of Middle East and Africa
- 15. South America Desalting And Buffer Exchange Market Analysis, Insights and Forecast, 2019-2031
- 15.1. Market Analysis, Insights and Forecast - By Country/Sub-region
- 15.1.1 Brazil
- 15.1.2 Argentina
- 15.1.3 Rest of South America
- 16. Competitive Analysis
- 16.1. Global Market Share Analysis 2024
- 16.2. Company Profiles
- 16.2.1 Repligen Corporation
- 16.2.1.1. Overview
- 16.2.1.2. Products
- 16.2.1.3. SWOT Analysis
- 16.2.1.4. Recent Developments
- 16.2.1.5. Financials (Based on Availability)
- 16.2.2 Agilient Technologies Inc
- 16.2.2.1. Overview
- 16.2.2.2. Products
- 16.2.2.3. SWOT Analysis
- 16.2.2.4. Recent Developments
- 16.2.2.5. Financials (Based on Availability)
- 16.2.3 Bio-Rad Laboratories Inc
- 16.2.3.1. Overview
- 16.2.3.2. Products
- 16.2.3.3. SWOT Analysis
- 16.2.3.4. Recent Developments
- 16.2.3.5. Financials (Based on Availability)
- 16.2.4 Merck KGaA
- 16.2.4.1. Overview
- 16.2.4.2. Products
- 16.2.4.3. SWOT Analysis
- 16.2.4.4. Recent Developments
- 16.2.4.5. Financials (Based on Availability)
- 16.2.5 Thermo Fisher Scientific Inc
- 16.2.5.1. Overview
- 16.2.5.2. Products
- 16.2.5.3. SWOT Analysis
- 16.2.5.4. Recent Developments
- 16.2.5.5. Financials (Based on Availability)
- 16.2.6 Danaher Corporation (Cytvia)
- 16.2.6.1. Overview
- 16.2.6.2. Products
- 16.2.6.3. SWOT Analysis
- 16.2.6.4. Recent Developments
- 16.2.6.5. Financials (Based on Availability)
- 16.2.7 Bio-Works Technologies
- 16.2.7.1. Overview
- 16.2.7.2. Products
- 16.2.7.3. SWOT Analysis
- 16.2.7.4. Recent Developments
- 16.2.7.5. Financials (Based on Availability)
- 16.2.8 Sartorius AG
- 16.2.8.1. Overview
- 16.2.8.2. Products
- 16.2.8.3. SWOT Analysis
- 16.2.8.4. Recent Developments
- 16.2.8.5. Financials (Based on Availability)
- 16.2.9 GE HealthCare Technologies Inc
- 16.2.9.1. Overview
- 16.2.9.2. Products
- 16.2.9.3. SWOT Analysis
- 16.2.9.4. Recent Developments
- 16.2.9.5. Financials (Based on Availability)
- 16.2.10 Norgen Bioteck Corp
- 16.2.10.1. Overview
- 16.2.10.2. Products
- 16.2.10.3. SWOT Analysis
- 16.2.10.4. Recent Developments
- 16.2.10.5. Financials (Based on Availability)
- 16.2.1 Repligen Corporation
List of Figures
- Figure 1: Global Desalting And Buffer Exchange Market Revenue Breakdown (Million, %) by Region 2024 & 2032
- Figure 2: Global Desalting And Buffer Exchange Market Volume Breakdown (K Unit, %) by Region 2024 & 2032
- Figure 3: North America Desalting And Buffer Exchange Market Revenue (Million), by Country 2024 & 2032
- Figure 4: North America Desalting And Buffer Exchange Market Volume (K Unit), by Country 2024 & 2032
- Figure 5: North America Desalting And Buffer Exchange Market Revenue Share (%), by Country 2024 & 2032
- Figure 6: North America Desalting And Buffer Exchange Market Volume Share (%), by Country 2024 & 2032
- Figure 7: Europe Desalting And Buffer Exchange Market Revenue (Million), by Country 2024 & 2032
- Figure 8: Europe Desalting And Buffer Exchange Market Volume (K Unit), by Country 2024 & 2032
- Figure 9: Europe Desalting And Buffer Exchange Market Revenue Share (%), by Country 2024 & 2032
- Figure 10: Europe Desalting And Buffer Exchange Market Volume Share (%), by Country 2024 & 2032
- Figure 11: Asia Pacific Desalting And Buffer Exchange Market Revenue (Million), by Country 2024 & 2032
- Figure 12: Asia Pacific Desalting And Buffer Exchange Market Volume (K Unit), by Country 2024 & 2032
- Figure 13: Asia Pacific Desalting And Buffer Exchange Market Revenue Share (%), by Country 2024 & 2032
- Figure 14: Asia Pacific Desalting And Buffer Exchange Market Volume Share (%), by Country 2024 & 2032
- Figure 15: Middle East and Africa Desalting And Buffer Exchange Market Revenue (Million), by Country 2024 & 2032
- Figure 16: Middle East and Africa Desalting And Buffer Exchange Market Volume (K Unit), by Country 2024 & 2032
- Figure 17: Middle East and Africa Desalting And Buffer Exchange Market Revenue Share (%), by Country 2024 & 2032
- Figure 18: Middle East and Africa Desalting And Buffer Exchange Market Volume Share (%), by Country 2024 & 2032
- Figure 19: South America Desalting And Buffer Exchange Market Revenue (Million), by Country 2024 & 2032
- Figure 20: South America Desalting And Buffer Exchange Market Volume (K Unit), by Country 2024 & 2032
- Figure 21: South America Desalting And Buffer Exchange Market Revenue Share (%), by Country 2024 & 2032
- Figure 22: South America Desalting And Buffer Exchange Market Volume Share (%), by Country 2024 & 2032
- Figure 23: North America Desalting And Buffer Exchange Market Revenue (Million), by Product 2024 & 2032
- Figure 24: North America Desalting And Buffer Exchange Market Volume (K Unit), by Product 2024 & 2032
- Figure 25: North America Desalting And Buffer Exchange Market Revenue Share (%), by Product 2024 & 2032
- Figure 26: North America Desalting And Buffer Exchange Market Volume Share (%), by Product 2024 & 2032
- Figure 27: North America Desalting And Buffer Exchange Market Revenue (Million), by Technique 2024 & 2032
- Figure 28: North America Desalting And Buffer Exchange Market Volume (K Unit), by Technique 2024 & 2032
- Figure 29: North America Desalting And Buffer Exchange Market Revenue Share (%), by Technique 2024 & 2032
- Figure 30: North America Desalting And Buffer Exchange Market Volume Share (%), by Technique 2024 & 2032
- Figure 31: North America Desalting And Buffer Exchange Market Revenue (Million), by Application 2024 & 2032
- Figure 32: North America Desalting And Buffer Exchange Market Volume (K Unit), by Application 2024 & 2032
- Figure 33: North America Desalting And Buffer Exchange Market Revenue Share (%), by Application 2024 & 2032
- Figure 34: North America Desalting And Buffer Exchange Market Volume Share (%), by Application 2024 & 2032
- Figure 35: North America Desalting And Buffer Exchange Market Revenue (Million), by Country 2024 & 2032
- Figure 36: North America Desalting And Buffer Exchange Market Volume (K Unit), by Country 2024 & 2032
- Figure 37: North America Desalting And Buffer Exchange Market Revenue Share (%), by Country 2024 & 2032
- Figure 38: North America Desalting And Buffer Exchange Market Volume Share (%), by Country 2024 & 2032
- Figure 39: Europe Desalting And Buffer Exchange Market Revenue (Million), by Product 2024 & 2032
- Figure 40: Europe Desalting And Buffer Exchange Market Volume (K Unit), by Product 2024 & 2032
- Figure 41: Europe Desalting And Buffer Exchange Market Revenue Share (%), by Product 2024 & 2032
- Figure 42: Europe Desalting And Buffer Exchange Market Volume Share (%), by Product 2024 & 2032
- Figure 43: Europe Desalting And Buffer Exchange Market Revenue (Million), by Technique 2024 & 2032
- Figure 44: Europe Desalting And Buffer Exchange Market Volume (K Unit), by Technique 2024 & 2032
- Figure 45: Europe Desalting And Buffer Exchange Market Revenue Share (%), by Technique 2024 & 2032
- Figure 46: Europe Desalting And Buffer Exchange Market Volume Share (%), by Technique 2024 & 2032
- Figure 47: Europe Desalting And Buffer Exchange Market Revenue (Million), by Application 2024 & 2032
- Figure 48: Europe Desalting And Buffer Exchange Market Volume (K Unit), by Application 2024 & 2032
- Figure 49: Europe Desalting And Buffer Exchange Market Revenue Share (%), by Application 2024 & 2032
- Figure 50: Europe Desalting And Buffer Exchange Market Volume Share (%), by Application 2024 & 2032
- Figure 51: Europe Desalting And Buffer Exchange Market Revenue (Million), by Country 2024 & 2032
- Figure 52: Europe Desalting And Buffer Exchange Market Volume (K Unit), by Country 2024 & 2032
- Figure 53: Europe Desalting And Buffer Exchange Market Revenue Share (%), by Country 2024 & 2032
- Figure 54: Europe Desalting And Buffer Exchange Market Volume Share (%), by Country 2024 & 2032
- Figure 55: Asia Pacific Desalting And Buffer Exchange Market Revenue (Million), by Product 2024 & 2032
- Figure 56: Asia Pacific Desalting And Buffer Exchange Market Volume (K Unit), by Product 2024 & 2032
- Figure 57: Asia Pacific Desalting And Buffer Exchange Market Revenue Share (%), by Product 2024 & 2032
- Figure 58: Asia Pacific Desalting And Buffer Exchange Market Volume Share (%), by Product 2024 & 2032
- Figure 59: Asia Pacific Desalting And Buffer Exchange Market Revenue (Million), by Technique 2024 & 2032
- Figure 60: Asia Pacific Desalting And Buffer Exchange Market Volume (K Unit), by Technique 2024 & 2032
- Figure 61: Asia Pacific Desalting And Buffer Exchange Market Revenue Share (%), by Technique 2024 & 2032
- Figure 62: Asia Pacific Desalting And Buffer Exchange Market Volume Share (%), by Technique 2024 & 2032
- Figure 63: Asia Pacific Desalting And Buffer Exchange Market Revenue (Million), by Application 2024 & 2032
- Figure 64: Asia Pacific Desalting And Buffer Exchange Market Volume (K Unit), by Application 2024 & 2032
- Figure 65: Asia Pacific Desalting And Buffer Exchange Market Revenue Share (%), by Application 2024 & 2032
- Figure 66: Asia Pacific Desalting And Buffer Exchange Market Volume Share (%), by Application 2024 & 2032
- Figure 67: Asia Pacific Desalting And Buffer Exchange Market Revenue (Million), by Country 2024 & 2032
- Figure 68: Asia Pacific Desalting And Buffer Exchange Market Volume (K Unit), by Country 2024 & 2032
- Figure 69: Asia Pacific Desalting And Buffer Exchange Market Revenue Share (%), by Country 2024 & 2032
- Figure 70: Asia Pacific Desalting And Buffer Exchange Market Volume Share (%), by Country 2024 & 2032
- Figure 71: Middle East and Africa Desalting And Buffer Exchange Market Revenue (Million), by Product 2024 & 2032
- Figure 72: Middle East and Africa Desalting And Buffer Exchange Market Volume (K Unit), by Product 2024 & 2032
- Figure 73: Middle East and Africa Desalting And Buffer Exchange Market Revenue Share (%), by Product 2024 & 2032
- Figure 74: Middle East and Africa Desalting And Buffer Exchange Market Volume Share (%), by Product 2024 & 2032
- Figure 75: Middle East and Africa Desalting And Buffer Exchange Market Revenue (Million), by Technique 2024 & 2032
- Figure 76: Middle East and Africa Desalting And Buffer Exchange Market Volume (K Unit), by Technique 2024 & 2032
- Figure 77: Middle East and Africa Desalting And Buffer Exchange Market Revenue Share (%), by Technique 2024 & 2032
- Figure 78: Middle East and Africa Desalting And Buffer Exchange Market Volume Share (%), by Technique 2024 & 2032
- Figure 79: Middle East and Africa Desalting And Buffer Exchange Market Revenue (Million), by Application 2024 & 2032
- Figure 80: Middle East and Africa Desalting And Buffer Exchange Market Volume (K Unit), by Application 2024 & 2032
- Figure 81: Middle East and Africa Desalting And Buffer Exchange Market Revenue Share (%), by Application 2024 & 2032
- Figure 82: Middle East and Africa Desalting And Buffer Exchange Market Volume Share (%), by Application 2024 & 2032
- Figure 83: Middle East and Africa Desalting And Buffer Exchange Market Revenue (Million), by Country 2024 & 2032
- Figure 84: Middle East and Africa Desalting And Buffer Exchange Market Volume (K Unit), by Country 2024 & 2032
- Figure 85: Middle East and Africa Desalting And Buffer Exchange Market Revenue Share (%), by Country 2024 & 2032
- Figure 86: Middle East and Africa Desalting And Buffer Exchange Market Volume Share (%), by Country 2024 & 2032
- Figure 87: South America Desalting And Buffer Exchange Market Revenue (Million), by Product 2024 & 2032
- Figure 88: South America Desalting And Buffer Exchange Market Volume (K Unit), by Product 2024 & 2032
- Figure 89: South America Desalting And Buffer Exchange Market Revenue Share (%), by Product 2024 & 2032
- Figure 90: South America Desalting And Buffer Exchange Market Volume Share (%), by Product 2024 & 2032
- Figure 91: South America Desalting And Buffer Exchange Market Revenue (Million), by Technique 2024 & 2032
- Figure 92: South America Desalting And Buffer Exchange Market Volume (K Unit), by Technique 2024 & 2032
- Figure 93: South America Desalting And Buffer Exchange Market Revenue Share (%), by Technique 2024 & 2032
- Figure 94: South America Desalting And Buffer Exchange Market Volume Share (%), by Technique 2024 & 2032
- Figure 95: South America Desalting And Buffer Exchange Market Revenue (Million), by Application 2024 & 2032
- Figure 96: South America Desalting And Buffer Exchange Market Volume (K Unit), by Application 2024 & 2032
- Figure 97: South America Desalting And Buffer Exchange Market Revenue Share (%), by Application 2024 & 2032
- Figure 98: South America Desalting And Buffer Exchange Market Volume Share (%), by Application 2024 & 2032
- Figure 99: South America Desalting And Buffer Exchange Market Revenue (Million), by Country 2024 & 2032
- Figure 100: South America Desalting And Buffer Exchange Market Volume (K Unit), by Country 2024 & 2032
- Figure 101: South America Desalting And Buffer Exchange Market Revenue Share (%), by Country 2024 & 2032
- Figure 102: South America Desalting And Buffer Exchange Market Volume Share (%), by Country 2024 & 2032
List of Tables
- Table 1: Global Desalting And Buffer Exchange Market Revenue Million Forecast, by Region 2019 & 2032
- Table 2: Global Desalting And Buffer Exchange Market Volume K Unit Forecast, by Region 2019 & 2032
- Table 3: Global Desalting And Buffer Exchange Market Revenue Million Forecast, by Product 2019 & 2032
- Table 4: Global Desalting And Buffer Exchange Market Volume K Unit Forecast, by Product 2019 & 2032
- Table 5: Global Desalting And Buffer Exchange Market Revenue Million Forecast, by Technique 2019 & 2032
- Table 6: Global Desalting And Buffer Exchange Market Volume K Unit Forecast, by Technique 2019 & 2032
- Table 7: Global Desalting And Buffer Exchange Market Revenue Million Forecast, by Application 2019 & 2032
- Table 8: Global Desalting And Buffer Exchange Market Volume K Unit Forecast, by Application 2019 & 2032
- Table 9: Global Desalting And Buffer Exchange Market Revenue Million Forecast, by Region 2019 & 2032
- Table 10: Global Desalting And Buffer Exchange Market Volume K Unit Forecast, by Region 2019 & 2032
- Table 11: Global Desalting And Buffer Exchange Market Revenue Million Forecast, by Country 2019 & 2032
- Table 12: Global Desalting And Buffer Exchange Market Volume K Unit Forecast, by Country 2019 & 2032
- Table 13: United States Desalting And Buffer Exchange Market Revenue (Million) Forecast, by Application 2019 & 2032
- Table 14: United States Desalting And Buffer Exchange Market Volume (K Unit) Forecast, by Application 2019 & 2032
- Table 15: Canada Desalting And Buffer Exchange Market Revenue (Million) Forecast, by Application 2019 & 2032
- Table 16: Canada Desalting And Buffer Exchange Market Volume (K Unit) Forecast, by Application 2019 & 2032
- Table 17: Mexico Desalting And Buffer Exchange Market Revenue (Million) Forecast, by Application 2019 & 2032
- Table 18: Mexico Desalting And Buffer Exchange Market Volume (K Unit) Forecast, by Application 2019 & 2032
- Table 19: Global Desalting And Buffer Exchange Market Revenue Million Forecast, by Country 2019 & 2032
- Table 20: Global Desalting And Buffer Exchange Market Volume K Unit Forecast, by Country 2019 & 2032
- Table 21: Germany Desalting And Buffer Exchange Market Revenue (Million) Forecast, by Application 2019 & 2032
- Table 22: Germany Desalting And Buffer Exchange Market Volume (K Unit) Forecast, by Application 2019 & 2032
- Table 23: United Kingdom Desalting And Buffer Exchange Market Revenue (Million) Forecast, by Application 2019 & 2032
- Table 24: United Kingdom Desalting And Buffer Exchange Market Volume (K Unit) Forecast, by Application 2019 & 2032
- Table 25: France Desalting And Buffer Exchange Market Revenue (Million) Forecast, by Application 2019 & 2032
- Table 26: France Desalting And Buffer Exchange Market Volume (K Unit) Forecast, by Application 2019 & 2032
- Table 27: Italy Desalting And Buffer Exchange Market Revenue (Million) Forecast, by Application 2019 & 2032
- Table 28: Italy Desalting And Buffer Exchange Market Volume (K Unit) Forecast, by Application 2019 & 2032
- Table 29: Spain Desalting And Buffer Exchange Market Revenue (Million) Forecast, by Application 2019 & 2032
- Table 30: Spain Desalting And Buffer Exchange Market Volume (K Unit) Forecast, by Application 2019 & 2032
- Table 31: Rest of Europe Desalting And Buffer Exchange Market Revenue (Million) Forecast, by Application 2019 & 2032
- Table 32: Rest of Europe Desalting And Buffer Exchange Market Volume (K Unit) Forecast, by Application 2019 & 2032
- Table 33: Global Desalting And Buffer Exchange Market Revenue Million Forecast, by Country 2019 & 2032
- Table 34: Global Desalting And Buffer Exchange Market Volume K Unit Forecast, by Country 2019 & 2032
- Table 35: China Desalting And Buffer Exchange Market Revenue (Million) Forecast, by Application 2019 & 2032
- Table 36: China Desalting And Buffer Exchange Market Volume (K Unit) Forecast, by Application 2019 & 2032
- Table 37: Japan Desalting And Buffer Exchange Market Revenue (Million) Forecast, by Application 2019 & 2032
- Table 38: Japan Desalting And Buffer Exchange Market Volume (K Unit) Forecast, by Application 2019 & 2032
- Table 39: India Desalting And Buffer Exchange Market Revenue (Million) Forecast, by Application 2019 & 2032
- Table 40: India Desalting And Buffer Exchange Market Volume (K Unit) Forecast, by Application 2019 & 2032
- Table 41: Australia Desalting And Buffer Exchange Market Revenue (Million) Forecast, by Application 2019 & 2032
- Table 42: Australia Desalting And Buffer Exchange Market Volume (K Unit) Forecast, by Application 2019 & 2032
- Table 43: South Korea Desalting And Buffer Exchange Market Revenue (Million) Forecast, by Application 2019 & 2032
- Table 44: South Korea Desalting And Buffer Exchange Market Volume (K Unit) Forecast, by Application 2019 & 2032
- Table 45: Rest of Asia Pacific Desalting And Buffer Exchange Market Revenue (Million) Forecast, by Application 2019 & 2032
- Table 46: Rest of Asia Pacific Desalting And Buffer Exchange Market Volume (K Unit) Forecast, by Application 2019 & 2032
- Table 47: Global Desalting And Buffer Exchange Market Revenue Million Forecast, by Country 2019 & 2032
- Table 48: Global Desalting And Buffer Exchange Market Volume K Unit Forecast, by Country 2019 & 2032
- Table 49: GCC Desalting And Buffer Exchange Market Revenue (Million) Forecast, by Application 2019 & 2032
- Table 50: GCC Desalting And Buffer Exchange Market Volume (K Unit) Forecast, by Application 2019 & 2032
- Table 51: South Africa Desalting And Buffer Exchange Market Revenue (Million) Forecast, by Application 2019 & 2032
- Table 52: South Africa Desalting And Buffer Exchange Market Volume (K Unit) Forecast, by Application 2019 & 2032
- Table 53: Rest of Middle East and Africa Desalting And Buffer Exchange Market Revenue (Million) Forecast, by Application 2019 & 2032
- Table 54: Rest of Middle East and Africa Desalting And Buffer Exchange Market Volume (K Unit) Forecast, by Application 2019 & 2032
- Table 55: Global Desalting And Buffer Exchange Market Revenue Million Forecast, by Country 2019 & 2032
- Table 56: Global Desalting And Buffer Exchange Market Volume K Unit Forecast, by Country 2019 & 2032
- Table 57: Brazil Desalting And Buffer Exchange Market Revenue (Million) Forecast, by Application 2019 & 2032
- Table 58: Brazil Desalting And Buffer Exchange Market Volume (K Unit) Forecast, by Application 2019 & 2032
- Table 59: Argentina Desalting And Buffer Exchange Market Revenue (Million) Forecast, by Application 2019 & 2032
- Table 60: Argentina Desalting And Buffer Exchange Market Volume (K Unit) Forecast, by Application 2019 & 2032
- Table 61: Rest of South America Desalting And Buffer Exchange Market Revenue (Million) Forecast, by Application 2019 & 2032
- Table 62: Rest of South America Desalting And Buffer Exchange Market Volume (K Unit) Forecast, by Application 2019 & 2032
- Table 63: Global Desalting And Buffer Exchange Market Revenue Million Forecast, by Product 2019 & 2032
- Table 64: Global Desalting And Buffer Exchange Market Volume K Unit Forecast, by Product 2019 & 2032
- Table 65: Global Desalting And Buffer Exchange Market Revenue Million Forecast, by Technique 2019 & 2032
- Table 66: Global Desalting And Buffer Exchange Market Volume K Unit Forecast, by Technique 2019 & 2032
- Table 67: Global Desalting And Buffer Exchange Market Revenue Million Forecast, by Application 2019 & 2032
- Table 68: Global Desalting And Buffer Exchange Market Volume K Unit Forecast, by Application 2019 & 2032
- Table 69: Global Desalting And Buffer Exchange Market Revenue Million Forecast, by Country 2019 & 2032
- Table 70: Global Desalting And Buffer Exchange Market Volume K Unit Forecast, by Country 2019 & 2032
- Table 71: United States Desalting And Buffer Exchange Market Revenue (Million) Forecast, by Application 2019 & 2032
- Table 72: United States Desalting And Buffer Exchange Market Volume (K Unit) Forecast, by Application 2019 & 2032
- Table 73: Canada Desalting And Buffer Exchange Market Revenue (Million) Forecast, by Application 2019 & 2032
- Table 74: Canada Desalting And Buffer Exchange Market Volume (K Unit) Forecast, by Application 2019 & 2032
- Table 75: Mexico Desalting And Buffer Exchange Market Revenue (Million) Forecast, by Application 2019 & 2032
- Table 76: Mexico Desalting And Buffer Exchange Market Volume (K Unit) Forecast, by Application 2019 & 2032
- Table 77: Global Desalting And Buffer Exchange Market Revenue Million Forecast, by Product 2019 & 2032
- Table 78: Global Desalting And Buffer Exchange Market Volume K Unit Forecast, by Product 2019 & 2032
- Table 79: Global Desalting And Buffer Exchange Market Revenue Million Forecast, by Technique 2019 & 2032
- Table 80: Global Desalting And Buffer Exchange Market Volume K Unit Forecast, by Technique 2019 & 2032
- Table 81: Global Desalting And Buffer Exchange Market Revenue Million Forecast, by Application 2019 & 2032
- Table 82: Global Desalting And Buffer Exchange Market Volume K Unit Forecast, by Application 2019 & 2032
- Table 83: Global Desalting And Buffer Exchange Market Revenue Million Forecast, by Country 2019 & 2032
- Table 84: Global Desalting And Buffer Exchange Market Volume K Unit Forecast, by Country 2019 & 2032
- Table 85: Germany Desalting And Buffer Exchange Market Revenue (Million) Forecast, by Application 2019 & 2032
- Table 86: Germany Desalting And Buffer Exchange Market Volume (K Unit) Forecast, by Application 2019 & 2032
- Table 87: United Kingdom Desalting And Buffer Exchange Market Revenue (Million) Forecast, by Application 2019 & 2032
- Table 88: United Kingdom Desalting And Buffer Exchange Market Volume (K Unit) Forecast, by Application 2019 & 2032
- Table 89: France Desalting And Buffer Exchange Market Revenue (Million) Forecast, by Application 2019 & 2032
- Table 90: France Desalting And Buffer Exchange Market Volume (K Unit) Forecast, by Application 2019 & 2032
- Table 91: Italy Desalting And Buffer Exchange Market Revenue (Million) Forecast, by Application 2019 & 2032
- Table 92: Italy Desalting And Buffer Exchange Market Volume (K Unit) Forecast, by Application 2019 & 2032
- Table 93: Spain Desalting And Buffer Exchange Market Revenue (Million) Forecast, by Application 2019 & 2032
- Table 94: Spain Desalting And Buffer Exchange Market Volume (K Unit) Forecast, by Application 2019 & 2032
- Table 95: Rest of Europe Desalting And Buffer Exchange Market Revenue (Million) Forecast, by Application 2019 & 2032
- Table 96: Rest of Europe Desalting And Buffer Exchange Market Volume (K Unit) Forecast, by Application 2019 & 2032
- Table 97: Global Desalting And Buffer Exchange Market Revenue Million Forecast, by Product 2019 & 2032
- Table 98: Global Desalting And Buffer Exchange Market Volume K Unit Forecast, by Product 2019 & 2032
- Table 99: Global Desalting And Buffer Exchange Market Revenue Million Forecast, by Technique 2019 & 2032
- Table 100: Global Desalting And Buffer Exchange Market Volume K Unit Forecast, by Technique 2019 & 2032
- Table 101: Global Desalting And Buffer Exchange Market Revenue Million Forecast, by Application 2019 & 2032
- Table 102: Global Desalting And Buffer Exchange Market Volume K Unit Forecast, by Application 2019 & 2032
- Table 103: Global Desalting And Buffer Exchange Market Revenue Million Forecast, by Country 2019 & 2032
- Table 104: Global Desalting And Buffer Exchange Market Volume K Unit Forecast, by Country 2019 & 2032
- Table 105: China Desalting And Buffer Exchange Market Revenue (Million) Forecast, by Application 2019 & 2032
- Table 106: China Desalting And Buffer Exchange Market Volume (K Unit) Forecast, by Application 2019 & 2032
- Table 107: Japan Desalting And Buffer Exchange Market Revenue (Million) Forecast, by Application 2019 & 2032
- Table 108: Japan Desalting And Buffer Exchange Market Volume (K Unit) Forecast, by Application 2019 & 2032
- Table 109: India Desalting And Buffer Exchange Market Revenue (Million) Forecast, by Application 2019 & 2032
- Table 110: India Desalting And Buffer Exchange Market Volume (K Unit) Forecast, by Application 2019 & 2032
- Table 111: Australia Desalting And Buffer Exchange Market Revenue (Million) Forecast, by Application 2019 & 2032
- Table 112: Australia Desalting And Buffer Exchange Market Volume (K Unit) Forecast, by Application 2019 & 2032
- Table 113: South Korea Desalting And Buffer Exchange Market Revenue (Million) Forecast, by Application 2019 & 2032
- Table 114: South Korea Desalting And Buffer Exchange Market Volume (K Unit) Forecast, by Application 2019 & 2032
- Table 115: Rest of Asia Pacific Desalting And Buffer Exchange Market Revenue (Million) Forecast, by Application 2019 & 2032
- Table 116: Rest of Asia Pacific Desalting And Buffer Exchange Market Volume (K Unit) Forecast, by Application 2019 & 2032
- Table 117: Global Desalting And Buffer Exchange Market Revenue Million Forecast, by Product 2019 & 2032
- Table 118: Global Desalting And Buffer Exchange Market Volume K Unit Forecast, by Product 2019 & 2032
- Table 119: Global Desalting And Buffer Exchange Market Revenue Million Forecast, by Technique 2019 & 2032
- Table 120: Global Desalting And Buffer Exchange Market Volume K Unit Forecast, by Technique 2019 & 2032
- Table 121: Global Desalting And Buffer Exchange Market Revenue Million Forecast, by Application 2019 & 2032
- Table 122: Global Desalting And Buffer Exchange Market Volume K Unit Forecast, by Application 2019 & 2032
- Table 123: Global Desalting And Buffer Exchange Market Revenue Million Forecast, by Country 2019 & 2032
- Table 124: Global Desalting And Buffer Exchange Market Volume K Unit Forecast, by Country 2019 & 2032
- Table 125: GCC Desalting And Buffer Exchange Market Revenue (Million) Forecast, by Application 2019 & 2032
- Table 126: GCC Desalting And Buffer Exchange Market Volume (K Unit) Forecast, by Application 2019 & 2032
- Table 127: South Africa Desalting And Buffer Exchange Market Revenue (Million) Forecast, by Application 2019 & 2032
- Table 128: South Africa Desalting And Buffer Exchange Market Volume (K Unit) Forecast, by Application 2019 & 2032
- Table 129: Rest of Middle East and Africa Desalting And Buffer Exchange Market Revenue (Million) Forecast, by Application 2019 & 2032
- Table 130: Rest of Middle East and Africa Desalting And Buffer Exchange Market Volume (K Unit) Forecast, by Application 2019 & 2032
- Table 131: Global Desalting And Buffer Exchange Market Revenue Million Forecast, by Product 2019 & 2032
- Table 132: Global Desalting And Buffer Exchange Market Volume K Unit Forecast, by Product 2019 & 2032
- Table 133: Global Desalting And Buffer Exchange Market Revenue Million Forecast, by Technique 2019 & 2032
- Table 134: Global Desalting And Buffer Exchange Market Volume K Unit Forecast, by Technique 2019 & 2032
- Table 135: Global Desalting And Buffer Exchange Market Revenue Million Forecast, by Application 2019 & 2032
- Table 136: Global Desalting And Buffer Exchange Market Volume K Unit Forecast, by Application 2019 & 2032
- Table 137: Global Desalting And Buffer Exchange Market Revenue Million Forecast, by Country 2019 & 2032
- Table 138: Global Desalting And Buffer Exchange Market Volume K Unit Forecast, by Country 2019 & 2032
- Table 139: Brazil Desalting And Buffer Exchange Market Revenue (Million) Forecast, by Application 2019 & 2032
- Table 140: Brazil Desalting And Buffer Exchange Market Volume (K Unit) Forecast, by Application 2019 & 2032
- Table 141: Argentina Desalting And Buffer Exchange Market Revenue (Million) Forecast, by Application 2019 & 2032
- Table 142: Argentina Desalting And Buffer Exchange Market Volume (K Unit) Forecast, by Application 2019 & 2032
- Table 143: Rest of South America Desalting And Buffer Exchange Market Revenue (Million) Forecast, by Application 2019 & 2032
- Table 144: Rest of South America Desalting And Buffer Exchange Market Volume (K Unit) Forecast, by Application 2019 & 2032
Frequently Asked Questions
1. What is the projected Compound Annual Growth Rate (CAGR) of the Desalting And Buffer Exchange Market?
The projected CAGR is approximately 10.10%.
2. Which companies are prominent players in the Desalting And Buffer Exchange Market?
Key companies in the market include Repligen Corporation, Agilient Technologies Inc, Bio-Rad Laboratories Inc, Merck KGaA, Thermo Fisher Scientific Inc, Danaher Corporation (Cytvia), Bio-Works Technologies, Sartorius AG, GE HealthCare Technologies Inc, Norgen Bioteck Corp.
3. What are the main segments of the Desalting And Buffer Exchange Market?
The market segments include Product, Technique, Application.
4. Can you provide details about the market size?
The market size is estimated to be USD XX Million as of 2022.
5. What are some drivers contributing to market growth?
Increasing Research and Development by Biopharmaceutical Industries; Rising Focus on the Proteomic and Genomic Research.
6. What are the notable trends driving market growth?
The Pharmaceutical and Biotechnology Industries Segment is Expected to Witness Significant Growth Over the Forecast Period.
7. Are there any restraints impacting market growth?
Lack of Skilled Professionals.
8. Can you provide examples of recent developments in the market?
January 2023: Sartorius extended a strategic collaboration partnership agreement with RoosterBio Inc. to address purification challenges and establish scalable downstream manufacturing processes for exosome-based therapies. The collaboration would strengthen the bioprocessing portfolio of the company.
9. What pricing options are available for accessing the report?
Pricing options include single-user, multi-user, and enterprise licenses priced at USD 4750, USD 5250, and USD 8750 respectively.
10. Is the market size provided in terms of value or volume?
The market size is provided in terms of value, measured in Million and volume, measured in K Unit.
11. Are there any specific market keywords associated with the report?
Yes, the market keyword associated with the report is "Desalting And Buffer Exchange Market," which aids in identifying and referencing the specific market segment covered.
12. How do I determine which pricing option suits my needs best?
The pricing options vary based on user requirements and access needs. Individual users may opt for single-user licenses, while businesses requiring broader access may choose multi-user or enterprise licenses for cost-effective access to the report.
13. Are there any additional resources or data provided in the Desalting And Buffer Exchange Market report?
While the report offers comprehensive insights, it's advisable to review the specific contents or supplementary materials provided to ascertain if additional resources or data are available.
14. How can I stay updated on further developments or reports in the Desalting And Buffer Exchange Market?
To stay informed about further developments, trends, and reports in the Desalting And Buffer Exchange Market, consider subscribing to industry newsletters, following relevant companies and organizations, or regularly checking reputable industry news sources and publications.
Methodology
Step 1 - Identification of Relevant Samples Size from Population Database


Step 2 - Approaches for Defining Global Market Size (Value, Volume* & Price*)

Note*: In applicable scenarios
Step 3 - Data Sources
Primary Research
- Web Analytics
- Survey Reports
- Research Institute
- Latest Research Reports
- Opinion Leaders
Secondary Research
- Annual Reports
- White Paper
- Latest Press Release
- Industry Association
- Paid Database
- Investor Presentations

Step 4 - Data Triangulation
Involves using different sources of information in order to increase the validity of a study
These sources are likely to be stakeholders in a program - participants, other researchers, program staff, other community members, and so on.
Then we put all data in single framework & apply various statistical tools to find out the dynamic on the market.
During the analysis stage, feedback from the stakeholder groups would be compared to determine areas of agreement as well as areas of divergence


