
Key Insights
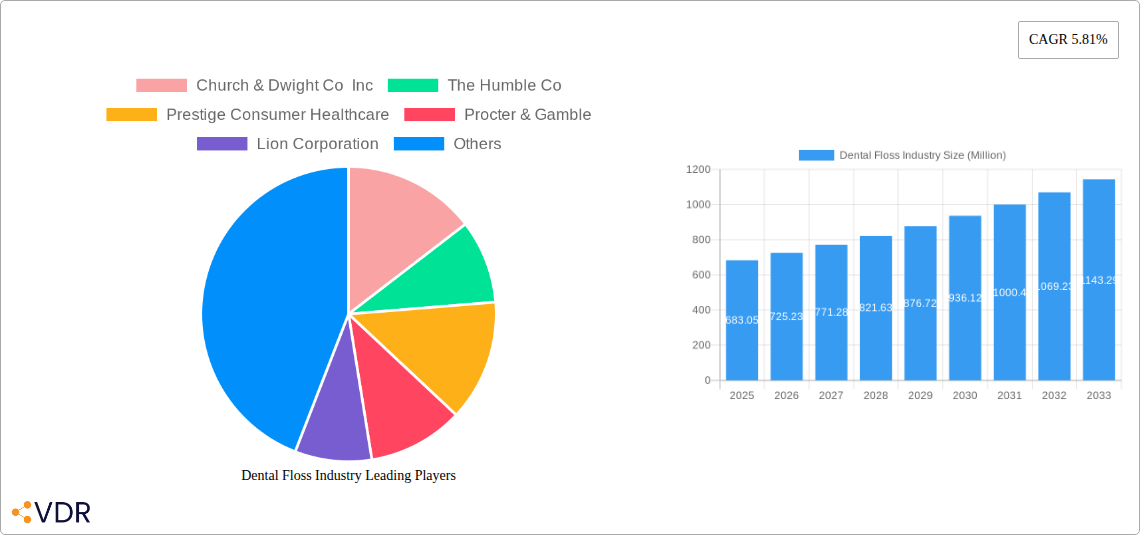
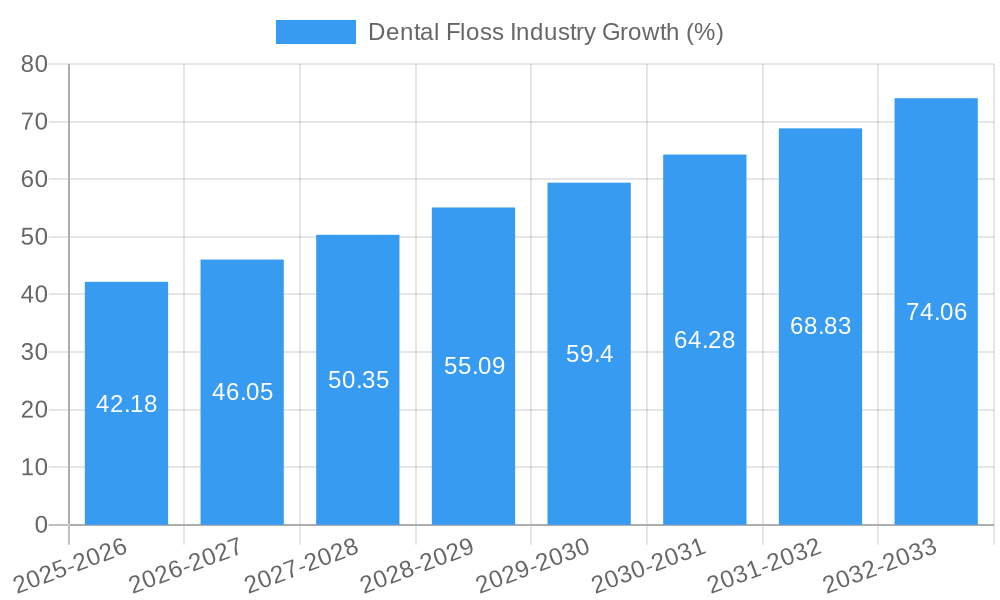
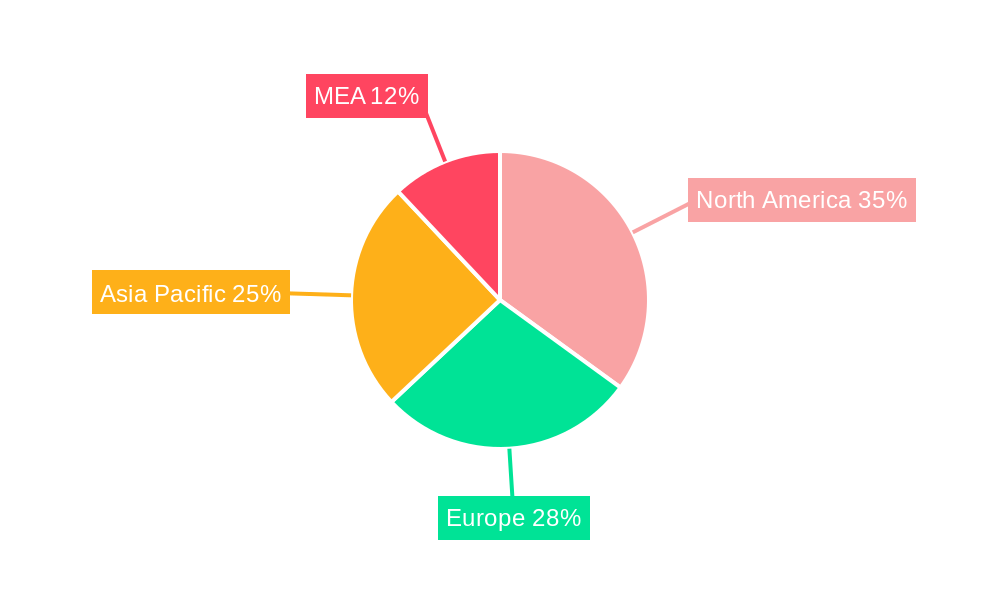
The global dental floss market, valued at $683.05 million in 2025, is projected to experience robust growth, driven by rising dental awareness and the increasing prevalence of periodontal diseases. A compound annual growth rate (CAGR) of 5.81% from 2025 to 2033 indicates a significant expansion of this market. Key drivers include the growing adoption of preventive dental care, increasing disposable incomes in developing economies leading to higher healthcare expenditure, and the expanding availability of dental floss through diverse sales channels, such as retail pharmacies, hospital pharmacies, and online platforms. Furthermore, innovative product offerings like waxed and unwaxed floss, along with flavored options catering to consumer preferences, are fueling market expansion. The market segmentation by product type (waxed, unwaxed, and other) highlights consumer choice and preference influencing market share dynamics. While the exact market share of each segment isn't provided, it's reasonable to assume that waxed floss currently holds a significant market share due to its superior cleaning properties and ease of use, followed by unwaxed floss and "other" floss types, which could include interdental brushes or specialized floss products. The geographical distribution of the market showcases significant growth potential in regions like Asia-Pacific and MEA, driven by rising populations and increasing dental healthcare awareness. However, factors such as fluctuating raw material costs and the emergence of alternative oral hygiene products could present challenges to market growth. Major players in this market, including Church & Dwight, The Humble Co, and Procter & Gamble, are actively involved in product innovation and strategic expansion to maintain their market position.
The forecast period (2025-2033) reveals a considerable growth trajectory, influenced by increasing public health initiatives focusing on oral hygiene and the broader adoption of flossing as an integral part of daily dental care. The competition is fierce among established players and emerging brands. Success in this market demands continuous innovation to deliver superior products, efficient distribution strategies to cater to diverse sales channels, and effective marketing campaigns that highlight the critical role of dental floss in maintaining oral health. While challenges exist, the long-term outlook for the dental floss market remains positive, underpinned by ongoing growth in dental awareness and an increasing focus on preventive oral healthcare.
This comprehensive report provides a detailed analysis of the global dental floss market, encompassing market dynamics, growth trends, regional analysis, product landscape, key players, and future outlook. The study period covers 2019-2033, with 2025 as the base year and a forecast period of 2025-2033. This report is essential for industry professionals, investors, and anyone seeking a deep understanding of this dynamic market. The report analyzes parent markets (Oral Hygiene Products) and child markets (Dental Floss) to provide a holistic view.
Dental Floss Industry Market Dynamics & Structure
The global dental floss market, valued at $XX million in 2024, is characterized by a moderately concentrated structure with key players holding significant market share. The market is driven by increasing awareness of oral hygiene, rising disposable incomes in developing economies, and technological innovations focused on sustainability and enhanced user experience. Regulatory frameworks, particularly concerning material composition and safety, also play a crucial role. Competition from substitute products, such as interdental brushes and water flossers, poses a significant challenge. The market exhibits considerable end-user diversity, spanning across various age groups and socio-economic backgrounds. M&A activity within the sector has been moderate, primarily driven by strategic expansion and consolidation efforts.
- Market Concentration: Moderately concentrated, with top 5 players holding approximately XX% market share in 2024.
- Technological Innovation: Focus on biodegradable materials, ergonomic designs, and improved efficacy.
- Regulatory Framework: Stringent regulations concerning material safety and labeling.
- Competitive Substitutes: Interdental brushes, water flossers, and other oral hygiene products.
- End-User Demographics: Diverse, ranging from children to elderly adults across various income levels.
- M&A Trends: Moderate activity, primarily strategic acquisitions and mergers for market expansion.
Dental Floss Industry Growth Trends & Insights
The dental floss market experienced steady growth during the historical period (2019-2024), with a CAGR of XX%. This growth is attributed to increasing consumer awareness regarding oral health and the preventative benefits of regular flossing. Technological advancements, such as the introduction of biodegradable and compostable floss options, have also fueled market expansion. Consumer behavior shifts towards premium and specialized floss products, including flavored and waxed varieties, have further contributed to growth. The market is projected to continue its growth trajectory during the forecast period (2025-2033), driven by factors such as rising disposable incomes in emerging markets and ongoing product innovation. Market penetration remains relatively high in developed nations, yet considerable potential exists in developing countries with increasing adoption rates.
Dominant Regions, Countries, or Segments in Dental Floss Industry
North America currently dominates the dental floss market, driven by high consumer awareness, established distribution channels, and strong per capita consumption rates. Within product segments, waxed floss maintains a significant market share due to its ease of use and superior cleaning efficacy. Retail pharmacies constitute the dominant sales channel, owing to widespread accessibility and established partnerships with key players. However, online sales channels are experiencing rapid growth, driven by e-commerce expansion and increasing consumer preference for convenience.
- Leading Region: North America
- Leading Product Segment: Waxed Floss
- Leading Sales Channel: Retail Pharmacies
- Key Growth Drivers: High consumer awareness (North America), increasing disposable incomes (emerging markets), e-commerce expansion (globally).
Dental Floss Industry Product Landscape
The dental floss market offers a diverse range of products, including waxed and unwaxed floss, floss picks, and specialized floss for sensitive gums or orthodontic use. Recent innovations focus on sustainable materials like biodegradable polymers and improved designs for enhanced user comfort and cleaning efficacy. Unique selling propositions often revolve around superior cleaning performance, eco-friendliness, or specialized features catering to specific dental needs. Technological advancements continue to drive innovation in materials, designs, and manufacturing processes.
Key Drivers, Barriers & Challenges in Dental Floss Industry
Key Drivers: Increasing awareness of oral hygiene, rising disposable incomes, technological advancements in materials and design, expanding e-commerce channels.
Challenges: Competition from substitute products like interdental brushes and water flossers, fluctuating raw material prices, stringent regulatory requirements, and supply chain disruptions impacting production costs and availability. The impact of these challenges is estimated to reduce annual growth by approximately XX% in certain regions.
Emerging Opportunities in Dental Floss Industry
Emerging opportunities include untapped markets in developing economies, the growing popularity of sustainable and eco-friendly floss options, and the development of innovative floss products tailored to specific dental needs (e.g., orthodontic floss, floss for implants). Further expansion into online sales channels and strategic partnerships with dental professionals present significant growth potential.
Growth Accelerators in the Dental Floss Industry
Technological breakthroughs in biodegradable materials, strategic partnerships with dental clinics and influencers, and expansion into untapped geographical markets will act as primary growth catalysts. Moreover, targeted marketing campaigns highlighting the long-term health benefits of regular flossing and product diversification to cater to niche market segments will accelerate market growth.
Key Players Shaping the Dental Floss Industry Market
- Church & Dwight Co Inc
- The Humble Co
- Prestige Consumer Healthcare
- Procter & Gamble
- Lion Corporation
- 3M
- HRB Brand (Dr Fresh LLC)
- Perrigo Company Plc (RANIR LLC)
- Colgate-Palmolive Company
- Johnson & Johnson
- Dr Wild & Co AG
- Sunstar Suisse SA
Notable Milestones in Dental Floss Industry Sector
- March 2022: Plackers launched EcoChoice Compostable Dental Flossers.
- October 2021: SmileDirectClub introduced new water flossers.
In-Depth Dental Floss Industry Market Outlook
The dental floss market is poised for sustained growth, driven by continuous innovation in product design and materials, expanding distribution channels, and increasing consumer awareness of oral hygiene. Strategic acquisitions, partnerships, and expansion into new markets will further fuel market expansion. The long-term growth potential is significant, with opportunities for established players and new entrants alike.
Dental Floss Industry Segmentation
-
1. Product
- 1.1. Waxed Floss
- 1.2. Unwaxed Floss
- 1.3. Other Products
-
2. Sales Channel
- 2.1. Retail Pharmacies
- 2.2. Hospital Pharmacies
- 2.3. Online
Dental Floss Industry Segmentation By Geography
-
1. North America
- 1.1. United States
- 1.2. Canada
- 1.3. Mexico
-
2. Europe
- 2.1. Germany
- 2.2. United Kingdom
- 2.3. France
- 2.4. Italy
- 2.5. Spain
- 2.6. Rest of Europe
-
3. Asia Pacific
- 3.1. China
- 3.2. Japan
- 3.3. India
- 3.4. Australia
- 3.5. South Korea
- 3.6. Rest of Asia Pacific
- 4. Middle East
-
5. GCC
- 5.1. South Africa
- 5.2. Rest of Middle East
-
6. South America
- 6.1. Brazil
- 6.2. Argentina
- 6.3. Rest of South America
Dental Floss Industry REPORT HIGHLIGHTS
| Aspects | Details |
|---|---|
| Study Period | 2019-2033 |
| Base Year | 2024 |
| Estimated Year | 2025 |
| Forecast Period | 2025-2033 |
| Historical Period | 2019-2024 |
| Growth Rate | CAGR of 5.81% from 2019-2033 |
| Segmentation |
|
Table of Contents
- 1. Introduction
- 1.1. Research Scope
- 1.2. Market Segmentation
- 1.3. Research Methodology
- 1.4. Definitions and Assumptions
- 2. Executive Summary
- 2.1. Introduction
- 3. Market Dynamics
- 3.1. Introduction
- 3.2. Market Drivers
- 3.2.1. Rising Awareness of Oral Hygiene; Increasing Demand for Oral Care Products and the Increasing Oral Problems
- 3.3. Market Restrains
- 3.3.1. Availability of Alternatives such as Floss Picks
- 3.4. Market Trends
- 3.4.1. Waxed Dental Floss Segment Is Expected to Witness Growth Over the Forecast Period
- 4. Market Factor Analysis
- 4.1. Porters Five Forces
- 4.2. Supply/Value Chain
- 4.3. PESTEL analysis
- 4.4. Market Entropy
- 4.5. Patent/Trademark Analysis
- 5. Global Dental Floss Industry Analysis, Insights and Forecast, 2019-2031
- 5.1. Market Analysis, Insights and Forecast - by Product
- 5.1.1. Waxed Floss
- 5.1.2. Unwaxed Floss
- 5.1.3. Other Products
- 5.2. Market Analysis, Insights and Forecast - by Sales Channel
- 5.2.1. Retail Pharmacies
- 5.2.2. Hospital Pharmacies
- 5.2.3. Online
- 5.3. Market Analysis, Insights and Forecast - by Region
- 5.3.1. North America
- 5.3.2. Europe
- 5.3.3. Asia Pacific
- 5.3.4. Middle East
- 5.3.5. GCC
- 5.3.6. South America
- 5.1. Market Analysis, Insights and Forecast - by Product
- 6. North America Dental Floss Industry Analysis, Insights and Forecast, 2019-2031
- 6.1. Market Analysis, Insights and Forecast - by Product
- 6.1.1. Waxed Floss
- 6.1.2. Unwaxed Floss
- 6.1.3. Other Products
- 6.2. Market Analysis, Insights and Forecast - by Sales Channel
- 6.2.1. Retail Pharmacies
- 6.2.2. Hospital Pharmacies
- 6.2.3. Online
- 6.1. Market Analysis, Insights and Forecast - by Product
- 7. Europe Dental Floss Industry Analysis, Insights and Forecast, 2019-2031
- 7.1. Market Analysis, Insights and Forecast - by Product
- 7.1.1. Waxed Floss
- 7.1.2. Unwaxed Floss
- 7.1.3. Other Products
- 7.2. Market Analysis, Insights and Forecast - by Sales Channel
- 7.2.1. Retail Pharmacies
- 7.2.2. Hospital Pharmacies
- 7.2.3. Online
- 7.1. Market Analysis, Insights and Forecast - by Product
- 8. Asia Pacific Dental Floss Industry Analysis, Insights and Forecast, 2019-2031
- 8.1. Market Analysis, Insights and Forecast - by Product
- 8.1.1. Waxed Floss
- 8.1.2. Unwaxed Floss
- 8.1.3. Other Products
- 8.2. Market Analysis, Insights and Forecast - by Sales Channel
- 8.2.1. Retail Pharmacies
- 8.2.2. Hospital Pharmacies
- 8.2.3. Online
- 8.1. Market Analysis, Insights and Forecast - by Product
- 9. Middle East Dental Floss Industry Analysis, Insights and Forecast, 2019-2031
- 9.1. Market Analysis, Insights and Forecast - by Product
- 9.1.1. Waxed Floss
- 9.1.2. Unwaxed Floss
- 9.1.3. Other Products
- 9.2. Market Analysis, Insights and Forecast - by Sales Channel
- 9.2.1. Retail Pharmacies
- 9.2.2. Hospital Pharmacies
- 9.2.3. Online
- 9.1. Market Analysis, Insights and Forecast - by Product
- 10. GCC Dental Floss Industry Analysis, Insights and Forecast, 2019-2031
- 10.1. Market Analysis, Insights and Forecast - by Product
- 10.1.1. Waxed Floss
- 10.1.2. Unwaxed Floss
- 10.1.3. Other Products
- 10.2. Market Analysis, Insights and Forecast - by Sales Channel
- 10.2.1. Retail Pharmacies
- 10.2.2. Hospital Pharmacies
- 10.2.3. Online
- 10.1. Market Analysis, Insights and Forecast - by Product
- 11. South America Dental Floss Industry Analysis, Insights and Forecast, 2019-2031
- 11.1. Market Analysis, Insights and Forecast - by Product
- 11.1.1. Waxed Floss
- 11.1.2. Unwaxed Floss
- 11.1.3. Other Products
- 11.2. Market Analysis, Insights and Forecast - by Sales Channel
- 11.2.1. Retail Pharmacies
- 11.2.2. Hospital Pharmacies
- 11.2.3. Online
- 11.1. Market Analysis, Insights and Forecast - by Product
- 12. North Americ Dental Floss Industry Analysis, Insights and Forecast, 2019-2031
- 12.1. Market Analysis, Insights and Forecast - By Country/Sub-region
- 12.1.1 United States
- 12.1.2 Canada
- 12.1.3 Mexico
- 13. South America Dental Floss Industry Analysis, Insights and Forecast, 2019-2031
- 13.1. Market Analysis, Insights and Forecast - By Country/Sub-region
- 13.1.1 Brazil
- 13.1.2 Mexico
- 13.1.3 Rest of South America
- 14. Europe Dental Floss Industry Analysis, Insights and Forecast, 2019-2031
- 14.1. Market Analysis, Insights and Forecast - By Country/Sub-region
- 14.1.1 Germany
- 14.1.2 United Kingdom
- 14.1.3 France
- 14.1.4 Italy
- 14.1.5 Spain
- 14.1.6 Rest of Europe
- 15. Asia Pacific Dental Floss Industry Analysis, Insights and Forecast, 2019-2031
- 15.1. Market Analysis, Insights and Forecast - By Country/Sub-region
- 15.1.1 China
- 15.1.2 Japan
- 15.1.3 India
- 15.1.4 South Korea
- 15.1.5 Taiwan
- 15.1.6 Australia
- 15.1.7 Rest of Asia-Pacific
- 16. MEA Dental Floss Industry Analysis, Insights and Forecast, 2019-2031
- 16.1. Market Analysis, Insights and Forecast - By Country/Sub-region
- 16.1.1 Middle East
- 16.1.2 Africa
- 17. Competitive Analysis
- 17.1. Global Market Share Analysis 2024
- 17.2. Company Profiles
- 17.2.1 Church & Dwight Co Inc
- 17.2.1.1. Overview
- 17.2.1.2. Products
- 17.2.1.3. SWOT Analysis
- 17.2.1.4. Recent Developments
- 17.2.1.5. Financials (Based on Availability)
- 17.2.2 The Humble Co
- 17.2.2.1. Overview
- 17.2.2.2. Products
- 17.2.2.3. SWOT Analysis
- 17.2.2.4. Recent Developments
- 17.2.2.5. Financials (Based on Availability)
- 17.2.3 Prestige Consumer Healthcare
- 17.2.3.1. Overview
- 17.2.3.2. Products
- 17.2.3.3. SWOT Analysis
- 17.2.3.4. Recent Developments
- 17.2.3.5. Financials (Based on Availability)
- 17.2.4 Procter & Gamble
- 17.2.4.1. Overview
- 17.2.4.2. Products
- 17.2.4.3. SWOT Analysis
- 17.2.4.4. Recent Developments
- 17.2.4.5. Financials (Based on Availability)
- 17.2.5 Lion Corporation
- 17.2.5.1. Overview
- 17.2.5.2. Products
- 17.2.5.3. SWOT Analysis
- 17.2.5.4. Recent Developments
- 17.2.5.5. Financials (Based on Availability)
- 17.2.6 3M
- 17.2.6.1. Overview
- 17.2.6.2. Products
- 17.2.6.3. SWOT Analysis
- 17.2.6.4. Recent Developments
- 17.2.6.5. Financials (Based on Availability)
- 17.2.7 HRB Brand (Dr Fresh LLC)
- 17.2.7.1. Overview
- 17.2.7.2. Products
- 17.2.7.3. SWOT Analysis
- 17.2.7.4. Recent Developments
- 17.2.7.5. Financials (Based on Availability)
- 17.2.8 Perrigo Company Plc (RANIR LLC)
- 17.2.8.1. Overview
- 17.2.8.2. Products
- 17.2.8.3. SWOT Analysis
- 17.2.8.4. Recent Developments
- 17.2.8.5. Financials (Based on Availability)
- 17.2.9 Colgate-Palmolive Company
- 17.2.9.1. Overview
- 17.2.9.2. Products
- 17.2.9.3. SWOT Analysis
- 17.2.9.4. Recent Developments
- 17.2.9.5. Financials (Based on Availability)
- 17.2.10 Johnson & Johnson
- 17.2.10.1. Overview
- 17.2.10.2. Products
- 17.2.10.3. SWOT Analysis
- 17.2.10.4. Recent Developments
- 17.2.10.5. Financials (Based on Availability)
- 17.2.11 Dr Wild & Co AG
- 17.2.11.1. Overview
- 17.2.11.2. Products
- 17.2.11.3. SWOT Analysis
- 17.2.11.4. Recent Developments
- 17.2.11.5. Financials (Based on Availability)
- 17.2.12 Sunstar Suisse SA
- 17.2.12.1. Overview
- 17.2.12.2. Products
- 17.2.12.3. SWOT Analysis
- 17.2.12.4. Recent Developments
- 17.2.12.5. Financials (Based on Availability)
- 17.2.1 Church & Dwight Co Inc
List of Figures
- Figure 1: Global Dental Floss Industry Revenue Breakdown (Million, %) by Region 2024 & 2032
- Figure 2: Global Dental Floss Industry Volume Breakdown (K Units, %) by Region 2024 & 2032
- Figure 3: North Americ Dental Floss Industry Revenue (Million), by Country 2024 & 2032
- Figure 4: North Americ Dental Floss Industry Volume (K Units), by Country 2024 & 2032
- Figure 5: North Americ Dental Floss Industry Revenue Share (%), by Country 2024 & 2032
- Figure 6: North Americ Dental Floss Industry Volume Share (%), by Country 2024 & 2032
- Figure 7: South America Dental Floss Industry Revenue (Million), by Country 2024 & 2032
- Figure 8: South America Dental Floss Industry Volume (K Units), by Country 2024 & 2032
- Figure 9: South America Dental Floss Industry Revenue Share (%), by Country 2024 & 2032
- Figure 10: South America Dental Floss Industry Volume Share (%), by Country 2024 & 2032
- Figure 11: Europe Dental Floss Industry Revenue (Million), by Country 2024 & 2032
- Figure 12: Europe Dental Floss Industry Volume (K Units), by Country 2024 & 2032
- Figure 13: Europe Dental Floss Industry Revenue Share (%), by Country 2024 & 2032
- Figure 14: Europe Dental Floss Industry Volume Share (%), by Country 2024 & 2032
- Figure 15: Asia Pacific Dental Floss Industry Revenue (Million), by Country 2024 & 2032
- Figure 16: Asia Pacific Dental Floss Industry Volume (K Units), by Country 2024 & 2032
- Figure 17: Asia Pacific Dental Floss Industry Revenue Share (%), by Country 2024 & 2032
- Figure 18: Asia Pacific Dental Floss Industry Volume Share (%), by Country 2024 & 2032
- Figure 19: MEA Dental Floss Industry Revenue (Million), by Country 2024 & 2032
- Figure 20: MEA Dental Floss Industry Volume (K Units), by Country 2024 & 2032
- Figure 21: MEA Dental Floss Industry Revenue Share (%), by Country 2024 & 2032
- Figure 22: MEA Dental Floss Industry Volume Share (%), by Country 2024 & 2032
- Figure 23: North America Dental Floss Industry Revenue (Million), by Product 2024 & 2032
- Figure 24: North America Dental Floss Industry Volume (K Units), by Product 2024 & 2032
- Figure 25: North America Dental Floss Industry Revenue Share (%), by Product 2024 & 2032
- Figure 26: North America Dental Floss Industry Volume Share (%), by Product 2024 & 2032
- Figure 27: North America Dental Floss Industry Revenue (Million), by Sales Channel 2024 & 2032
- Figure 28: North America Dental Floss Industry Volume (K Units), by Sales Channel 2024 & 2032
- Figure 29: North America Dental Floss Industry Revenue Share (%), by Sales Channel 2024 & 2032
- Figure 30: North America Dental Floss Industry Volume Share (%), by Sales Channel 2024 & 2032
- Figure 31: North America Dental Floss Industry Revenue (Million), by Country 2024 & 2032
- Figure 32: North America Dental Floss Industry Volume (K Units), by Country 2024 & 2032
- Figure 33: North America Dental Floss Industry Revenue Share (%), by Country 2024 & 2032
- Figure 34: North America Dental Floss Industry Volume Share (%), by Country 2024 & 2032
- Figure 35: Europe Dental Floss Industry Revenue (Million), by Product 2024 & 2032
- Figure 36: Europe Dental Floss Industry Volume (K Units), by Product 2024 & 2032
- Figure 37: Europe Dental Floss Industry Revenue Share (%), by Product 2024 & 2032
- Figure 38: Europe Dental Floss Industry Volume Share (%), by Product 2024 & 2032
- Figure 39: Europe Dental Floss Industry Revenue (Million), by Sales Channel 2024 & 2032
- Figure 40: Europe Dental Floss Industry Volume (K Units), by Sales Channel 2024 & 2032
- Figure 41: Europe Dental Floss Industry Revenue Share (%), by Sales Channel 2024 & 2032
- Figure 42: Europe Dental Floss Industry Volume Share (%), by Sales Channel 2024 & 2032
- Figure 43: Europe Dental Floss Industry Revenue (Million), by Country 2024 & 2032
- Figure 44: Europe Dental Floss Industry Volume (K Units), by Country 2024 & 2032
- Figure 45: Europe Dental Floss Industry Revenue Share (%), by Country 2024 & 2032
- Figure 46: Europe Dental Floss Industry Volume Share (%), by Country 2024 & 2032
- Figure 47: Asia Pacific Dental Floss Industry Revenue (Million), by Product 2024 & 2032
- Figure 48: Asia Pacific Dental Floss Industry Volume (K Units), by Product 2024 & 2032
- Figure 49: Asia Pacific Dental Floss Industry Revenue Share (%), by Product 2024 & 2032
- Figure 50: Asia Pacific Dental Floss Industry Volume Share (%), by Product 2024 & 2032
- Figure 51: Asia Pacific Dental Floss Industry Revenue (Million), by Sales Channel 2024 & 2032
- Figure 52: Asia Pacific Dental Floss Industry Volume (K Units), by Sales Channel 2024 & 2032
- Figure 53: Asia Pacific Dental Floss Industry Revenue Share (%), by Sales Channel 2024 & 2032
- Figure 54: Asia Pacific Dental Floss Industry Volume Share (%), by Sales Channel 2024 & 2032
- Figure 55: Asia Pacific Dental Floss Industry Revenue (Million), by Country 2024 & 2032
- Figure 56: Asia Pacific Dental Floss Industry Volume (K Units), by Country 2024 & 2032
- Figure 57: Asia Pacific Dental Floss Industry Revenue Share (%), by Country 2024 & 2032
- Figure 58: Asia Pacific Dental Floss Industry Volume Share (%), by Country 2024 & 2032
- Figure 59: Middle East Dental Floss Industry Revenue (Million), by Product 2024 & 2032
- Figure 60: Middle East Dental Floss Industry Volume (K Units), by Product 2024 & 2032
- Figure 61: Middle East Dental Floss Industry Revenue Share (%), by Product 2024 & 2032
- Figure 62: Middle East Dental Floss Industry Volume Share (%), by Product 2024 & 2032
- Figure 63: Middle East Dental Floss Industry Revenue (Million), by Sales Channel 2024 & 2032
- Figure 64: Middle East Dental Floss Industry Volume (K Units), by Sales Channel 2024 & 2032
- Figure 65: Middle East Dental Floss Industry Revenue Share (%), by Sales Channel 2024 & 2032
- Figure 66: Middle East Dental Floss Industry Volume Share (%), by Sales Channel 2024 & 2032
- Figure 67: Middle East Dental Floss Industry Revenue (Million), by Country 2024 & 2032
- Figure 68: Middle East Dental Floss Industry Volume (K Units), by Country 2024 & 2032
- Figure 69: Middle East Dental Floss Industry Revenue Share (%), by Country 2024 & 2032
- Figure 70: Middle East Dental Floss Industry Volume Share (%), by Country 2024 & 2032
- Figure 71: GCC Dental Floss Industry Revenue (Million), by Product 2024 & 2032
- Figure 72: GCC Dental Floss Industry Volume (K Units), by Product 2024 & 2032
- Figure 73: GCC Dental Floss Industry Revenue Share (%), by Product 2024 & 2032
- Figure 74: GCC Dental Floss Industry Volume Share (%), by Product 2024 & 2032
- Figure 75: GCC Dental Floss Industry Revenue (Million), by Sales Channel 2024 & 2032
- Figure 76: GCC Dental Floss Industry Volume (K Units), by Sales Channel 2024 & 2032
- Figure 77: GCC Dental Floss Industry Revenue Share (%), by Sales Channel 2024 & 2032
- Figure 78: GCC Dental Floss Industry Volume Share (%), by Sales Channel 2024 & 2032
- Figure 79: GCC Dental Floss Industry Revenue (Million), by Country 2024 & 2032
- Figure 80: GCC Dental Floss Industry Volume (K Units), by Country 2024 & 2032
- Figure 81: GCC Dental Floss Industry Revenue Share (%), by Country 2024 & 2032
- Figure 82: GCC Dental Floss Industry Volume Share (%), by Country 2024 & 2032
- Figure 83: South America Dental Floss Industry Revenue (Million), by Product 2024 & 2032
- Figure 84: South America Dental Floss Industry Volume (K Units), by Product 2024 & 2032
- Figure 85: South America Dental Floss Industry Revenue Share (%), by Product 2024 & 2032
- Figure 86: South America Dental Floss Industry Volume Share (%), by Product 2024 & 2032
- Figure 87: South America Dental Floss Industry Revenue (Million), by Sales Channel 2024 & 2032
- Figure 88: South America Dental Floss Industry Volume (K Units), by Sales Channel 2024 & 2032
- Figure 89: South America Dental Floss Industry Revenue Share (%), by Sales Channel 2024 & 2032
- Figure 90: South America Dental Floss Industry Volume Share (%), by Sales Channel 2024 & 2032
- Figure 91: South America Dental Floss Industry Revenue (Million), by Country 2024 & 2032
- Figure 92: South America Dental Floss Industry Volume (K Units), by Country 2024 & 2032
- Figure 93: South America Dental Floss Industry Revenue Share (%), by Country 2024 & 2032
- Figure 94: South America Dental Floss Industry Volume Share (%), by Country 2024 & 2032
List of Tables
- Table 1: Global Dental Floss Industry Revenue Million Forecast, by Region 2019 & 2032
- Table 2: Global Dental Floss Industry Volume K Units Forecast, by Region 2019 & 2032
- Table 3: Global Dental Floss Industry Revenue Million Forecast, by Product 2019 & 2032
- Table 4: Global Dental Floss Industry Volume K Units Forecast, by Product 2019 & 2032
- Table 5: Global Dental Floss Industry Revenue Million Forecast, by Sales Channel 2019 & 2032
- Table 6: Global Dental Floss Industry Volume K Units Forecast, by Sales Channel 2019 & 2032
- Table 7: Global Dental Floss Industry Revenue Million Forecast, by Region 2019 & 2032
- Table 8: Global Dental Floss Industry Volume K Units Forecast, by Region 2019 & 2032
- Table 9: Global Dental Floss Industry Revenue Million Forecast, by Country 2019 & 2032
- Table 10: Global Dental Floss Industry Volume K Units Forecast, by Country 2019 & 2032
- Table 11: United States Dental Floss Industry Revenue (Million) Forecast, by Application 2019 & 2032
- Table 12: United States Dental Floss Industry Volume (K Units) Forecast, by Application 2019 & 2032
- Table 13: Canada Dental Floss Industry Revenue (Million) Forecast, by Application 2019 & 2032
- Table 14: Canada Dental Floss Industry Volume (K Units) Forecast, by Application 2019 & 2032
- Table 15: Mexico Dental Floss Industry Revenue (Million) Forecast, by Application 2019 & 2032
- Table 16: Mexico Dental Floss Industry Volume (K Units) Forecast, by Application 2019 & 2032
- Table 17: Global Dental Floss Industry Revenue Million Forecast, by Country 2019 & 2032
- Table 18: Global Dental Floss Industry Volume K Units Forecast, by Country 2019 & 2032
- Table 19: Brazil Dental Floss Industry Revenue (Million) Forecast, by Application 2019 & 2032
- Table 20: Brazil Dental Floss Industry Volume (K Units) Forecast, by Application 2019 & 2032
- Table 21: Mexico Dental Floss Industry Revenue (Million) Forecast, by Application 2019 & 2032
- Table 22: Mexico Dental Floss Industry Volume (K Units) Forecast, by Application 2019 & 2032
- Table 23: Rest of South America Dental Floss Industry Revenue (Million) Forecast, by Application 2019 & 2032
- Table 24: Rest of South America Dental Floss Industry Volume (K Units) Forecast, by Application 2019 & 2032
- Table 25: Global Dental Floss Industry Revenue Million Forecast, by Country 2019 & 2032
- Table 26: Global Dental Floss Industry Volume K Units Forecast, by Country 2019 & 2032
- Table 27: Germany Dental Floss Industry Revenue (Million) Forecast, by Application 2019 & 2032
- Table 28: Germany Dental Floss Industry Volume (K Units) Forecast, by Application 2019 & 2032
- Table 29: United Kingdom Dental Floss Industry Revenue (Million) Forecast, by Application 2019 & 2032
- Table 30: United Kingdom Dental Floss Industry Volume (K Units) Forecast, by Application 2019 & 2032
- Table 31: France Dental Floss Industry Revenue (Million) Forecast, by Application 2019 & 2032
- Table 32: France Dental Floss Industry Volume (K Units) Forecast, by Application 2019 & 2032
- Table 33: Italy Dental Floss Industry Revenue (Million) Forecast, by Application 2019 & 2032
- Table 34: Italy Dental Floss Industry Volume (K Units) Forecast, by Application 2019 & 2032
- Table 35: Spain Dental Floss Industry Revenue (Million) Forecast, by Application 2019 & 2032
- Table 36: Spain Dental Floss Industry Volume (K Units) Forecast, by Application 2019 & 2032
- Table 37: Rest of Europe Dental Floss Industry Revenue (Million) Forecast, by Application 2019 & 2032
- Table 38: Rest of Europe Dental Floss Industry Volume (K Units) Forecast, by Application 2019 & 2032
- Table 39: Global Dental Floss Industry Revenue Million Forecast, by Country 2019 & 2032
- Table 40: Global Dental Floss Industry Volume K Units Forecast, by Country 2019 & 2032
- Table 41: China Dental Floss Industry Revenue (Million) Forecast, by Application 2019 & 2032
- Table 42: China Dental Floss Industry Volume (K Units) Forecast, by Application 2019 & 2032
- Table 43: Japan Dental Floss Industry Revenue (Million) Forecast, by Application 2019 & 2032
- Table 44: Japan Dental Floss Industry Volume (K Units) Forecast, by Application 2019 & 2032
- Table 45: India Dental Floss Industry Revenue (Million) Forecast, by Application 2019 & 2032
- Table 46: India Dental Floss Industry Volume (K Units) Forecast, by Application 2019 & 2032
- Table 47: South Korea Dental Floss Industry Revenue (Million) Forecast, by Application 2019 & 2032
- Table 48: South Korea Dental Floss Industry Volume (K Units) Forecast, by Application 2019 & 2032
- Table 49: Taiwan Dental Floss Industry Revenue (Million) Forecast, by Application 2019 & 2032
- Table 50: Taiwan Dental Floss Industry Volume (K Units) Forecast, by Application 2019 & 2032
- Table 51: Australia Dental Floss Industry Revenue (Million) Forecast, by Application 2019 & 2032
- Table 52: Australia Dental Floss Industry Volume (K Units) Forecast, by Application 2019 & 2032
- Table 53: Rest of Asia-Pacific Dental Floss Industry Revenue (Million) Forecast, by Application 2019 & 2032
- Table 54: Rest of Asia-Pacific Dental Floss Industry Volume (K Units) Forecast, by Application 2019 & 2032
- Table 55: Global Dental Floss Industry Revenue Million Forecast, by Country 2019 & 2032
- Table 56: Global Dental Floss Industry Volume K Units Forecast, by Country 2019 & 2032
- Table 57: Middle East Dental Floss Industry Revenue (Million) Forecast, by Application 2019 & 2032
- Table 58: Middle East Dental Floss Industry Volume (K Units) Forecast, by Application 2019 & 2032
- Table 59: Africa Dental Floss Industry Revenue (Million) Forecast, by Application 2019 & 2032
- Table 60: Africa Dental Floss Industry Volume (K Units) Forecast, by Application 2019 & 2032
- Table 61: Global Dental Floss Industry Revenue Million Forecast, by Product 2019 & 2032
- Table 62: Global Dental Floss Industry Volume K Units Forecast, by Product 2019 & 2032
- Table 63: Global Dental Floss Industry Revenue Million Forecast, by Sales Channel 2019 & 2032
- Table 64: Global Dental Floss Industry Volume K Units Forecast, by Sales Channel 2019 & 2032
- Table 65: Global Dental Floss Industry Revenue Million Forecast, by Country 2019 & 2032
- Table 66: Global Dental Floss Industry Volume K Units Forecast, by Country 2019 & 2032
- Table 67: United States Dental Floss Industry Revenue (Million) Forecast, by Application 2019 & 2032
- Table 68: United States Dental Floss Industry Volume (K Units) Forecast, by Application 2019 & 2032
- Table 69: Canada Dental Floss Industry Revenue (Million) Forecast, by Application 2019 & 2032
- Table 70: Canada Dental Floss Industry Volume (K Units) Forecast, by Application 2019 & 2032
- Table 71: Mexico Dental Floss Industry Revenue (Million) Forecast, by Application 2019 & 2032
- Table 72: Mexico Dental Floss Industry Volume (K Units) Forecast, by Application 2019 & 2032
- Table 73: Global Dental Floss Industry Revenue Million Forecast, by Product 2019 & 2032
- Table 74: Global Dental Floss Industry Volume K Units Forecast, by Product 2019 & 2032
- Table 75: Global Dental Floss Industry Revenue Million Forecast, by Sales Channel 2019 & 2032
- Table 76: Global Dental Floss Industry Volume K Units Forecast, by Sales Channel 2019 & 2032
- Table 77: Global Dental Floss Industry Revenue Million Forecast, by Country 2019 & 2032
- Table 78: Global Dental Floss Industry Volume K Units Forecast, by Country 2019 & 2032
- Table 79: Germany Dental Floss Industry Revenue (Million) Forecast, by Application 2019 & 2032
- Table 80: Germany Dental Floss Industry Volume (K Units) Forecast, by Application 2019 & 2032
- Table 81: United Kingdom Dental Floss Industry Revenue (Million) Forecast, by Application 2019 & 2032
- Table 82: United Kingdom Dental Floss Industry Volume (K Units) Forecast, by Application 2019 & 2032
- Table 83: France Dental Floss Industry Revenue (Million) Forecast, by Application 2019 & 2032
- Table 84: France Dental Floss Industry Volume (K Units) Forecast, by Application 2019 & 2032
- Table 85: Italy Dental Floss Industry Revenue (Million) Forecast, by Application 2019 & 2032
- Table 86: Italy Dental Floss Industry Volume (K Units) Forecast, by Application 2019 & 2032
- Table 87: Spain Dental Floss Industry Revenue (Million) Forecast, by Application 2019 & 2032
- Table 88: Spain Dental Floss Industry Volume (K Units) Forecast, by Application 2019 & 2032
- Table 89: Rest of Europe Dental Floss Industry Revenue (Million) Forecast, by Application 2019 & 2032
- Table 90: Rest of Europe Dental Floss Industry Volume (K Units) Forecast, by Application 2019 & 2032
- Table 91: Global Dental Floss Industry Revenue Million Forecast, by Product 2019 & 2032
- Table 92: Global Dental Floss Industry Volume K Units Forecast, by Product 2019 & 2032
- Table 93: Global Dental Floss Industry Revenue Million Forecast, by Sales Channel 2019 & 2032
- Table 94: Global Dental Floss Industry Volume K Units Forecast, by Sales Channel 2019 & 2032
- Table 95: Global Dental Floss Industry Revenue Million Forecast, by Country 2019 & 2032
- Table 96: Global Dental Floss Industry Volume K Units Forecast, by Country 2019 & 2032
- Table 97: China Dental Floss Industry Revenue (Million) Forecast, by Application 2019 & 2032
- Table 98: China Dental Floss Industry Volume (K Units) Forecast, by Application 2019 & 2032
- Table 99: Japan Dental Floss Industry Revenue (Million) Forecast, by Application 2019 & 2032
- Table 100: Japan Dental Floss Industry Volume (K Units) Forecast, by Application 2019 & 2032
- Table 101: India Dental Floss Industry Revenue (Million) Forecast, by Application 2019 & 2032
- Table 102: India Dental Floss Industry Volume (K Units) Forecast, by Application 2019 & 2032
- Table 103: Australia Dental Floss Industry Revenue (Million) Forecast, by Application 2019 & 2032
- Table 104: Australia Dental Floss Industry Volume (K Units) Forecast, by Application 2019 & 2032
- Table 105: South Korea Dental Floss Industry Revenue (Million) Forecast, by Application 2019 & 2032
- Table 106: South Korea Dental Floss Industry Volume (K Units) Forecast, by Application 2019 & 2032
- Table 107: Rest of Asia Pacific Dental Floss Industry Revenue (Million) Forecast, by Application 2019 & 2032
- Table 108: Rest of Asia Pacific Dental Floss Industry Volume (K Units) Forecast, by Application 2019 & 2032
- Table 109: Global Dental Floss Industry Revenue Million Forecast, by Product 2019 & 2032
- Table 110: Global Dental Floss Industry Volume K Units Forecast, by Product 2019 & 2032
- Table 111: Global Dental Floss Industry Revenue Million Forecast, by Sales Channel 2019 & 2032
- Table 112: Global Dental Floss Industry Volume K Units Forecast, by Sales Channel 2019 & 2032
- Table 113: Global Dental Floss Industry Revenue Million Forecast, by Country 2019 & 2032
- Table 114: Global Dental Floss Industry Volume K Units Forecast, by Country 2019 & 2032
- Table 115: Global Dental Floss Industry Revenue Million Forecast, by Product 2019 & 2032
- Table 116: Global Dental Floss Industry Volume K Units Forecast, by Product 2019 & 2032
- Table 117: Global Dental Floss Industry Revenue Million Forecast, by Sales Channel 2019 & 2032
- Table 118: Global Dental Floss Industry Volume K Units Forecast, by Sales Channel 2019 & 2032
- Table 119: Global Dental Floss Industry Revenue Million Forecast, by Country 2019 & 2032
- Table 120: Global Dental Floss Industry Volume K Units Forecast, by Country 2019 & 2032
- Table 121: South Africa Dental Floss Industry Revenue (Million) Forecast, by Application 2019 & 2032
- Table 122: South Africa Dental Floss Industry Volume (K Units) Forecast, by Application 2019 & 2032
- Table 123: Rest of Middle East Dental Floss Industry Revenue (Million) Forecast, by Application 2019 & 2032
- Table 124: Rest of Middle East Dental Floss Industry Volume (K Units) Forecast, by Application 2019 & 2032
- Table 125: Global Dental Floss Industry Revenue Million Forecast, by Product 2019 & 2032
- Table 126: Global Dental Floss Industry Volume K Units Forecast, by Product 2019 & 2032
- Table 127: Global Dental Floss Industry Revenue Million Forecast, by Sales Channel 2019 & 2032
- Table 128: Global Dental Floss Industry Volume K Units Forecast, by Sales Channel 2019 & 2032
- Table 129: Global Dental Floss Industry Revenue Million Forecast, by Country 2019 & 2032
- Table 130: Global Dental Floss Industry Volume K Units Forecast, by Country 2019 & 2032
- Table 131: Brazil Dental Floss Industry Revenue (Million) Forecast, by Application 2019 & 2032
- Table 132: Brazil Dental Floss Industry Volume (K Units) Forecast, by Application 2019 & 2032
- Table 133: Argentina Dental Floss Industry Revenue (Million) Forecast, by Application 2019 & 2032
- Table 134: Argentina Dental Floss Industry Volume (K Units) Forecast, by Application 2019 & 2032
- Table 135: Rest of South America Dental Floss Industry Revenue (Million) Forecast, by Application 2019 & 2032
- Table 136: Rest of South America Dental Floss Industry Volume (K Units) Forecast, by Application 2019 & 2032
Frequently Asked Questions
1. What is the projected Compound Annual Growth Rate (CAGR) of the Dental Floss Industry?
The projected CAGR is approximately 5.81%.
2. Which companies are prominent players in the Dental Floss Industry?
Key companies in the market include Church & Dwight Co Inc, The Humble Co, Prestige Consumer Healthcare, Procter & Gamble, Lion Corporation, 3M, HRB Brand (Dr Fresh LLC), Perrigo Company Plc (RANIR LLC), Colgate-Palmolive Company, Johnson & Johnson, Dr Wild & Co AG, Sunstar Suisse SA.
3. What are the main segments of the Dental Floss Industry?
The market segments include Product, Sales Channel.
4. Can you provide details about the market size?
The market size is estimated to be USD 683.05 Million as of 2022.
5. What are some drivers contributing to market growth?
Rising Awareness of Oral Hygiene; Increasing Demand for Oral Care Products and the Increasing Oral Problems.
6. What are the notable trends driving market growth?
Waxed Dental Floss Segment Is Expected to Witness Growth Over the Forecast Period.
7. Are there any restraints impacting market growth?
Availability of Alternatives such as Floss Picks.
8. Can you provide examples of recent developments in the market?
In March 2022, Plackers launched new EcoChoice Compostable Dental Flossers, sustainable dental flossers designed to be 100% biodegradable to decompose in a home composter.
9. What pricing options are available for accessing the report?
Pricing options include single-user, multi-user, and enterprise licenses priced at USD 4750, USD 5250, and USD 8750 respectively.
10. Is the market size provided in terms of value or volume?
The market size is provided in terms of value, measured in Million and volume, measured in K Units.
11. Are there any specific market keywords associated with the report?
Yes, the market keyword associated with the report is "Dental Floss Industry," which aids in identifying and referencing the specific market segment covered.
12. How do I determine which pricing option suits my needs best?
The pricing options vary based on user requirements and access needs. Individual users may opt for single-user licenses, while businesses requiring broader access may choose multi-user or enterprise licenses for cost-effective access to the report.
13. Are there any additional resources or data provided in the Dental Floss Industry report?
While the report offers comprehensive insights, it's advisable to review the specific contents or supplementary materials provided to ascertain if additional resources or data are available.
14. How can I stay updated on further developments or reports in the Dental Floss Industry?
To stay informed about further developments, trends, and reports in the Dental Floss Industry, consider subscribing to industry newsletters, following relevant companies and organizations, or regularly checking reputable industry news sources and publications.
Methodology
Step 1 - Identification of Relevant Samples Size from Population Database


Step 2 - Approaches for Defining Global Market Size (Value, Volume* & Price*)

Note*: In applicable scenarios
Step 3 - Data Sources
Primary Research
- Web Analytics
- Survey Reports
- Research Institute
- Latest Research Reports
- Opinion Leaders
Secondary Research
- Annual Reports
- White Paper
- Latest Press Release
- Industry Association
- Paid Database
- Investor Presentations

Step 4 - Data Triangulation
Involves using different sources of information in order to increase the validity of a study
These sources are likely to be stakeholders in a program - participants, other researchers, program staff, other community members, and so on.
Then we put all data in single framework & apply various statistical tools to find out the dynamic on the market.
During the analysis stage, feedback from the stakeholder groups would be compared to determine areas of agreement as well as areas of divergence


