
Key Insights
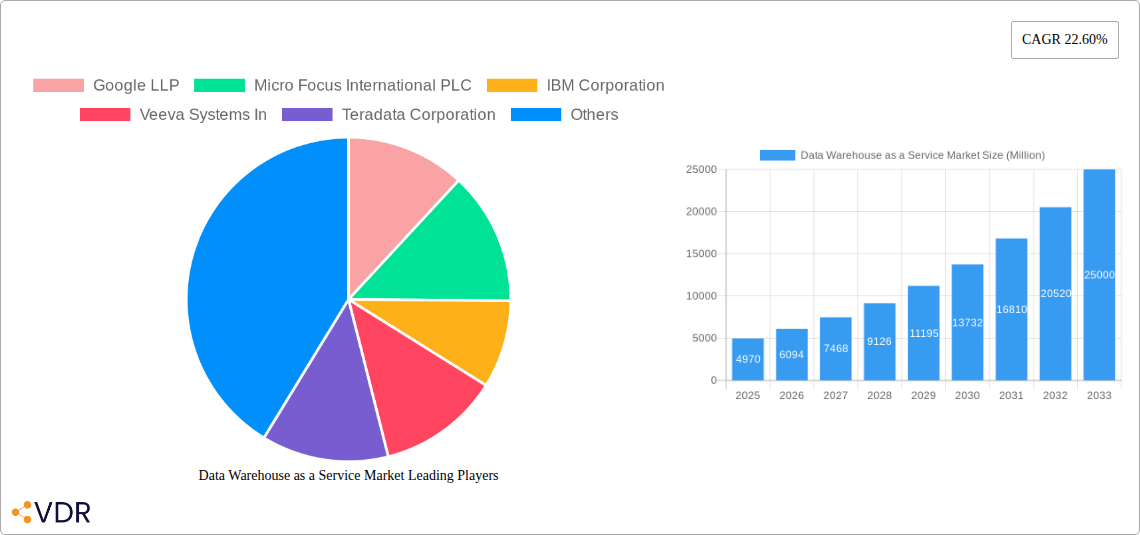
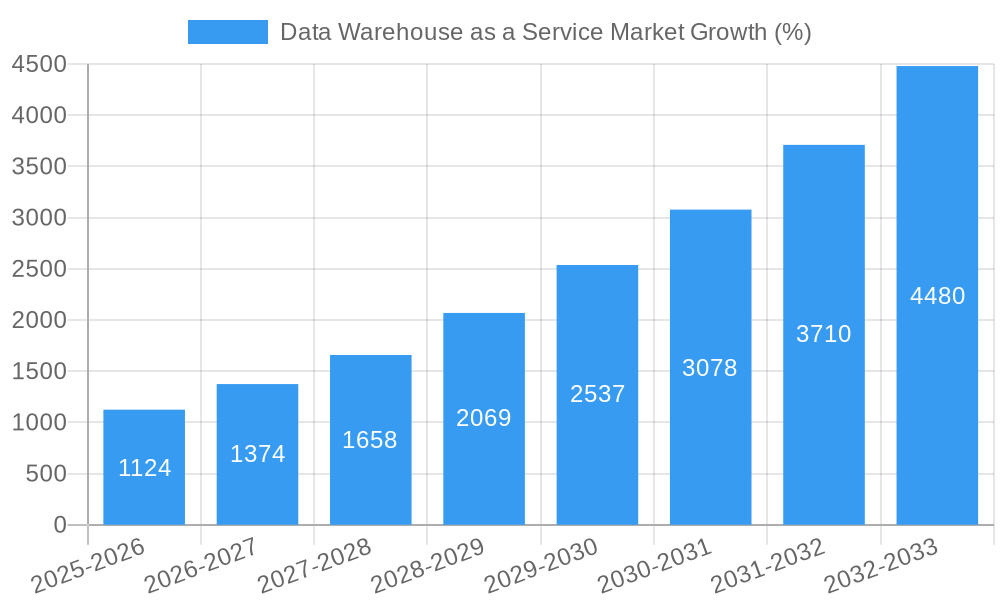
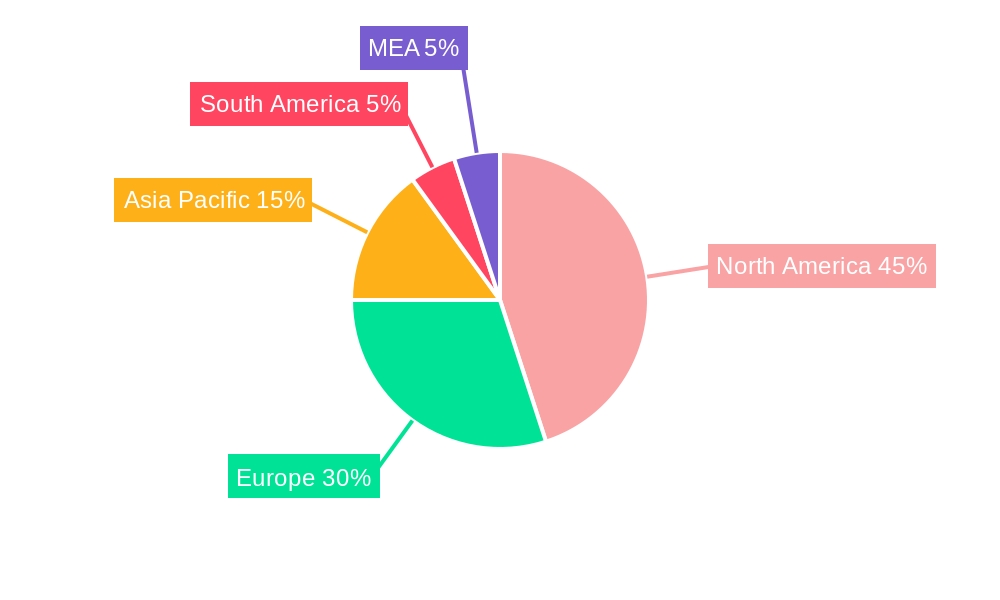
The Data Warehouse as a Service (DWaaS) market is experiencing robust growth, projected to reach $4.97 billion in 2025 and maintain a Compound Annual Growth Rate (CAGR) of 22.60% from 2025 to 2033. This expansion is driven by several factors. The increasing volume and velocity of data generated by organizations across diverse sectors, including BFSI, government, healthcare, and e-commerce, necessitate efficient and scalable data warehousing solutions. DWaaS offers a compelling alternative to on-premise solutions, providing cost-effectiveness, flexibility, and scalability through cloud-based infrastructure. Furthermore, the rising adoption of cloud computing and big data analytics fuels the demand for DWaaS, enabling organizations to derive valuable insights from their data for improved decision-making and operational efficiency. The market is segmented by organization size (large enterprises and SMEs) and end-user vertical, with large enterprises currently dominating but SME adoption showing strong growth potential. Competitive intensity is high, with major players like Google, Microsoft, Amazon, and Snowflake vying for market share through continuous innovation in features, performance, and pricing models. Geographical expansion is also a key driver, with North America currently holding a significant market share, followed by Europe and Asia Pacific, though regions like Asia Pacific are poised for faster growth due to increasing digitalization and cloud adoption.
The projected growth trajectory suggests significant opportunities for DWaaS providers. However, challenges remain. Concerns around data security, vendor lock-in, and the complexity of migrating existing data warehouses to the cloud may restrain market growth to some extent. Addressing these concerns through robust security measures, flexible migration strategies, and transparent pricing models will be crucial for vendors to maintain their competitive edge. The ongoing evolution of cloud technologies, including advancements in serverless computing and AI-powered analytics, will further shape the DWaaS landscape, driving innovation and creating new opportunities for market expansion over the forecast period. The market's future hinges on the continuous development of cost-effective, secure, and user-friendly DWaaS solutions that cater to the evolving needs of diverse industries.
Data Warehouse as a Service (DaaS) Market Report: 2019-2033
This comprehensive report provides a detailed analysis of the Data Warehouse as a Service (DaaS) market, encompassing market dynamics, growth trends, regional analysis, product landscape, key players, and future outlook. The study period covers 2019-2033, with 2025 as the base year and a forecast period of 2025-2033. The report is designed for industry professionals, investors, and strategists seeking in-depth insights into this rapidly evolving market. Parent market: Cloud Computing; Child market: Data Management.
Data Warehouse as a Service Market Dynamics & Structure
The DaaS market is characterized by a moderately concentrated landscape, with key players like Snowflake, Amazon AWS, and Google Cloud holding significant market share. Technological innovation, particularly in areas like cloud-native architecture, serverless computing, and AI/ML integration, are primary growth drivers. Regulatory frameworks concerning data privacy (GDPR, CCPA) significantly influence market practices and adoption. Competitive substitutes include traditional on-premises data warehouses and other cloud-based analytics platforms. End-user demographics are shifting towards increased adoption by SMEs, driven by the cost-effectiveness and scalability of DaaS solutions. The market has witnessed a significant number of M&A activities in recent years (xx deals in the last 5 years, resulting in xx% market share consolidation).
- Market Concentration: Moderately concentrated, with top 5 players holding approximately xx% market share in 2024.
- Technological Innovation: Cloud-native architectures, serverless computing, and AI/ML integration are key drivers.
- Regulatory Framework: GDPR, CCPA, and other data privacy regulations shape market practices.
- Competitive Substitutes: On-premises data warehouses, other cloud-based analytics platforms.
- M&A Trends: xx M&A deals in the last 5 years, leading to xx% market share consolidation.
- Innovation Barriers: High initial investment costs, skills gap in cloud data management.
Data Warehouse as a Service Market Growth Trends & Insights
The DaaS market experienced robust growth during the historical period (2019-2024), with a CAGR of xx%. This growth is fueled by increasing data volumes, the need for real-time analytics, and the rising adoption of cloud computing across various industries. The market size reached xx million in 2024 and is projected to reach xx million by 2033, exhibiting a CAGR of xx% during the forecast period (2025-2033). Market penetration is currently at approximately xx% in key regions and is expected to increase significantly due to factors like reduced Total Cost of Ownership (TCO) and improved scalability compared to traditional solutions. Technological disruptions, such as the emergence of serverless data warehousing and advancements in data visualization tools, continue to drive innovation and market expansion. Consumer behavior is shifting towards preference for pay-as-you-go models and enhanced self-service capabilities.
Dominant Regions, Countries, or Segments in Data Warehouse as a Service Market
North America currently holds the largest market share in the DaaS market, driven by early adoption of cloud technologies and a strong presence of major technology providers. Within segments, Large Enterprises are the primary adopters, followed by SMEs, showcasing a higher adoption rate in BFSI and E-commerce and Retail sectors.
- Leading Region: North America (holds approximately xx% market share in 2024).
- Leading Organization Segment: Large Enterprises (xx% market share in 2024)
- Leading End-User Vertical: BFSI (xx% market share in 2024)
- Key Drivers: Strong cloud infrastructure, high digital transformation spending, data privacy regulations.
- Growth Potential: High growth potential in Asia-Pacific and EMEA regions driven by increasing digitalization and cloud adoption.
Data Warehouse as a Service Market Product Landscape
The DaaS market offers a diverse range of products, including cloud-native data warehouses, serverless data warehousing platforms, and integrated data analytics suites. These solutions vary in terms of pricing models (pay-as-you-go, subscription-based), scalability, and the level of customization offered. Key differentiating factors include performance optimization techniques, integration with other cloud services, and the inclusion of advanced analytics capabilities like machine learning and AI. Recent innovations focus on enhanced security features, improved data governance tools, and the seamless integration of data from diverse sources.
Key Drivers, Barriers & Challenges in Data Warehouse as a Service Market
Key Drivers: The increasing volume and velocity of data, the need for real-time analytics, cost savings associated with cloud-based solutions, and the growing demand for improved data governance are major drivers of DaaS market growth. Technological advancements in cloud computing, AI, and machine learning further propel market expansion.
Key Challenges & Restraints: Data security and privacy concerns remain a significant barrier to adoption. Integration complexities with existing on-premises systems and the lack of skilled professionals in cloud data management pose challenges for businesses. Furthermore, vendor lock-in and the potential for high costs associated with data migration can hinder widespread adoption. Competition from established players and emerging startups also creates competitive pressure.
Emerging Opportunities in Data Warehouse as a Service Market
Emerging opportunities lie in the untapped potential of SMEs in developing economies, the growing demand for specialized DaaS solutions tailored to specific industries (e.g., healthcare, IoT), and the increasing integration of DaaS with other cloud services (e.g., machine learning platforms). Expansion into new geographies, particularly in developing markets with growing digitalization, presents significant opportunities.
Growth Accelerators in the Data Warehouse as a Service Market Industry
Strategic partnerships between DaaS providers and other technology companies are accelerating market growth. Technological breakthroughs in areas such as serverless computing and AI-powered data analytics enhance the capabilities of DaaS solutions and drive adoption. Market expansion into new geographies and industries with evolving consumer preferences fuels sustained market expansion.
Key Players Shaping the Data Warehouse as a Service Market Market
- Google LLP
- Micro Focus International PLC
- IBM Corporation
- Veeva Systems In
- Teradata Corporation
- Yellowbrick B V
- Cloudera Inc
- Microsoft Corporation
- Amazon Web Services Inc
- Snowflake Computing Inc
- Oracle Corporation
- Pivotal Software Inc
- SAP SE
Notable Milestones in Data Warehouse as a Service Market Sector
- May 2022: Dell partnered with Snowflake Inc to ease access to on-premises data. This partnership broadened Snowflake's reach to on-premises deployments.
- January 2022: Firebolt, a data warehouse startup, raised USD 100 million, demonstrating investor confidence in the DaaS market and its potential for rapid growth.
In-Depth Data Warehouse as a Service Market Market Outlook
The DaaS market is poised for continued robust growth, driven by ongoing technological innovation, increasing data volumes, and the rising adoption of cloud computing across various industries. Strategic partnerships, expanding into new geographies, and the development of tailored industry solutions will further accelerate market expansion. The focus on improving data security, enhancing data governance, and providing user-friendly interfaces will play a crucial role in the market's future success. The market presents significant opportunities for both established players and new entrants.
Data Warehouse as a Service Market Segmentation
-
1. Organization
- 1.1. Large Enterprises
- 1.2. Small and Medium Enterprises (SME)
-
2. End User Vertical
- 2.1. BFSI
- 2.2. Government
- 2.3. Healthcare
- 2.4. E-Commerce and Retail
- 2.5. Media and Entertainment
- 2.6. Other End-user Industries
Data Warehouse as a Service Market Segmentation By Geography
-
1. North America
- 1.1. United States
- 1.2. Canada
-
2. Europe
- 2.1. Germany
- 2.2. UK
- 2.3. France
- 2.4. Spain
- 2.5. Rest of Europe
-
3. Asia Pacific
- 3.1. China
- 3.2. Japan
- 3.3. India
- 3.4. Australia
- 3.5. Rest of Asia Pacific
-
4. Latin America
- 4.1. Brazil
- 4.2. Mexico
- 4.3. Argentina
- 4.4. Rest of Latin America
-
5. Middle East and Africa
- 5.1. UAE
- 5.2. Saudi Arabia
- 5.3. South Africa
- 5.4. Rest of Middle East and Africa
Data Warehouse as a Service Market REPORT HIGHLIGHTS
| Aspects | Details |
|---|---|
| Study Period | 2019-2033 |
| Base Year | 2024 |
| Estimated Year | 2025 |
| Forecast Period | 2025-2033 |
| Historical Period | 2019-2024 |
| Growth Rate | CAGR of 22.60% from 2019-2033 |
| Segmentation |
|
Table of Contents
- 1. Introduction
- 1.1. Research Scope
- 1.2. Market Segmentation
- 1.3. Research Methodology
- 1.4. Definitions and Assumptions
- 2. Executive Summary
- 2.1. Introduction
- 3. Market Dynamics
- 3.1. Introduction
- 3.2. Market Drivers
- 3.2.1. Rapid Adoption of Cloud-based Solutions and Focus on Real-time Data Analysis; Rising use of Data Warehouse services in BFSI sector to drive the market.; Data analytics and business intelligence are expected to play a major role in enterprise management.
- 3.3. Market Restrains
- 3.3.1. Data Security and Privacy Issues
- 3.4. Market Trends
- 3.4.1. Rising use of Data Warehouse services in BFSI sector to drive the market.
- 4. Market Factor Analysis
- 4.1. Porters Five Forces
- 4.2. Supply/Value Chain
- 4.3. PESTEL analysis
- 4.4. Market Entropy
- 4.5. Patent/Trademark Analysis
- 5. Global Data Warehouse as a Service Market Analysis, Insights and Forecast, 2019-2031
- 5.1. Market Analysis, Insights and Forecast - by Organization
- 5.1.1. Large Enterprises
- 5.1.2. Small and Medium Enterprises (SME)
- 5.2. Market Analysis, Insights and Forecast - by End User Vertical
- 5.2.1. BFSI
- 5.2.2. Government
- 5.2.3. Healthcare
- 5.2.4. E-Commerce and Retail
- 5.2.5. Media and Entertainment
- 5.2.6. Other End-user Industries
- 5.3. Market Analysis, Insights and Forecast - by Region
- 5.3.1. North America
- 5.3.2. Europe
- 5.3.3. Asia Pacific
- 5.3.4. Latin America
- 5.3.5. Middle East and Africa
- 5.1. Market Analysis, Insights and Forecast - by Organization
- 6. North America Data Warehouse as a Service Market Analysis, Insights and Forecast, 2019-2031
- 6.1. Market Analysis, Insights and Forecast - by Organization
- 6.1.1. Large Enterprises
- 6.1.2. Small and Medium Enterprises (SME)
- 6.2. Market Analysis, Insights and Forecast - by End User Vertical
- 6.2.1. BFSI
- 6.2.2. Government
- 6.2.3. Healthcare
- 6.2.4. E-Commerce and Retail
- 6.2.5. Media and Entertainment
- 6.2.6. Other End-user Industries
- 6.1. Market Analysis, Insights and Forecast - by Organization
- 7. Europe Data Warehouse as a Service Market Analysis, Insights and Forecast, 2019-2031
- 7.1. Market Analysis, Insights and Forecast - by Organization
- 7.1.1. Large Enterprises
- 7.1.2. Small and Medium Enterprises (SME)
- 7.2. Market Analysis, Insights and Forecast - by End User Vertical
- 7.2.1. BFSI
- 7.2.2. Government
- 7.2.3. Healthcare
- 7.2.4. E-Commerce and Retail
- 7.2.5. Media and Entertainment
- 7.2.6. Other End-user Industries
- 7.1. Market Analysis, Insights and Forecast - by Organization
- 8. Asia Pacific Data Warehouse as a Service Market Analysis, Insights and Forecast, 2019-2031
- 8.1. Market Analysis, Insights and Forecast - by Organization
- 8.1.1. Large Enterprises
- 8.1.2. Small and Medium Enterprises (SME)
- 8.2. Market Analysis, Insights and Forecast - by End User Vertical
- 8.2.1. BFSI
- 8.2.2. Government
- 8.2.3. Healthcare
- 8.2.4. E-Commerce and Retail
- 8.2.5. Media and Entertainment
- 8.2.6. Other End-user Industries
- 8.1. Market Analysis, Insights and Forecast - by Organization
- 9. Latin America Data Warehouse as a Service Market Analysis, Insights and Forecast, 2019-2031
- 9.1. Market Analysis, Insights and Forecast - by Organization
- 9.1.1. Large Enterprises
- 9.1.2. Small and Medium Enterprises (SME)
- 9.2. Market Analysis, Insights and Forecast - by End User Vertical
- 9.2.1. BFSI
- 9.2.2. Government
- 9.2.3. Healthcare
- 9.2.4. E-Commerce and Retail
- 9.2.5. Media and Entertainment
- 9.2.6. Other End-user Industries
- 9.1. Market Analysis, Insights and Forecast - by Organization
- 10. Middle East and Africa Data Warehouse as a Service Market Analysis, Insights and Forecast, 2019-2031
- 10.1. Market Analysis, Insights and Forecast - by Organization
- 10.1.1. Large Enterprises
- 10.1.2. Small and Medium Enterprises (SME)
- 10.2. Market Analysis, Insights and Forecast - by End User Vertical
- 10.2.1. BFSI
- 10.2.2. Government
- 10.2.3. Healthcare
- 10.2.4. E-Commerce and Retail
- 10.2.5. Media and Entertainment
- 10.2.6. Other End-user Industries
- 10.1. Market Analysis, Insights and Forecast - by Organization
- 11. North America Data Warehouse as a Service Market Analysis, Insights and Forecast, 2019-2031
- 11.1. Market Analysis, Insights and Forecast - By Country/Sub-region
- 11.1.1 United States
- 11.1.2 Canada
- 11.1.3 Mexico
- 12. Europe Data Warehouse as a Service Market Analysis, Insights and Forecast, 2019-2031
- 12.1. Market Analysis, Insights and Forecast - By Country/Sub-region
- 12.1.1 Germany
- 12.1.2 United Kingdom
- 12.1.3 France
- 12.1.4 Spain
- 12.1.5 Italy
- 12.1.6 Spain
- 12.1.7 Belgium
- 12.1.8 Netherland
- 12.1.9 Nordics
- 12.1.10 Rest of Europe
- 13. Asia Pacific Data Warehouse as a Service Market Analysis, Insights and Forecast, 2019-2031
- 13.1. Market Analysis, Insights and Forecast - By Country/Sub-region
- 13.1.1 China
- 13.1.2 Japan
- 13.1.3 India
- 13.1.4 South Korea
- 13.1.5 Southeast Asia
- 13.1.6 Australia
- 13.1.7 Indonesia
- 13.1.8 Phillipes
- 13.1.9 Singapore
- 13.1.10 Thailandc
- 13.1.11 Rest of Asia Pacific
- 14. South America Data Warehouse as a Service Market Analysis, Insights and Forecast, 2019-2031
- 14.1. Market Analysis, Insights and Forecast - By Country/Sub-region
- 14.1.1 Brazil
- 14.1.2 Argentina
- 14.1.3 Peru
- 14.1.4 Chile
- 14.1.5 Colombia
- 14.1.6 Ecuador
- 14.1.7 Venezuela
- 14.1.8 Rest of South America
- 15. North America Data Warehouse as a Service Market Analysis, Insights and Forecast, 2019-2031
- 15.1. Market Analysis, Insights and Forecast - By Country/Sub-region
- 15.1.1 United States
- 15.1.2 Canada
- 15.1.3 Mexico
- 16. MEA Data Warehouse as a Service Market Analysis, Insights and Forecast, 2019-2031
- 16.1. Market Analysis, Insights and Forecast - By Country/Sub-region
- 16.1.1 United Arab Emirates
- 16.1.2 Saudi Arabia
- 16.1.3 South Africa
- 16.1.4 Rest of Middle East and Africa
- 17. Competitive Analysis
- 17.1. Global Market Share Analysis 2024
- 17.2. Company Profiles
- 17.2.1 Google LLP
- 17.2.1.1. Overview
- 17.2.1.2. Products
- 17.2.1.3. SWOT Analysis
- 17.2.1.4. Recent Developments
- 17.2.1.5. Financials (Based on Availability)
- 17.2.2 Micro Focus International PLC
- 17.2.2.1. Overview
- 17.2.2.2. Products
- 17.2.2.3. SWOT Analysis
- 17.2.2.4. Recent Developments
- 17.2.2.5. Financials (Based on Availability)
- 17.2.3 IBM Corporation
- 17.2.3.1. Overview
- 17.2.3.2. Products
- 17.2.3.3. SWOT Analysis
- 17.2.3.4. Recent Developments
- 17.2.3.5. Financials (Based on Availability)
- 17.2.4 Veeva Systems In
- 17.2.4.1. Overview
- 17.2.4.2. Products
- 17.2.4.3. SWOT Analysis
- 17.2.4.4. Recent Developments
- 17.2.4.5. Financials (Based on Availability)
- 17.2.5 Teradata Corporation
- 17.2.5.1. Overview
- 17.2.5.2. Products
- 17.2.5.3. SWOT Analysis
- 17.2.5.4. Recent Developments
- 17.2.5.5. Financials (Based on Availability)
- 17.2.6 Yellowbrick B V
- 17.2.6.1. Overview
- 17.2.6.2. Products
- 17.2.6.3. SWOT Analysis
- 17.2.6.4. Recent Developments
- 17.2.6.5. Financials (Based on Availability)
- 17.2.7 Cloudera Inc
- 17.2.7.1. Overview
- 17.2.7.2. Products
- 17.2.7.3. SWOT Analysis
- 17.2.7.4. Recent Developments
- 17.2.7.5. Financials (Based on Availability)
- 17.2.8 Microsoft Corporation
- 17.2.8.1. Overview
- 17.2.8.2. Products
- 17.2.8.3. SWOT Analysis
- 17.2.8.4. Recent Developments
- 17.2.8.5. Financials (Based on Availability)
- 17.2.9 Amazon Web Services Inc
- 17.2.9.1. Overview
- 17.2.9.2. Products
- 17.2.9.3. SWOT Analysis
- 17.2.9.4. Recent Developments
- 17.2.9.5. Financials (Based on Availability)
- 17.2.10 Snowflake Computing Inc
- 17.2.10.1. Overview
- 17.2.10.2. Products
- 17.2.10.3. SWOT Analysis
- 17.2.10.4. Recent Developments
- 17.2.10.5. Financials (Based on Availability)
- 17.2.11 Oracle Corporation
- 17.2.11.1. Overview
- 17.2.11.2. Products
- 17.2.11.3. SWOT Analysis
- 17.2.11.4. Recent Developments
- 17.2.11.5. Financials (Based on Availability)
- 17.2.12 Pivotal Software Inc
- 17.2.12.1. Overview
- 17.2.12.2. Products
- 17.2.12.3. SWOT Analysis
- 17.2.12.4. Recent Developments
- 17.2.12.5. Financials (Based on Availability)
- 17.2.13 SAP SE
- 17.2.13.1. Overview
- 17.2.13.2. Products
- 17.2.13.3. SWOT Analysis
- 17.2.13.4. Recent Developments
- 17.2.13.5. Financials (Based on Availability)
- 17.2.1 Google LLP
List of Figures
- Figure 1: Global Data Warehouse as a Service Market Revenue Breakdown (Million, %) by Region 2024 & 2032
- Figure 2: Global Data Warehouse as a Service Market Volume Breakdown (K Unit, %) by Region 2024 & 2032
- Figure 3: North America Data Warehouse as a Service Market Revenue (Million), by Country 2024 & 2032
- Figure 4: North America Data Warehouse as a Service Market Volume (K Unit), by Country 2024 & 2032
- Figure 5: North America Data Warehouse as a Service Market Revenue Share (%), by Country 2024 & 2032
- Figure 6: North America Data Warehouse as a Service Market Volume Share (%), by Country 2024 & 2032
- Figure 7: Europe Data Warehouse as a Service Market Revenue (Million), by Country 2024 & 2032
- Figure 8: Europe Data Warehouse as a Service Market Volume (K Unit), by Country 2024 & 2032
- Figure 9: Europe Data Warehouse as a Service Market Revenue Share (%), by Country 2024 & 2032
- Figure 10: Europe Data Warehouse as a Service Market Volume Share (%), by Country 2024 & 2032
- Figure 11: Asia Pacific Data Warehouse as a Service Market Revenue (Million), by Country 2024 & 2032
- Figure 12: Asia Pacific Data Warehouse as a Service Market Volume (K Unit), by Country 2024 & 2032
- Figure 13: Asia Pacific Data Warehouse as a Service Market Revenue Share (%), by Country 2024 & 2032
- Figure 14: Asia Pacific Data Warehouse as a Service Market Volume Share (%), by Country 2024 & 2032
- Figure 15: South America Data Warehouse as a Service Market Revenue (Million), by Country 2024 & 2032
- Figure 16: South America Data Warehouse as a Service Market Volume (K Unit), by Country 2024 & 2032
- Figure 17: South America Data Warehouse as a Service Market Revenue Share (%), by Country 2024 & 2032
- Figure 18: South America Data Warehouse as a Service Market Volume Share (%), by Country 2024 & 2032
- Figure 19: North America Data Warehouse as a Service Market Revenue (Million), by Country 2024 & 2032
- Figure 20: North America Data Warehouse as a Service Market Volume (K Unit), by Country 2024 & 2032
- Figure 21: North America Data Warehouse as a Service Market Revenue Share (%), by Country 2024 & 2032
- Figure 22: North America Data Warehouse as a Service Market Volume Share (%), by Country 2024 & 2032
- Figure 23: MEA Data Warehouse as a Service Market Revenue (Million), by Country 2024 & 2032
- Figure 24: MEA Data Warehouse as a Service Market Volume (K Unit), by Country 2024 & 2032
- Figure 25: MEA Data Warehouse as a Service Market Revenue Share (%), by Country 2024 & 2032
- Figure 26: MEA Data Warehouse as a Service Market Volume Share (%), by Country 2024 & 2032
- Figure 27: North America Data Warehouse as a Service Market Revenue (Million), by Organization 2024 & 2032
- Figure 28: North America Data Warehouse as a Service Market Volume (K Unit), by Organization 2024 & 2032
- Figure 29: North America Data Warehouse as a Service Market Revenue Share (%), by Organization 2024 & 2032
- Figure 30: North America Data Warehouse as a Service Market Volume Share (%), by Organization 2024 & 2032
- Figure 31: North America Data Warehouse as a Service Market Revenue (Million), by End User Vertical 2024 & 2032
- Figure 32: North America Data Warehouse as a Service Market Volume (K Unit), by End User Vertical 2024 & 2032
- Figure 33: North America Data Warehouse as a Service Market Revenue Share (%), by End User Vertical 2024 & 2032
- Figure 34: North America Data Warehouse as a Service Market Volume Share (%), by End User Vertical 2024 & 2032
- Figure 35: North America Data Warehouse as a Service Market Revenue (Million), by Country 2024 & 2032
- Figure 36: North America Data Warehouse as a Service Market Volume (K Unit), by Country 2024 & 2032
- Figure 37: North America Data Warehouse as a Service Market Revenue Share (%), by Country 2024 & 2032
- Figure 38: North America Data Warehouse as a Service Market Volume Share (%), by Country 2024 & 2032
- Figure 39: Europe Data Warehouse as a Service Market Revenue (Million), by Organization 2024 & 2032
- Figure 40: Europe Data Warehouse as a Service Market Volume (K Unit), by Organization 2024 & 2032
- Figure 41: Europe Data Warehouse as a Service Market Revenue Share (%), by Organization 2024 & 2032
- Figure 42: Europe Data Warehouse as a Service Market Volume Share (%), by Organization 2024 & 2032
- Figure 43: Europe Data Warehouse as a Service Market Revenue (Million), by End User Vertical 2024 & 2032
- Figure 44: Europe Data Warehouse as a Service Market Volume (K Unit), by End User Vertical 2024 & 2032
- Figure 45: Europe Data Warehouse as a Service Market Revenue Share (%), by End User Vertical 2024 & 2032
- Figure 46: Europe Data Warehouse as a Service Market Volume Share (%), by End User Vertical 2024 & 2032
- Figure 47: Europe Data Warehouse as a Service Market Revenue (Million), by Country 2024 & 2032
- Figure 48: Europe Data Warehouse as a Service Market Volume (K Unit), by Country 2024 & 2032
- Figure 49: Europe Data Warehouse as a Service Market Revenue Share (%), by Country 2024 & 2032
- Figure 50: Europe Data Warehouse as a Service Market Volume Share (%), by Country 2024 & 2032
- Figure 51: Asia Pacific Data Warehouse as a Service Market Revenue (Million), by Organization 2024 & 2032
- Figure 52: Asia Pacific Data Warehouse as a Service Market Volume (K Unit), by Organization 2024 & 2032
- Figure 53: Asia Pacific Data Warehouse as a Service Market Revenue Share (%), by Organization 2024 & 2032
- Figure 54: Asia Pacific Data Warehouse as a Service Market Volume Share (%), by Organization 2024 & 2032
- Figure 55: Asia Pacific Data Warehouse as a Service Market Revenue (Million), by End User Vertical 2024 & 2032
- Figure 56: Asia Pacific Data Warehouse as a Service Market Volume (K Unit), by End User Vertical 2024 & 2032
- Figure 57: Asia Pacific Data Warehouse as a Service Market Revenue Share (%), by End User Vertical 2024 & 2032
- Figure 58: Asia Pacific Data Warehouse as a Service Market Volume Share (%), by End User Vertical 2024 & 2032
- Figure 59: Asia Pacific Data Warehouse as a Service Market Revenue (Million), by Country 2024 & 2032
- Figure 60: Asia Pacific Data Warehouse as a Service Market Volume (K Unit), by Country 2024 & 2032
- Figure 61: Asia Pacific Data Warehouse as a Service Market Revenue Share (%), by Country 2024 & 2032
- Figure 62: Asia Pacific Data Warehouse as a Service Market Volume Share (%), by Country 2024 & 2032
- Figure 63: Latin America Data Warehouse as a Service Market Revenue (Million), by Organization 2024 & 2032
- Figure 64: Latin America Data Warehouse as a Service Market Volume (K Unit), by Organization 2024 & 2032
- Figure 65: Latin America Data Warehouse as a Service Market Revenue Share (%), by Organization 2024 & 2032
- Figure 66: Latin America Data Warehouse as a Service Market Volume Share (%), by Organization 2024 & 2032
- Figure 67: Latin America Data Warehouse as a Service Market Revenue (Million), by End User Vertical 2024 & 2032
- Figure 68: Latin America Data Warehouse as a Service Market Volume (K Unit), by End User Vertical 2024 & 2032
- Figure 69: Latin America Data Warehouse as a Service Market Revenue Share (%), by End User Vertical 2024 & 2032
- Figure 70: Latin America Data Warehouse as a Service Market Volume Share (%), by End User Vertical 2024 & 2032
- Figure 71: Latin America Data Warehouse as a Service Market Revenue (Million), by Country 2024 & 2032
- Figure 72: Latin America Data Warehouse as a Service Market Volume (K Unit), by Country 2024 & 2032
- Figure 73: Latin America Data Warehouse as a Service Market Revenue Share (%), by Country 2024 & 2032
- Figure 74: Latin America Data Warehouse as a Service Market Volume Share (%), by Country 2024 & 2032
- Figure 75: Middle East and Africa Data Warehouse as a Service Market Revenue (Million), by Organization 2024 & 2032
- Figure 76: Middle East and Africa Data Warehouse as a Service Market Volume (K Unit), by Organization 2024 & 2032
- Figure 77: Middle East and Africa Data Warehouse as a Service Market Revenue Share (%), by Organization 2024 & 2032
- Figure 78: Middle East and Africa Data Warehouse as a Service Market Volume Share (%), by Organization 2024 & 2032
- Figure 79: Middle East and Africa Data Warehouse as a Service Market Revenue (Million), by End User Vertical 2024 & 2032
- Figure 80: Middle East and Africa Data Warehouse as a Service Market Volume (K Unit), by End User Vertical 2024 & 2032
- Figure 81: Middle East and Africa Data Warehouse as a Service Market Revenue Share (%), by End User Vertical 2024 & 2032
- Figure 82: Middle East and Africa Data Warehouse as a Service Market Volume Share (%), by End User Vertical 2024 & 2032
- Figure 83: Middle East and Africa Data Warehouse as a Service Market Revenue (Million), by Country 2024 & 2032
- Figure 84: Middle East and Africa Data Warehouse as a Service Market Volume (K Unit), by Country 2024 & 2032
- Figure 85: Middle East and Africa Data Warehouse as a Service Market Revenue Share (%), by Country 2024 & 2032
- Figure 86: Middle East and Africa Data Warehouse as a Service Market Volume Share (%), by Country 2024 & 2032
List of Tables
- Table 1: Global Data Warehouse as a Service Market Revenue Million Forecast, by Region 2019 & 2032
- Table 2: Global Data Warehouse as a Service Market Volume K Unit Forecast, by Region 2019 & 2032
- Table 3: Global Data Warehouse as a Service Market Revenue Million Forecast, by Organization 2019 & 2032
- Table 4: Global Data Warehouse as a Service Market Volume K Unit Forecast, by Organization 2019 & 2032
- Table 5: Global Data Warehouse as a Service Market Revenue Million Forecast, by End User Vertical 2019 & 2032
- Table 6: Global Data Warehouse as a Service Market Volume K Unit Forecast, by End User Vertical 2019 & 2032
- Table 7: Global Data Warehouse as a Service Market Revenue Million Forecast, by Region 2019 & 2032
- Table 8: Global Data Warehouse as a Service Market Volume K Unit Forecast, by Region 2019 & 2032
- Table 9: Global Data Warehouse as a Service Market Revenue Million Forecast, by Country 2019 & 2032
- Table 10: Global Data Warehouse as a Service Market Volume K Unit Forecast, by Country 2019 & 2032
- Table 11: United States Data Warehouse as a Service Market Revenue (Million) Forecast, by Application 2019 & 2032
- Table 12: United States Data Warehouse as a Service Market Volume (K Unit) Forecast, by Application 2019 & 2032
- Table 13: Canada Data Warehouse as a Service Market Revenue (Million) Forecast, by Application 2019 & 2032
- Table 14: Canada Data Warehouse as a Service Market Volume (K Unit) Forecast, by Application 2019 & 2032
- Table 15: Mexico Data Warehouse as a Service Market Revenue (Million) Forecast, by Application 2019 & 2032
- Table 16: Mexico Data Warehouse as a Service Market Volume (K Unit) Forecast, by Application 2019 & 2032
- Table 17: Global Data Warehouse as a Service Market Revenue Million Forecast, by Country 2019 & 2032
- Table 18: Global Data Warehouse as a Service Market Volume K Unit Forecast, by Country 2019 & 2032
- Table 19: Germany Data Warehouse as a Service Market Revenue (Million) Forecast, by Application 2019 & 2032
- Table 20: Germany Data Warehouse as a Service Market Volume (K Unit) Forecast, by Application 2019 & 2032
- Table 21: United Kingdom Data Warehouse as a Service Market Revenue (Million) Forecast, by Application 2019 & 2032
- Table 22: United Kingdom Data Warehouse as a Service Market Volume (K Unit) Forecast, by Application 2019 & 2032
- Table 23: France Data Warehouse as a Service Market Revenue (Million) Forecast, by Application 2019 & 2032
- Table 24: France Data Warehouse as a Service Market Volume (K Unit) Forecast, by Application 2019 & 2032
- Table 25: Spain Data Warehouse as a Service Market Revenue (Million) Forecast, by Application 2019 & 2032
- Table 26: Spain Data Warehouse as a Service Market Volume (K Unit) Forecast, by Application 2019 & 2032
- Table 27: Italy Data Warehouse as a Service Market Revenue (Million) Forecast, by Application 2019 & 2032
- Table 28: Italy Data Warehouse as a Service Market Volume (K Unit) Forecast, by Application 2019 & 2032
- Table 29: Spain Data Warehouse as a Service Market Revenue (Million) Forecast, by Application 2019 & 2032
- Table 30: Spain Data Warehouse as a Service Market Volume (K Unit) Forecast, by Application 2019 & 2032
- Table 31: Belgium Data Warehouse as a Service Market Revenue (Million) Forecast, by Application 2019 & 2032
- Table 32: Belgium Data Warehouse as a Service Market Volume (K Unit) Forecast, by Application 2019 & 2032
- Table 33: Netherland Data Warehouse as a Service Market Revenue (Million) Forecast, by Application 2019 & 2032
- Table 34: Netherland Data Warehouse as a Service Market Volume (K Unit) Forecast, by Application 2019 & 2032
- Table 35: Nordics Data Warehouse as a Service Market Revenue (Million) Forecast, by Application 2019 & 2032
- Table 36: Nordics Data Warehouse as a Service Market Volume (K Unit) Forecast, by Application 2019 & 2032
- Table 37: Rest of Europe Data Warehouse as a Service Market Revenue (Million) Forecast, by Application 2019 & 2032
- Table 38: Rest of Europe Data Warehouse as a Service Market Volume (K Unit) Forecast, by Application 2019 & 2032
- Table 39: Global Data Warehouse as a Service Market Revenue Million Forecast, by Country 2019 & 2032
- Table 40: Global Data Warehouse as a Service Market Volume K Unit Forecast, by Country 2019 & 2032
- Table 41: China Data Warehouse as a Service Market Revenue (Million) Forecast, by Application 2019 & 2032
- Table 42: China Data Warehouse as a Service Market Volume (K Unit) Forecast, by Application 2019 & 2032
- Table 43: Japan Data Warehouse as a Service Market Revenue (Million) Forecast, by Application 2019 & 2032
- Table 44: Japan Data Warehouse as a Service Market Volume (K Unit) Forecast, by Application 2019 & 2032
- Table 45: India Data Warehouse as a Service Market Revenue (Million) Forecast, by Application 2019 & 2032
- Table 46: India Data Warehouse as a Service Market Volume (K Unit) Forecast, by Application 2019 & 2032
- Table 47: South Korea Data Warehouse as a Service Market Revenue (Million) Forecast, by Application 2019 & 2032
- Table 48: South Korea Data Warehouse as a Service Market Volume (K Unit) Forecast, by Application 2019 & 2032
- Table 49: Southeast Asia Data Warehouse as a Service Market Revenue (Million) Forecast, by Application 2019 & 2032
- Table 50: Southeast Asia Data Warehouse as a Service Market Volume (K Unit) Forecast, by Application 2019 & 2032
- Table 51: Australia Data Warehouse as a Service Market Revenue (Million) Forecast, by Application 2019 & 2032
- Table 52: Australia Data Warehouse as a Service Market Volume (K Unit) Forecast, by Application 2019 & 2032
- Table 53: Indonesia Data Warehouse as a Service Market Revenue (Million) Forecast, by Application 2019 & 2032
- Table 54: Indonesia Data Warehouse as a Service Market Volume (K Unit) Forecast, by Application 2019 & 2032
- Table 55: Phillipes Data Warehouse as a Service Market Revenue (Million) Forecast, by Application 2019 & 2032
- Table 56: Phillipes Data Warehouse as a Service Market Volume (K Unit) Forecast, by Application 2019 & 2032
- Table 57: Singapore Data Warehouse as a Service Market Revenue (Million) Forecast, by Application 2019 & 2032
- Table 58: Singapore Data Warehouse as a Service Market Volume (K Unit) Forecast, by Application 2019 & 2032
- Table 59: Thailandc Data Warehouse as a Service Market Revenue (Million) Forecast, by Application 2019 & 2032
- Table 60: Thailandc Data Warehouse as a Service Market Volume (K Unit) Forecast, by Application 2019 & 2032
- Table 61: Rest of Asia Pacific Data Warehouse as a Service Market Revenue (Million) Forecast, by Application 2019 & 2032
- Table 62: Rest of Asia Pacific Data Warehouse as a Service Market Volume (K Unit) Forecast, by Application 2019 & 2032
- Table 63: Global Data Warehouse as a Service Market Revenue Million Forecast, by Country 2019 & 2032
- Table 64: Global Data Warehouse as a Service Market Volume K Unit Forecast, by Country 2019 & 2032
- Table 65: Brazil Data Warehouse as a Service Market Revenue (Million) Forecast, by Application 2019 & 2032
- Table 66: Brazil Data Warehouse as a Service Market Volume (K Unit) Forecast, by Application 2019 & 2032
- Table 67: Argentina Data Warehouse as a Service Market Revenue (Million) Forecast, by Application 2019 & 2032
- Table 68: Argentina Data Warehouse as a Service Market Volume (K Unit) Forecast, by Application 2019 & 2032
- Table 69: Peru Data Warehouse as a Service Market Revenue (Million) Forecast, by Application 2019 & 2032
- Table 70: Peru Data Warehouse as a Service Market Volume (K Unit) Forecast, by Application 2019 & 2032
- Table 71: Chile Data Warehouse as a Service Market Revenue (Million) Forecast, by Application 2019 & 2032
- Table 72: Chile Data Warehouse as a Service Market Volume (K Unit) Forecast, by Application 2019 & 2032
- Table 73: Colombia Data Warehouse as a Service Market Revenue (Million) Forecast, by Application 2019 & 2032
- Table 74: Colombia Data Warehouse as a Service Market Volume (K Unit) Forecast, by Application 2019 & 2032
- Table 75: Ecuador Data Warehouse as a Service Market Revenue (Million) Forecast, by Application 2019 & 2032
- Table 76: Ecuador Data Warehouse as a Service Market Volume (K Unit) Forecast, by Application 2019 & 2032
- Table 77: Venezuela Data Warehouse as a Service Market Revenue (Million) Forecast, by Application 2019 & 2032
- Table 78: Venezuela Data Warehouse as a Service Market Volume (K Unit) Forecast, by Application 2019 & 2032
- Table 79: Rest of South America Data Warehouse as a Service Market Revenue (Million) Forecast, by Application 2019 & 2032
- Table 80: Rest of South America Data Warehouse as a Service Market Volume (K Unit) Forecast, by Application 2019 & 2032
- Table 81: Global Data Warehouse as a Service Market Revenue Million Forecast, by Country 2019 & 2032
- Table 82: Global Data Warehouse as a Service Market Volume K Unit Forecast, by Country 2019 & 2032
- Table 83: United States Data Warehouse as a Service Market Revenue (Million) Forecast, by Application 2019 & 2032
- Table 84: United States Data Warehouse as a Service Market Volume (K Unit) Forecast, by Application 2019 & 2032
- Table 85: Canada Data Warehouse as a Service Market Revenue (Million) Forecast, by Application 2019 & 2032
- Table 86: Canada Data Warehouse as a Service Market Volume (K Unit) Forecast, by Application 2019 & 2032
- Table 87: Mexico Data Warehouse as a Service Market Revenue (Million) Forecast, by Application 2019 & 2032
- Table 88: Mexico Data Warehouse as a Service Market Volume (K Unit) Forecast, by Application 2019 & 2032
- Table 89: Global Data Warehouse as a Service Market Revenue Million Forecast, by Country 2019 & 2032
- Table 90: Global Data Warehouse as a Service Market Volume K Unit Forecast, by Country 2019 & 2032
- Table 91: United Arab Emirates Data Warehouse as a Service Market Revenue (Million) Forecast, by Application 2019 & 2032
- Table 92: United Arab Emirates Data Warehouse as a Service Market Volume (K Unit) Forecast, by Application 2019 & 2032
- Table 93: Saudi Arabia Data Warehouse as a Service Market Revenue (Million) Forecast, by Application 2019 & 2032
- Table 94: Saudi Arabia Data Warehouse as a Service Market Volume (K Unit) Forecast, by Application 2019 & 2032
- Table 95: South Africa Data Warehouse as a Service Market Revenue (Million) Forecast, by Application 2019 & 2032
- Table 96: South Africa Data Warehouse as a Service Market Volume (K Unit) Forecast, by Application 2019 & 2032
- Table 97: Rest of Middle East and Africa Data Warehouse as a Service Market Revenue (Million) Forecast, by Application 2019 & 2032
- Table 98: Rest of Middle East and Africa Data Warehouse as a Service Market Volume (K Unit) Forecast, by Application 2019 & 2032
- Table 99: Global Data Warehouse as a Service Market Revenue Million Forecast, by Organization 2019 & 2032
- Table 100: Global Data Warehouse as a Service Market Volume K Unit Forecast, by Organization 2019 & 2032
- Table 101: Global Data Warehouse as a Service Market Revenue Million Forecast, by End User Vertical 2019 & 2032
- Table 102: Global Data Warehouse as a Service Market Volume K Unit Forecast, by End User Vertical 2019 & 2032
- Table 103: Global Data Warehouse as a Service Market Revenue Million Forecast, by Country 2019 & 2032
- Table 104: Global Data Warehouse as a Service Market Volume K Unit Forecast, by Country 2019 & 2032
- Table 105: United States Data Warehouse as a Service Market Revenue (Million) Forecast, by Application 2019 & 2032
- Table 106: United States Data Warehouse as a Service Market Volume (K Unit) Forecast, by Application 2019 & 2032
- Table 107: Canada Data Warehouse as a Service Market Revenue (Million) Forecast, by Application 2019 & 2032
- Table 108: Canada Data Warehouse as a Service Market Volume (K Unit) Forecast, by Application 2019 & 2032
- Table 109: Global Data Warehouse as a Service Market Revenue Million Forecast, by Organization 2019 & 2032
- Table 110: Global Data Warehouse as a Service Market Volume K Unit Forecast, by Organization 2019 & 2032
- Table 111: Global Data Warehouse as a Service Market Revenue Million Forecast, by End User Vertical 2019 & 2032
- Table 112: Global Data Warehouse as a Service Market Volume K Unit Forecast, by End User Vertical 2019 & 2032
- Table 113: Global Data Warehouse as a Service Market Revenue Million Forecast, by Country 2019 & 2032
- Table 114: Global Data Warehouse as a Service Market Volume K Unit Forecast, by Country 2019 & 2032
- Table 115: Germany Data Warehouse as a Service Market Revenue (Million) Forecast, by Application 2019 & 2032
- Table 116: Germany Data Warehouse as a Service Market Volume (K Unit) Forecast, by Application 2019 & 2032
- Table 117: UK Data Warehouse as a Service Market Revenue (Million) Forecast, by Application 2019 & 2032
- Table 118: UK Data Warehouse as a Service Market Volume (K Unit) Forecast, by Application 2019 & 2032
- Table 119: France Data Warehouse as a Service Market Revenue (Million) Forecast, by Application 2019 & 2032
- Table 120: France Data Warehouse as a Service Market Volume (K Unit) Forecast, by Application 2019 & 2032
- Table 121: Spain Data Warehouse as a Service Market Revenue (Million) Forecast, by Application 2019 & 2032
- Table 122: Spain Data Warehouse as a Service Market Volume (K Unit) Forecast, by Application 2019 & 2032
- Table 123: Rest of Europe Data Warehouse as a Service Market Revenue (Million) Forecast, by Application 2019 & 2032
- Table 124: Rest of Europe Data Warehouse as a Service Market Volume (K Unit) Forecast, by Application 2019 & 2032
- Table 125: Global Data Warehouse as a Service Market Revenue Million Forecast, by Organization 2019 & 2032
- Table 126: Global Data Warehouse as a Service Market Volume K Unit Forecast, by Organization 2019 & 2032
- Table 127: Global Data Warehouse as a Service Market Revenue Million Forecast, by End User Vertical 2019 & 2032
- Table 128: Global Data Warehouse as a Service Market Volume K Unit Forecast, by End User Vertical 2019 & 2032
- Table 129: Global Data Warehouse as a Service Market Revenue Million Forecast, by Country 2019 & 2032
- Table 130: Global Data Warehouse as a Service Market Volume K Unit Forecast, by Country 2019 & 2032
- Table 131: China Data Warehouse as a Service Market Revenue (Million) Forecast, by Application 2019 & 2032
- Table 132: China Data Warehouse as a Service Market Volume (K Unit) Forecast, by Application 2019 & 2032
- Table 133: Japan Data Warehouse as a Service Market Revenue (Million) Forecast, by Application 2019 & 2032
- Table 134: Japan Data Warehouse as a Service Market Volume (K Unit) Forecast, by Application 2019 & 2032
- Table 135: India Data Warehouse as a Service Market Revenue (Million) Forecast, by Application 2019 & 2032
- Table 136: India Data Warehouse as a Service Market Volume (K Unit) Forecast, by Application 2019 & 2032
- Table 137: Australia Data Warehouse as a Service Market Revenue (Million) Forecast, by Application 2019 & 2032
- Table 138: Australia Data Warehouse as a Service Market Volume (K Unit) Forecast, by Application 2019 & 2032
- Table 139: Rest of Asia Pacific Data Warehouse as a Service Market Revenue (Million) Forecast, by Application 2019 & 2032
- Table 140: Rest of Asia Pacific Data Warehouse as a Service Market Volume (K Unit) Forecast, by Application 2019 & 2032
- Table 141: Global Data Warehouse as a Service Market Revenue Million Forecast, by Organization 2019 & 2032
- Table 142: Global Data Warehouse as a Service Market Volume K Unit Forecast, by Organization 2019 & 2032
- Table 143: Global Data Warehouse as a Service Market Revenue Million Forecast, by End User Vertical 2019 & 2032
- Table 144: Global Data Warehouse as a Service Market Volume K Unit Forecast, by End User Vertical 2019 & 2032
- Table 145: Global Data Warehouse as a Service Market Revenue Million Forecast, by Country 2019 & 2032
- Table 146: Global Data Warehouse as a Service Market Volume K Unit Forecast, by Country 2019 & 2032
- Table 147: Brazil Data Warehouse as a Service Market Revenue (Million) Forecast, by Application 2019 & 2032
- Table 148: Brazil Data Warehouse as a Service Market Volume (K Unit) Forecast, by Application 2019 & 2032
- Table 149: Mexico Data Warehouse as a Service Market Revenue (Million) Forecast, by Application 2019 & 2032
- Table 150: Mexico Data Warehouse as a Service Market Volume (K Unit) Forecast, by Application 2019 & 2032
- Table 151: Argentina Data Warehouse as a Service Market Revenue (Million) Forecast, by Application 2019 & 2032
- Table 152: Argentina Data Warehouse as a Service Market Volume (K Unit) Forecast, by Application 2019 & 2032
- Table 153: Rest of Latin America Data Warehouse as a Service Market Revenue (Million) Forecast, by Application 2019 & 2032
- Table 154: Rest of Latin America Data Warehouse as a Service Market Volume (K Unit) Forecast, by Application 2019 & 2032
- Table 155: Global Data Warehouse as a Service Market Revenue Million Forecast, by Organization 2019 & 2032
- Table 156: Global Data Warehouse as a Service Market Volume K Unit Forecast, by Organization 2019 & 2032
- Table 157: Global Data Warehouse as a Service Market Revenue Million Forecast, by End User Vertical 2019 & 2032
- Table 158: Global Data Warehouse as a Service Market Volume K Unit Forecast, by End User Vertical 2019 & 2032
- Table 159: Global Data Warehouse as a Service Market Revenue Million Forecast, by Country 2019 & 2032
- Table 160: Global Data Warehouse as a Service Market Volume K Unit Forecast, by Country 2019 & 2032
- Table 161: UAE Data Warehouse as a Service Market Revenue (Million) Forecast, by Application 2019 & 2032
- Table 162: UAE Data Warehouse as a Service Market Volume (K Unit) Forecast, by Application 2019 & 2032
- Table 163: Saudi Arabia Data Warehouse as a Service Market Revenue (Million) Forecast, by Application 2019 & 2032
- Table 164: Saudi Arabia Data Warehouse as a Service Market Volume (K Unit) Forecast, by Application 2019 & 2032
- Table 165: South Africa Data Warehouse as a Service Market Revenue (Million) Forecast, by Application 2019 & 2032
- Table 166: South Africa Data Warehouse as a Service Market Volume (K Unit) Forecast, by Application 2019 & 2032
- Table 167: Rest of Middle East and Africa Data Warehouse as a Service Market Revenue (Million) Forecast, by Application 2019 & 2032
- Table 168: Rest of Middle East and Africa Data Warehouse as a Service Market Volume (K Unit) Forecast, by Application 2019 & 2032
Frequently Asked Questions
1. What is the projected Compound Annual Growth Rate (CAGR) of the Data Warehouse as a Service Market?
The projected CAGR is approximately 22.60%.
2. Which companies are prominent players in the Data Warehouse as a Service Market?
Key companies in the market include Google LLP, Micro Focus International PLC, IBM Corporation, Veeva Systems In, Teradata Corporation, Yellowbrick B V, Cloudera Inc, Microsoft Corporation, Amazon Web Services Inc, Snowflake Computing Inc, Oracle Corporation, Pivotal Software Inc, SAP SE.
3. What are the main segments of the Data Warehouse as a Service Market?
The market segments include Organization, End User Vertical.
4. Can you provide details about the market size?
The market size is estimated to be USD 4.97 Million as of 2022.
5. What are some drivers contributing to market growth?
Rapid Adoption of Cloud-based Solutions and Focus on Real-time Data Analysis; Rising use of Data Warehouse services in BFSI sector to drive the market.; Data analytics and business intelligence are expected to play a major role in enterprise management..
6. What are the notable trends driving market growth?
Rising use of Data Warehouse services in BFSI sector to drive the market..
7. Are there any restraints impacting market growth?
Data Security and Privacy Issues.
8. Can you provide examples of recent developments in the market?
May 2022 - Dell partnered with Snowflake Inc to ease access to on-premises data. The partnership between Snowflake Inc. and Dell Technologies brings Snowflake Data Cloud's tools to on-premises object storage.
9. What pricing options are available for accessing the report?
Pricing options include single-user, multi-user, and enterprise licenses priced at USD 4750, USD 5250, and USD 8750 respectively.
10. Is the market size provided in terms of value or volume?
The market size is provided in terms of value, measured in Million and volume, measured in K Unit.
11. Are there any specific market keywords associated with the report?
Yes, the market keyword associated with the report is "Data Warehouse as a Service Market," which aids in identifying and referencing the specific market segment covered.
12. How do I determine which pricing option suits my needs best?
The pricing options vary based on user requirements and access needs. Individual users may opt for single-user licenses, while businesses requiring broader access may choose multi-user or enterprise licenses for cost-effective access to the report.
13. Are there any additional resources or data provided in the Data Warehouse as a Service Market report?
While the report offers comprehensive insights, it's advisable to review the specific contents or supplementary materials provided to ascertain if additional resources or data are available.
14. How can I stay updated on further developments or reports in the Data Warehouse as a Service Market?
To stay informed about further developments, trends, and reports in the Data Warehouse as a Service Market, consider subscribing to industry newsletters, following relevant companies and organizations, or regularly checking reputable industry news sources and publications.
Methodology
Step 1 - Identification of Relevant Samples Size from Population Database


Step 2 - Approaches for Defining Global Market Size (Value, Volume* & Price*)

Note*: In applicable scenarios
Step 3 - Data Sources
Primary Research
- Web Analytics
- Survey Reports
- Research Institute
- Latest Research Reports
- Opinion Leaders
Secondary Research
- Annual Reports
- White Paper
- Latest Press Release
- Industry Association
- Paid Database
- Investor Presentations

Step 4 - Data Triangulation
Involves using different sources of information in order to increase the validity of a study
These sources are likely to be stakeholders in a program - participants, other researchers, program staff, other community members, and so on.
Then we put all data in single framework & apply various statistical tools to find out the dynamic on the market.
During the analysis stage, feedback from the stakeholder groups would be compared to determine areas of agreement as well as areas of divergence


