
Key Insights
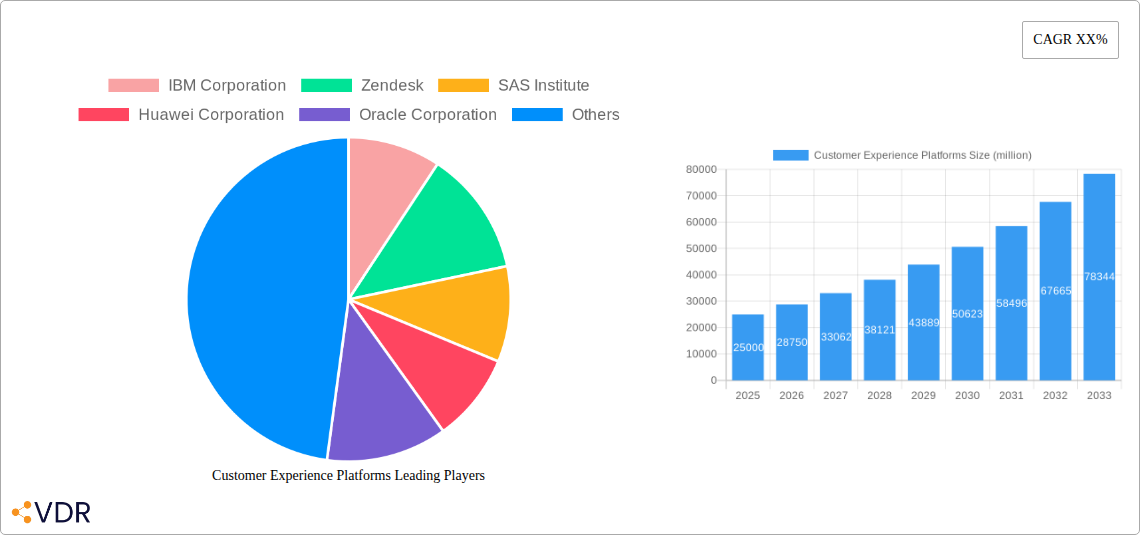
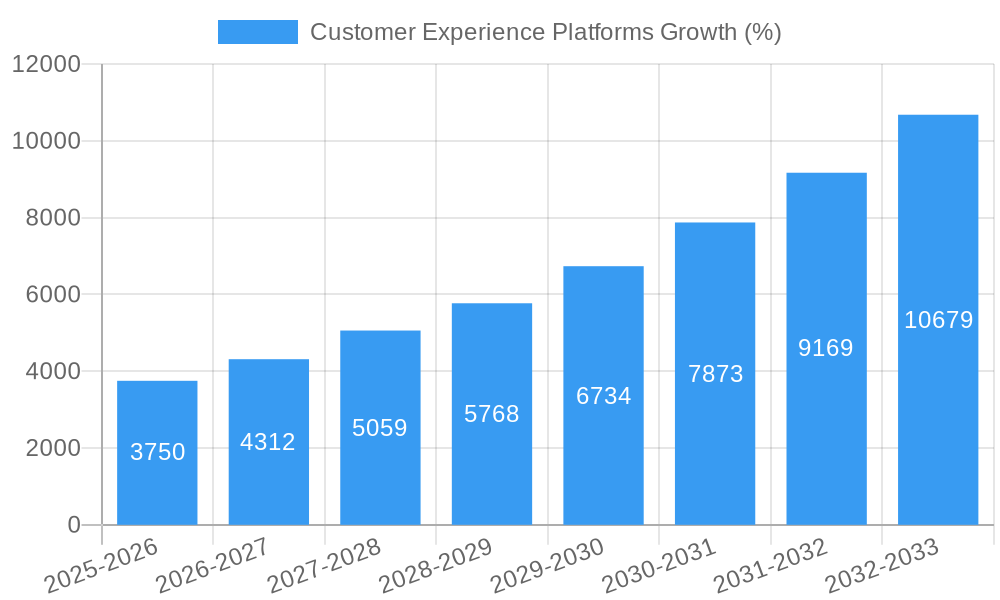
The Customer Experience (CX) Platforms market is experiencing robust growth, driven by the increasing need for businesses to enhance customer satisfaction and loyalty in a competitive landscape. The market, estimated at $25 billion in 2025, is projected to maintain a healthy Compound Annual Growth Rate (CAGR) of 15% through 2033. This expansion is fueled by several key factors. Firstly, the rising adoption of cloud-based solutions offers scalability, cost-effectiveness, and accessibility, making CX platforms more attractive to businesses of all sizes. Secondly, the increasing importance of data analytics in understanding customer behavior and preferences is driving the demand for platforms with advanced analytics capabilities. Thirdly, the growing focus on omnichannel customer engagement, enabling seamless interactions across multiple touchpoints, is further boosting market growth. Finally, the evolution towards AI-powered solutions, offering personalized experiences and automated customer service, is a significant growth driver.
However, the market also faces certain restraints. High initial investment costs for implementing and integrating CX platforms can be a barrier for smaller businesses. The complexity of integrating these platforms with existing systems and the need for specialized technical expertise also pose challenges. Furthermore, data security and privacy concerns surrounding customer data are critical considerations that must be addressed. Despite these challenges, the long-term outlook for the CX Platforms market remains positive, driven by continuous technological advancements and the growing recognition of the crucial role of CX in business success. Leading players such as IBM, Zendesk, and Salesforce are constantly innovating and expanding their offerings, further fueling market competition and driving overall growth.
Customer Experience Platforms Market Report: 2019-2033
This comprehensive report provides an in-depth analysis of the Customer Experience Platforms market, encompassing market dynamics, growth trends, regional dominance, product landscape, key players, and future outlook. The study period covers 2019-2033, with a base year of 2025 and a forecast period of 2025-2033. The report leverages extensive data analysis and industry expertise to provide actionable insights for businesses operating in this dynamic sector. The parent market is the broader Customer Relationship Management (CRM) market, while the child market is specifically focused on Customer Experience Platforms. The market size is projected to reach xx million units by 2033.
Customer Experience Platforms Market Dynamics & Structure
The Customer Experience Platforms market is characterized by moderate concentration, with key players holding significant market share. Technological innovations, particularly in AI and machine learning, are driving market growth. Regulatory frameworks concerning data privacy and security are shaping industry practices. Competitive substitutes include traditional CRM systems and bespoke solutions. End-user demographics are diverse, spanning various industries and company sizes. The historical period (2019-2024) witnessed a significant number of M&A activities, with an estimated xx deals.
- Market Concentration: Moderately concentrated, with top 5 players holding xx% market share in 2025.
- Technological Innovation: AI, machine learning, and automation are key drivers.
- Regulatory Frameworks: GDPR, CCPA, and other data privacy regulations are influencing product development.
- Competitive Substitutes: Traditional CRM systems and in-house solutions pose competition.
- End-User Demographics: Businesses of all sizes across various sectors.
- M&A Activity: xx deals in the historical period, indicating consolidation trends.
Customer Experience Platforms Growth Trends & Insights
The Customer Experience Platforms market witnessed robust growth during the historical period (2019-2024), driven by increasing customer expectations and the need for personalized experiences. Market size grew from xx million units in 2019 to xx million units in 2024, registering a CAGR of xx%. Adoption rates are increasing across various industries. Technological disruptions, such as the rise of cloud-based solutions and omnichannel capabilities, are reshaping the market landscape. Shifting consumer behavior, favoring digital interactions and personalized experiences, further fuels market expansion. The forecast period (2025-2033) projects continued growth, reaching xx million units by 2033, driven by factors detailed in this report. Market penetration is expected to increase from xx% in 2025 to xx% by 2033.
Dominant Regions, Countries, or Segments in Customer Experience Platforms
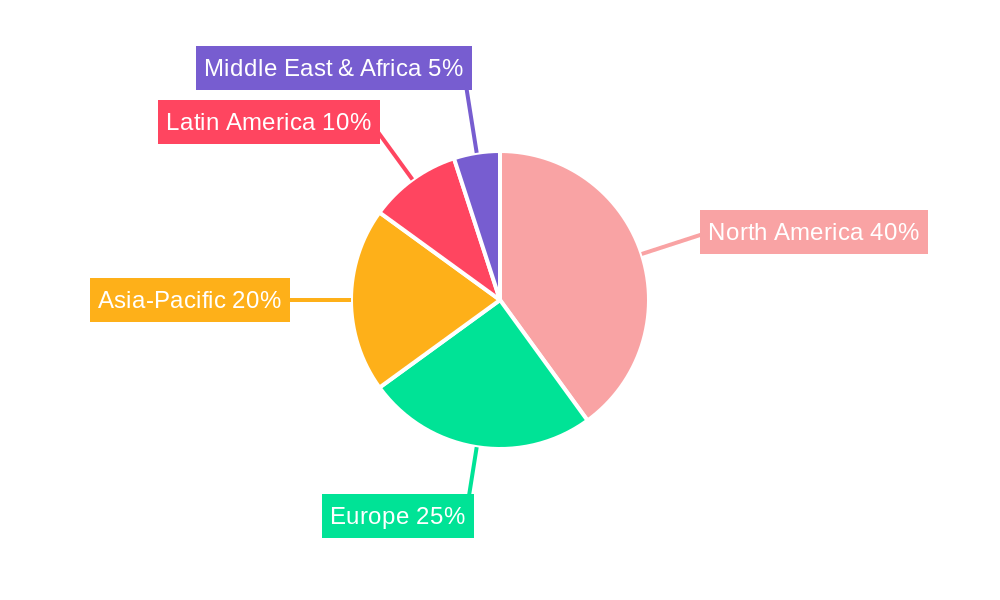
North America currently dominates the Customer Experience Platforms market, holding the largest market share, driven by early adoption of new technologies and a mature digital infrastructure. However, Asia Pacific is projected to experience the fastest growth in the forecast period due to increasing digitalization and expanding internet penetration. Within specific segments, the banking, finance, and retail sectors show strong adoption.
- North America: High market penetration, advanced infrastructure, early adoption of technology.
- Asia Pacific: Fastest growth potential due to rising digitalization and expanding internet penetration.
- Europe: Steady growth, driven by strong regulatory frameworks and increasing focus on customer centricity.
- Key Segments: Banking, Finance, Retail, and Telecommunications.
Customer Experience Platforms Product Landscape
Customer Experience Platforms offer a range of functionalities, including analytics dashboards, omnichannel engagement tools, feedback management systems, and AI-powered personalization features. Product innovations focus on enhancing user experience, improving data analytics capabilities, and strengthening integration with other enterprise systems. Key performance indicators include customer satisfaction scores (CSAT), Net Promoter Score (NPS), and cost reduction. The market is witnessing a trend towards more integrated, AI-powered solutions offering a holistic view of the customer journey.
Key Drivers, Barriers & Challenges in Customer Experience Platforms
Key Drivers:
- Increasing customer expectations for personalized experiences.
- Growing adoption of digital channels.
- Rise of cloud-based solutions.
- Advancements in AI and machine learning.
Key Barriers and Challenges:
- Data privacy and security concerns.
- High implementation costs.
- Integration complexities with existing systems.
- Lack of skilled professionals.
- Competition from established CRM vendors. The impact of these challenges is estimated to reduce market growth by xx% in the forecast period.
Emerging Opportunities in Customer Experience Platforms
- Expansion into untapped markets (e.g., SMEs in developing countries).
- Development of niche solutions for specific industries.
- Leveraging IoT and other emerging technologies.
- Focus on proactive customer service and support.
- Growing demand for AI-powered chatbots and virtual assistants.
Growth Accelerators in the Customer Experience Platforms Industry
Strategic partnerships, particularly between Customer Experience Platform providers and technology companies specializing in AI or data analytics, will propel market expansion. The development and integration of new technologies, coupled with an expanding range of applications will increase the adoption rates and market penetration. Investments in research and development will be pivotal in driving innovation.
Key Players Shaping the Customer Experience Platforms Market
- IBM Corporation
- Zendesk
- SAS Institute
- Huawei Corporation
- Oracle Corporation
- Qualtrics
- Cisco Systems
- OpenText Corporation
- Tech Mahindra
- TCS
- Adobe Systems Incorporated
- Software AG
- Avaya
Notable Milestones in Customer Experience Platforms Sector
- 2020, Q3: Launch of AI-powered customer service platform by Company X.
- 2021, Q1: Acquisition of Company Y by Company Z.
- 2022, Q4: Introduction of a new omnichannel engagement solution by Company A.
- 2023, Q2: Partnership between Company B and Company C to integrate their platforms. (Note: Replace Company X, Y, Z, A, B, and C with actual company names and specific details.)
In-Depth Customer Experience Platforms Market Outlook
The Customer Experience Platforms market is poised for continued growth, driven by technological advancements, increased customer expectations, and expanding adoption across diverse industries. Strategic partnerships, focus on innovation, and expansion into new markets will be crucial for success. The market's long-term potential is significant, with opportunities for both established players and new entrants. The market's projected growth rate indicates strong investment potential in this dynamic sector.
Customer Experience Platforms Segmentation
-
1. Application
- 1.1. BFSI
- 1.2. IT & Telecom
- 1.3. Healthcare
- 1.4. Hospitality
- 1.5. Consumer Goods & Retail
- 1.6. Media and Entertainment
- 1.7. Others
-
2. Types
- 2.1. Windows
- 2.2. iOS
- 2.3. Android
Customer Experience Platforms Segmentation By Geography
-
1. North America
- 1.1. United States
- 1.2. Canada
- 1.3. Mexico
-
2. South America
- 2.1. Brazil
- 2.2. Argentina
- 2.3. Rest of South America
-
3. Europe
- 3.1. United Kingdom
- 3.2. Germany
- 3.3. France
- 3.4. Italy
- 3.5. Spain
- 3.6. Russia
- 3.7. Benelux
- 3.8. Nordics
- 3.9. Rest of Europe
-
4. Middle East & Africa
- 4.1. Turkey
- 4.2. Israel
- 4.3. GCC
- 4.4. North Africa
- 4.5. South Africa
- 4.6. Rest of Middle East & Africa
-
5. Asia Pacific
- 5.1. China
- 5.2. India
- 5.3. Japan
- 5.4. South Korea
- 5.5. ASEAN
- 5.6. Oceania
- 5.7. Rest of Asia Pacific
Customer Experience Platforms REPORT HIGHLIGHTS
| Aspects | Details |
|---|---|
| Study Period | 2019-2033 |
| Base Year | 2024 |
| Estimated Year | 2025 |
| Forecast Period | 2025-2033 |
| Historical Period | 2019-2024 |
| Growth Rate | CAGR of XX% from 2019-2033 |
| Segmentation |
|
Table of Contents
- 1. Introduction
- 1.1. Research Scope
- 1.2. Market Segmentation
- 1.3. Research Methodology
- 1.4. Definitions and Assumptions
- 2. Executive Summary
- 2.1. Introduction
- 3. Market Dynamics
- 3.1. Introduction
- 3.2. Market Drivers
- 3.3. Market Restrains
- 3.4. Market Trends
- 4. Market Factor Analysis
- 4.1. Porters Five Forces
- 4.2. Supply/Value Chain
- 4.3. PESTEL analysis
- 4.4. Market Entropy
- 4.5. Patent/Trademark Analysis
- 5. Global Customer Experience Platforms Analysis, Insights and Forecast, 2019-2031
- 5.1. Market Analysis, Insights and Forecast - by Application
- 5.1.1. BFSI
- 5.1.2. IT & Telecom
- 5.1.3. Healthcare
- 5.1.4. Hospitality
- 5.1.5. Consumer Goods & Retail
- 5.1.6. Media and Entertainment
- 5.1.7. Others
- 5.2. Market Analysis, Insights and Forecast - by Types
- 5.2.1. Windows
- 5.2.2. iOS
- 5.2.3. Android
- 5.3. Market Analysis, Insights and Forecast - by Region
- 5.3.1. North America
- 5.3.2. South America
- 5.3.3. Europe
- 5.3.4. Middle East & Africa
- 5.3.5. Asia Pacific
- 5.1. Market Analysis, Insights and Forecast - by Application
- 6. North America Customer Experience Platforms Analysis, Insights and Forecast, 2019-2031
- 6.1. Market Analysis, Insights and Forecast - by Application
- 6.1.1. BFSI
- 6.1.2. IT & Telecom
- 6.1.3. Healthcare
- 6.1.4. Hospitality
- 6.1.5. Consumer Goods & Retail
- 6.1.6. Media and Entertainment
- 6.1.7. Others
- 6.2. Market Analysis, Insights and Forecast - by Types
- 6.2.1. Windows
- 6.2.2. iOS
- 6.2.3. Android
- 6.1. Market Analysis, Insights and Forecast - by Application
- 7. South America Customer Experience Platforms Analysis, Insights and Forecast, 2019-2031
- 7.1. Market Analysis, Insights and Forecast - by Application
- 7.1.1. BFSI
- 7.1.2. IT & Telecom
- 7.1.3. Healthcare
- 7.1.4. Hospitality
- 7.1.5. Consumer Goods & Retail
- 7.1.6. Media and Entertainment
- 7.1.7. Others
- 7.2. Market Analysis, Insights and Forecast - by Types
- 7.2.1. Windows
- 7.2.2. iOS
- 7.2.3. Android
- 7.1. Market Analysis, Insights and Forecast - by Application
- 8. Europe Customer Experience Platforms Analysis, Insights and Forecast, 2019-2031
- 8.1. Market Analysis, Insights and Forecast - by Application
- 8.1.1. BFSI
- 8.1.2. IT & Telecom
- 8.1.3. Healthcare
- 8.1.4. Hospitality
- 8.1.5. Consumer Goods & Retail
- 8.1.6. Media and Entertainment
- 8.1.7. Others
- 8.2. Market Analysis, Insights and Forecast - by Types
- 8.2.1. Windows
- 8.2.2. iOS
- 8.2.3. Android
- 8.1. Market Analysis, Insights and Forecast - by Application
- 9. Middle East & Africa Customer Experience Platforms Analysis, Insights and Forecast, 2019-2031
- 9.1. Market Analysis, Insights and Forecast - by Application
- 9.1.1. BFSI
- 9.1.2. IT & Telecom
- 9.1.3. Healthcare
- 9.1.4. Hospitality
- 9.1.5. Consumer Goods & Retail
- 9.1.6. Media and Entertainment
- 9.1.7. Others
- 9.2. Market Analysis, Insights and Forecast - by Types
- 9.2.1. Windows
- 9.2.2. iOS
- 9.2.3. Android
- 9.1. Market Analysis, Insights and Forecast - by Application
- 10. Asia Pacific Customer Experience Platforms Analysis, Insights and Forecast, 2019-2031
- 10.1. Market Analysis, Insights and Forecast - by Application
- 10.1.1. BFSI
- 10.1.2. IT & Telecom
- 10.1.3. Healthcare
- 10.1.4. Hospitality
- 10.1.5. Consumer Goods & Retail
- 10.1.6. Media and Entertainment
- 10.1.7. Others
- 10.2. Market Analysis, Insights and Forecast - by Types
- 10.2.1. Windows
- 10.2.2. iOS
- 10.2.3. Android
- 10.1. Market Analysis, Insights and Forecast - by Application
- 11. Competitive Analysis
- 11.1. Global Market Share Analysis 2024
- 11.2. Company Profiles
- 11.2.1 IBM Corporation
- 11.2.1.1. Overview
- 11.2.1.2. Products
- 11.2.1.3. SWOT Analysis
- 11.2.1.4. Recent Developments
- 11.2.1.5. Financials (Based on Availability)
- 11.2.2 Zendesk
- 11.2.2.1. Overview
- 11.2.2.2. Products
- 11.2.2.3. SWOT Analysis
- 11.2.2.4. Recent Developments
- 11.2.2.5. Financials (Based on Availability)
- 11.2.3 SAS Institute
- 11.2.3.1. Overview
- 11.2.3.2. Products
- 11.2.3.3. SWOT Analysis
- 11.2.3.4. Recent Developments
- 11.2.3.5. Financials (Based on Availability)
- 11.2.4 Huawei Corporation
- 11.2.4.1. Overview
- 11.2.4.2. Products
- 11.2.4.3. SWOT Analysis
- 11.2.4.4. Recent Developments
- 11.2.4.5. Financials (Based on Availability)
- 11.2.5 Oracle Corporation
- 11.2.5.1. Overview
- 11.2.5.2. Products
- 11.2.5.3. SWOT Analysis
- 11.2.5.4. Recent Developments
- 11.2.5.5. Financials (Based on Availability)
- 11.2.6 Qualtrics
- 11.2.6.1. Overview
- 11.2.6.2. Products
- 11.2.6.3. SWOT Analysis
- 11.2.6.4. Recent Developments
- 11.2.6.5. Financials (Based on Availability)
- 11.2.7 Cisco Systems
- 11.2.7.1. Overview
- 11.2.7.2. Products
- 11.2.7.3. SWOT Analysis
- 11.2.7.4. Recent Developments
- 11.2.7.5. Financials (Based on Availability)
- 11.2.8 OpenText Corporation
- 11.2.8.1. Overview
- 11.2.8.2. Products
- 11.2.8.3. SWOT Analysis
- 11.2.8.4. Recent Developments
- 11.2.8.5. Financials (Based on Availability)
- 11.2.9 Tech Mahindra
- 11.2.9.1. Overview
- 11.2.9.2. Products
- 11.2.9.3. SWOT Analysis
- 11.2.9.4. Recent Developments
- 11.2.9.5. Financials (Based on Availability)
- 11.2.10 TCS
- 11.2.10.1. Overview
- 11.2.10.2. Products
- 11.2.10.3. SWOT Analysis
- 11.2.10.4. Recent Developments
- 11.2.10.5. Financials (Based on Availability)
- 11.2.11 Adobe Systems Incorporated
- 11.2.11.1. Overview
- 11.2.11.2. Products
- 11.2.11.3. SWOT Analysis
- 11.2.11.4. Recent Developments
- 11.2.11.5. Financials (Based on Availability)
- 11.2.12 Software AG
- 11.2.12.1. Overview
- 11.2.12.2. Products
- 11.2.12.3. SWOT Analysis
- 11.2.12.4. Recent Developments
- 11.2.12.5. Financials (Based on Availability)
- 11.2.13 Avaya
- 11.2.13.1. Overview
- 11.2.13.2. Products
- 11.2.13.3. SWOT Analysis
- 11.2.13.4. Recent Developments
- 11.2.13.5. Financials (Based on Availability)
- 11.2.1 IBM Corporation
List of Figures
- Figure 1: Global Customer Experience Platforms Revenue Breakdown (million, %) by Region 2024 & 2032
- Figure 2: North America Customer Experience Platforms Revenue (million), by Application 2024 & 2032
- Figure 3: North America Customer Experience Platforms Revenue Share (%), by Application 2024 & 2032
- Figure 4: North America Customer Experience Platforms Revenue (million), by Types 2024 & 2032
- Figure 5: North America Customer Experience Platforms Revenue Share (%), by Types 2024 & 2032
- Figure 6: North America Customer Experience Platforms Revenue (million), by Country 2024 & 2032
- Figure 7: North America Customer Experience Platforms Revenue Share (%), by Country 2024 & 2032
- Figure 8: South America Customer Experience Platforms Revenue (million), by Application 2024 & 2032
- Figure 9: South America Customer Experience Platforms Revenue Share (%), by Application 2024 & 2032
- Figure 10: South America Customer Experience Platforms Revenue (million), by Types 2024 & 2032
- Figure 11: South America Customer Experience Platforms Revenue Share (%), by Types 2024 & 2032
- Figure 12: South America Customer Experience Platforms Revenue (million), by Country 2024 & 2032
- Figure 13: South America Customer Experience Platforms Revenue Share (%), by Country 2024 & 2032
- Figure 14: Europe Customer Experience Platforms Revenue (million), by Application 2024 & 2032
- Figure 15: Europe Customer Experience Platforms Revenue Share (%), by Application 2024 & 2032
- Figure 16: Europe Customer Experience Platforms Revenue (million), by Types 2024 & 2032
- Figure 17: Europe Customer Experience Platforms Revenue Share (%), by Types 2024 & 2032
- Figure 18: Europe Customer Experience Platforms Revenue (million), by Country 2024 & 2032
- Figure 19: Europe Customer Experience Platforms Revenue Share (%), by Country 2024 & 2032
- Figure 20: Middle East & Africa Customer Experience Platforms Revenue (million), by Application 2024 & 2032
- Figure 21: Middle East & Africa Customer Experience Platforms Revenue Share (%), by Application 2024 & 2032
- Figure 22: Middle East & Africa Customer Experience Platforms Revenue (million), by Types 2024 & 2032
- Figure 23: Middle East & Africa Customer Experience Platforms Revenue Share (%), by Types 2024 & 2032
- Figure 24: Middle East & Africa Customer Experience Platforms Revenue (million), by Country 2024 & 2032
- Figure 25: Middle East & Africa Customer Experience Platforms Revenue Share (%), by Country 2024 & 2032
- Figure 26: Asia Pacific Customer Experience Platforms Revenue (million), by Application 2024 & 2032
- Figure 27: Asia Pacific Customer Experience Platforms Revenue Share (%), by Application 2024 & 2032
- Figure 28: Asia Pacific Customer Experience Platforms Revenue (million), by Types 2024 & 2032
- Figure 29: Asia Pacific Customer Experience Platforms Revenue Share (%), by Types 2024 & 2032
- Figure 30: Asia Pacific Customer Experience Platforms Revenue (million), by Country 2024 & 2032
- Figure 31: Asia Pacific Customer Experience Platforms Revenue Share (%), by Country 2024 & 2032
List of Tables
- Table 1: Global Customer Experience Platforms Revenue million Forecast, by Region 2019 & 2032
- Table 2: Global Customer Experience Platforms Revenue million Forecast, by Application 2019 & 2032
- Table 3: Global Customer Experience Platforms Revenue million Forecast, by Types 2019 & 2032
- Table 4: Global Customer Experience Platforms Revenue million Forecast, by Region 2019 & 2032
- Table 5: Global Customer Experience Platforms Revenue million Forecast, by Application 2019 & 2032
- Table 6: Global Customer Experience Platforms Revenue million Forecast, by Types 2019 & 2032
- Table 7: Global Customer Experience Platforms Revenue million Forecast, by Country 2019 & 2032
- Table 8: United States Customer Experience Platforms Revenue (million) Forecast, by Application 2019 & 2032
- Table 9: Canada Customer Experience Platforms Revenue (million) Forecast, by Application 2019 & 2032
- Table 10: Mexico Customer Experience Platforms Revenue (million) Forecast, by Application 2019 & 2032
- Table 11: Global Customer Experience Platforms Revenue million Forecast, by Application 2019 & 2032
- Table 12: Global Customer Experience Platforms Revenue million Forecast, by Types 2019 & 2032
- Table 13: Global Customer Experience Platforms Revenue million Forecast, by Country 2019 & 2032
- Table 14: Brazil Customer Experience Platforms Revenue (million) Forecast, by Application 2019 & 2032
- Table 15: Argentina Customer Experience Platforms Revenue (million) Forecast, by Application 2019 & 2032
- Table 16: Rest of South America Customer Experience Platforms Revenue (million) Forecast, by Application 2019 & 2032
- Table 17: Global Customer Experience Platforms Revenue million Forecast, by Application 2019 & 2032
- Table 18: Global Customer Experience Platforms Revenue million Forecast, by Types 2019 & 2032
- Table 19: Global Customer Experience Platforms Revenue million Forecast, by Country 2019 & 2032
- Table 20: United Kingdom Customer Experience Platforms Revenue (million) Forecast, by Application 2019 & 2032
- Table 21: Germany Customer Experience Platforms Revenue (million) Forecast, by Application 2019 & 2032
- Table 22: France Customer Experience Platforms Revenue (million) Forecast, by Application 2019 & 2032
- Table 23: Italy Customer Experience Platforms Revenue (million) Forecast, by Application 2019 & 2032
- Table 24: Spain Customer Experience Platforms Revenue (million) Forecast, by Application 2019 & 2032
- Table 25: Russia Customer Experience Platforms Revenue (million) Forecast, by Application 2019 & 2032
- Table 26: Benelux Customer Experience Platforms Revenue (million) Forecast, by Application 2019 & 2032
- Table 27: Nordics Customer Experience Platforms Revenue (million) Forecast, by Application 2019 & 2032
- Table 28: Rest of Europe Customer Experience Platforms Revenue (million) Forecast, by Application 2019 & 2032
- Table 29: Global Customer Experience Platforms Revenue million Forecast, by Application 2019 & 2032
- Table 30: Global Customer Experience Platforms Revenue million Forecast, by Types 2019 & 2032
- Table 31: Global Customer Experience Platforms Revenue million Forecast, by Country 2019 & 2032
- Table 32: Turkey Customer Experience Platforms Revenue (million) Forecast, by Application 2019 & 2032
- Table 33: Israel Customer Experience Platforms Revenue (million) Forecast, by Application 2019 & 2032
- Table 34: GCC Customer Experience Platforms Revenue (million) Forecast, by Application 2019 & 2032
- Table 35: North Africa Customer Experience Platforms Revenue (million) Forecast, by Application 2019 & 2032
- Table 36: South Africa Customer Experience Platforms Revenue (million) Forecast, by Application 2019 & 2032
- Table 37: Rest of Middle East & Africa Customer Experience Platforms Revenue (million) Forecast, by Application 2019 & 2032
- Table 38: Global Customer Experience Platforms Revenue million Forecast, by Application 2019 & 2032
- Table 39: Global Customer Experience Platforms Revenue million Forecast, by Types 2019 & 2032
- Table 40: Global Customer Experience Platforms Revenue million Forecast, by Country 2019 & 2032
- Table 41: China Customer Experience Platforms Revenue (million) Forecast, by Application 2019 & 2032
- Table 42: India Customer Experience Platforms Revenue (million) Forecast, by Application 2019 & 2032
- Table 43: Japan Customer Experience Platforms Revenue (million) Forecast, by Application 2019 & 2032
- Table 44: South Korea Customer Experience Platforms Revenue (million) Forecast, by Application 2019 & 2032
- Table 45: ASEAN Customer Experience Platforms Revenue (million) Forecast, by Application 2019 & 2032
- Table 46: Oceania Customer Experience Platforms Revenue (million) Forecast, by Application 2019 & 2032
- Table 47: Rest of Asia Pacific Customer Experience Platforms Revenue (million) Forecast, by Application 2019 & 2032
Frequently Asked Questions
1. What is the projected Compound Annual Growth Rate (CAGR) of the Customer Experience Platforms?
The projected CAGR is approximately XX%.
2. Which companies are prominent players in the Customer Experience Platforms?
Key companies in the market include IBM Corporation, Zendesk, SAS Institute, Huawei Corporation, Oracle Corporation, Qualtrics, Cisco Systems, OpenText Corporation, Tech Mahindra, TCS, Adobe Systems Incorporated, Software AG, Avaya.
3. What are the main segments of the Customer Experience Platforms?
The market segments include Application, Types.
4. Can you provide details about the market size?
The market size is estimated to be USD XXX million as of 2022.
5. What are some drivers contributing to market growth?
N/A
6. What are the notable trends driving market growth?
N/A
7. Are there any restraints impacting market growth?
N/A
8. Can you provide examples of recent developments in the market?
N/A
9. What pricing options are available for accessing the report?
Pricing options include single-user, multi-user, and enterprise licenses priced at USD 3350.00, USD 5025.00, and USD 6700.00 respectively.
10. Is the market size provided in terms of value or volume?
The market size is provided in terms of value, measured in million.
11. Are there any specific market keywords associated with the report?
Yes, the market keyword associated with the report is "Customer Experience Platforms," which aids in identifying and referencing the specific market segment covered.
12. How do I determine which pricing option suits my needs best?
The pricing options vary based on user requirements and access needs. Individual users may opt for single-user licenses, while businesses requiring broader access may choose multi-user or enterprise licenses for cost-effective access to the report.
13. Are there any additional resources or data provided in the Customer Experience Platforms report?
While the report offers comprehensive insights, it's advisable to review the specific contents or supplementary materials provided to ascertain if additional resources or data are available.
14. How can I stay updated on further developments or reports in the Customer Experience Platforms?
To stay informed about further developments, trends, and reports in the Customer Experience Platforms, consider subscribing to industry newsletters, following relevant companies and organizations, or regularly checking reputable industry news sources and publications.
Methodology
Step 1 - Identification of Relevant Samples Size from Population Database


Step 2 - Approaches for Defining Global Market Size (Value, Volume* & Price*)

Note*: In applicable scenarios
Step 3 - Data Sources
Primary Research
- Web Analytics
- Survey Reports
- Research Institute
- Latest Research Reports
- Opinion Leaders
Secondary Research
- Annual Reports
- White Paper
- Latest Press Release
- Industry Association
- Paid Database
- Investor Presentations

Step 4 - Data Triangulation
Involves using different sources of information in order to increase the validity of a study
These sources are likely to be stakeholders in a program - participants, other researchers, program staff, other community members, and so on.
Then we put all data in single framework & apply various statistical tools to find out the dynamic on the market.
During the analysis stage, feedback from the stakeholder groups would be compared to determine areas of agreement as well as areas of divergence


