
Key Insights
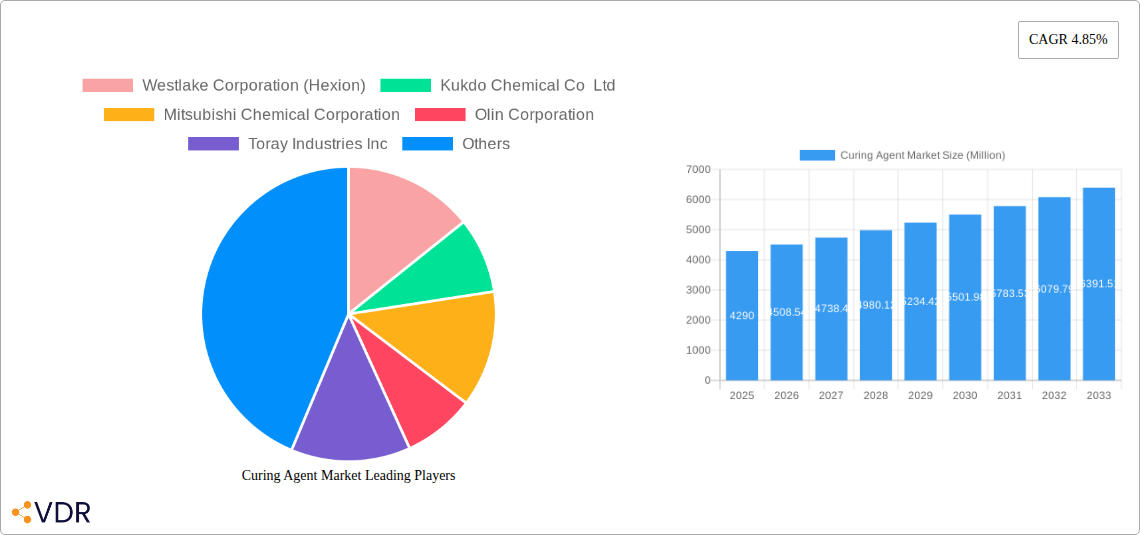
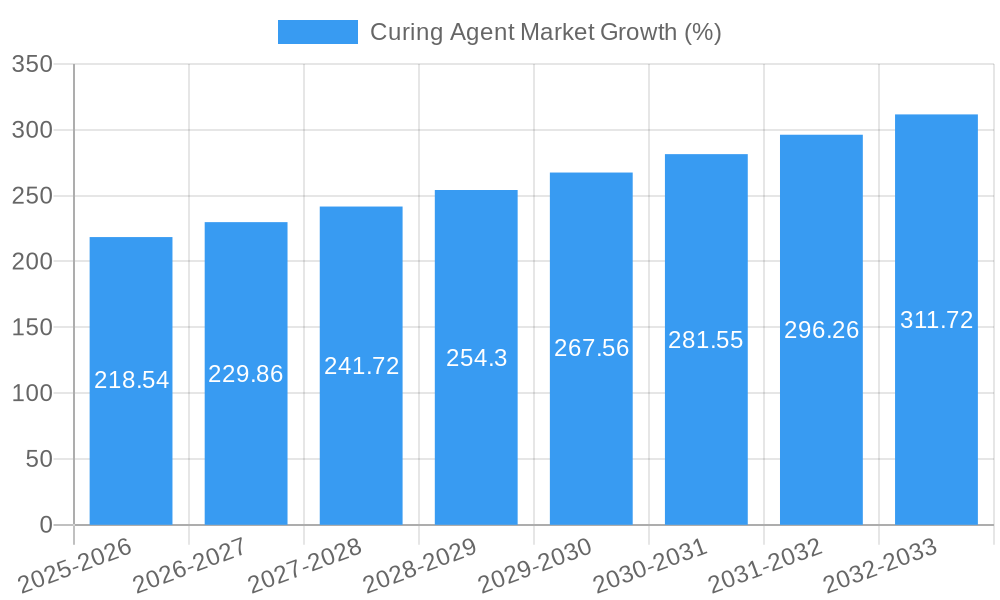
The global curing agent market, valued at $4.29 billion in 2025, is projected to experience robust growth, driven by a Compound Annual Growth Rate (CAGR) of 4.85% from 2025 to 2033. This expansion is fueled by several key factors. The burgeoning construction industry, particularly in developing economies across Asia-Pacific, significantly boosts demand for curing agents in composites, paints and coatings, and adhesives & sealants. Technological advancements leading to the development of high-performance, eco-friendly curing agents further stimulate market growth. The increasing adoption of advanced materials in various sectors, including automotive, aerospace, and electronics, necessitates the use of specialized curing agents with improved properties like enhanced durability, thermal stability, and chemical resistance. Furthermore, stringent environmental regulations are pushing the industry towards the development and adoption of less volatile organic compound (VOC)-emitting curing agents, creating new opportunities for manufacturers. However, price fluctuations in raw materials and potential supply chain disruptions represent key market restraints.
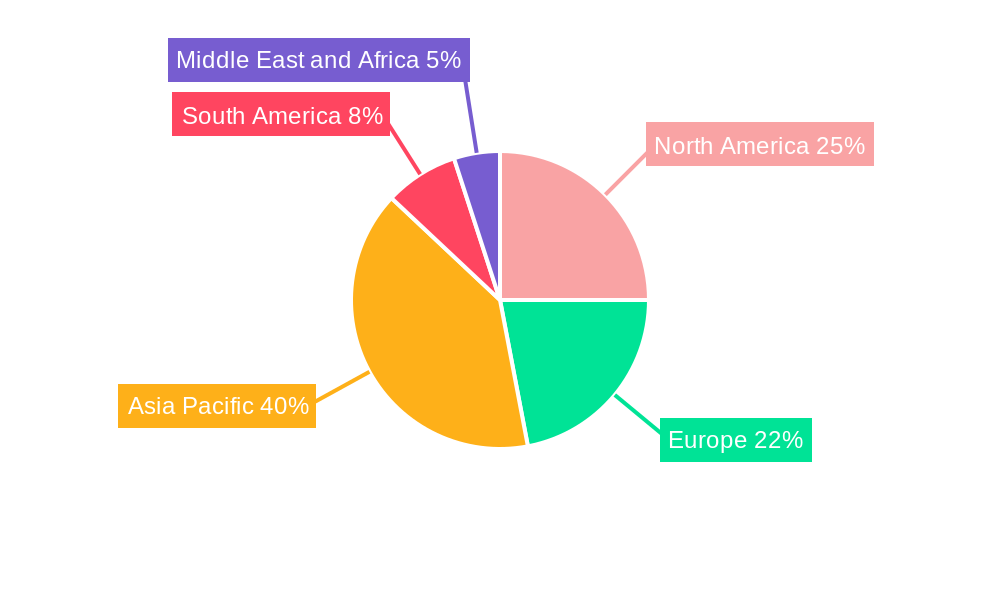
The market segmentation reveals a diverse landscape. Among types, amines and polyamides dominate, reflecting their widespread use in various applications. In terms of application, composites and paints & coatings hold the largest market shares, driven by the strong demand from the construction and automotive sectors respectively. Geographically, Asia-Pacific is projected to lead the market, primarily due to rapid industrialization and infrastructure development in countries like China and India. North America and Europe also represent significant markets, driven by the established presence of major industry players and high demand for advanced materials. The competitive landscape is characterized by both established multinational corporations and regional players, with ongoing innovation and strategic partnerships shaping the market dynamics. Companies are increasingly focusing on developing specialized curing agents to cater to the specific requirements of diverse industries, further fueling market growth and diversification.
Curing Agent Market: A Comprehensive Market Report (2019-2033)
This comprehensive report provides an in-depth analysis of the global Curing Agent market, encompassing market dynamics, growth trends, regional dominance, product landscape, key players, and future outlook. The study period covers 2019-2033, with 2025 as the base year and a forecast period of 2025-2033. The report segments the market by Type (Amines, Polyamides, Anhydrides, Other Types (Amidoamine, Phenalkamine)) and Application (Composites, Paints and Coatings, Adhesives and Sealants, Electrical and Electronics, Other Applications (Repairs)), offering a granular view of this vital chemical industry segment. The total market value is predicted to reach xx Million by 2033.
Curing Agent Market Market Dynamics & Structure
The Curing Agent market is characterized by a moderately concentrated structure, with several major players holding significant market share. Technological innovation, particularly in developing high-performance, sustainable, and cost-effective curing agents, is a key driver. Stringent environmental regulations are impacting product formulations and manufacturing processes. The market also faces competition from alternative materials and technologies. Mergers and acquisitions (M&A) activity has been notable, reflecting consolidation and expansion strategies.
- Market Concentration: The top 5 players hold approximately xx% of the global market share in 2025.
- Technological Innovation: R&D efforts focus on improving curing speed, enhancing thermal and chemical resistance, and reducing environmental impact.
- Regulatory Framework: Compliance with VOC and other environmental regulations influences product development and market growth.
- Competitive Substitutes: Bio-based curing agents and other alternative materials pose a competitive challenge.
- End-User Demographics: Growth is driven by increasing demand from the construction, automotive, and electronics sectors.
- M&A Trends: The acquisition of Hexion Inc.'s epoxy business by Westlake Chemical Corporation in 2022 illustrates the consolidation trend. An estimated xx M&A deals occurred within the parent Epoxy Resin market between 2019 and 2024.
Curing Agent Market Growth Trends & Insights
The global Curing Agent market experienced significant growth during the historical period (2019-2024), driven by increasing demand from various end-use industries. The market size is estimated at xx Million in 2025 and is projected to register a CAGR of xx% during the forecast period (2025-2033). This growth is attributed to factors such as rising infrastructure development, expanding automotive and electronics sectors, and the increasing adoption of advanced composite materials. Technological advancements in curing agent formulations, leading to improved performance characteristics and reduced environmental impact, are further accelerating market growth. Consumer preference for durable and high-performance products is driving the demand for advanced curing agents. Market penetration is expected to increase significantly in developing economies.
Dominant Regions, Countries, or Segments in Curing Agent Market
North America and Asia Pacific are currently the leading regions in the Curing Agent market, driven by robust industrial growth and high demand for advanced materials. Within these regions, China and the United States are major contributors, respectively. The Amines segment holds the largest market share by type due to its versatility and cost-effectiveness. The Composites application segment is also a major growth driver, fueled by increasing demand for lightweight and high-strength materials in aerospace, automotive, and wind energy applications.
- Key Drivers in North America: Strong industrial base, technological advancements, and stringent environmental regulations.
- Key Drivers in Asia Pacific: Rapid infrastructure development, rising automotive production, and growing electronics sector.
- Amines Segment Dominance: Cost-effectiveness, versatility, and wide range of applications contribute to its market leadership.
- Composites Application Growth: High demand for lightweight and high-strength materials in various industries.
Curing Agent Market Product Landscape
The Curing Agent market offers a diverse range of products tailored to specific applications. Innovation focuses on developing eco-friendly, high-performance curing agents with improved properties such as faster curing times, enhanced durability, and better adhesion. Manufacturers are emphasizing unique selling propositions (USPs) such as reduced VOC emissions, improved thermal stability, and enhanced UV resistance. Technological advancements include the development of novel chemistries and the incorporation of nanomaterials to further enhance performance.
Key Drivers, Barriers & Challenges in Curing Agent Market
Key Drivers:
- Increasing demand from the construction, automotive, and electronics industries.
- Technological advancements leading to improved performance and reduced environmental impact.
- Growing adoption of advanced composite materials.
Challenges & Restraints:
- Fluctuations in raw material prices.
- Stringent environmental regulations and compliance costs.
- Intense competition from established and emerging players. This leads to a xx% price reduction pressure annually, impacting overall profitability.
Emerging Opportunities in Curing Agent Market
Emerging opportunities lie in the development of bio-based and sustainable curing agents, catering to the growing demand for environmentally friendly materials. Untapped markets in developing economies offer significant growth potential. Innovation in specialized applications, such as 3D printing and advanced coatings, will further drive market expansion. The increasing focus on sustainable practices presents opportunities for eco-friendly product development.
Growth Accelerators in the Curing Agent Market Industry
Long-term growth will be fueled by technological breakthroughs in curing agent formulations, strategic partnerships to expand market reach, and the development of innovative applications in emerging industries. Government initiatives promoting sustainable materials and infrastructure development will provide further impetus. Market expansion into untapped regions and diversification into new application areas will be crucial for long-term growth.
Key Players Shaping the Curing Agent Market Market
- Westlake Corporation (Hexion)
- Kukdo Chemical Co Ltd
- Mitsubishi Chemical Corporation
- Olin Corporation
- Toray Industries Inc
- Evonik Industries AG
- BASF SE
- Huntsman International LLC
- Cardolite Corporation
- Atul Ltd
- Shandong Deyuan Epoxy Resin Co Ltd
- Epoxy Division Aditya Birla Chemicals (Thailand) Limited (Aditya Birla Group)
- Kumho P&B Chemicals Inc
- Epochemie - Epoxy Curing Agents
Notable Milestones in Curing Agent Market Sector
- June 2022: BASF SE expands production capacity for highly efficient curing agents.
- February 2022: Westlake Chemical Corporation acquires Hexion Inc.'s global epoxy business for USD 1.2 billion.
In-Depth Curing Agent Market Market Outlook
The future of the Curing Agent market looks promising, driven by sustained growth in end-use industries and ongoing technological innovation. Strategic partnerships, investments in R&D, and expansion into new geographical markets will be key to capturing future opportunities. The focus on sustainable and high-performance materials will shape the product landscape and drive long-term growth. The market is expected to witness further consolidation through M&A activity.
Curing Agent Market Segmentation
-
1. Type
- 1.1. Amines
- 1.2. Polyamides
- 1.3. Anhydrides
- 1.4. Other Types (Amidoamine, Phenalkamine )
-
2. Application
- 2.1. Composites
- 2.2. Paints and Coatings
- 2.3. Adhesives and Sealants
- 2.4. Electrical and Electronics
- 2.5. Other Applications (Repairs)
Curing Agent Market Segmentation By Geography
-
1. Asia Pacific
- 1.1. China
- 1.2. India
- 1.3. Japan
- 1.4. South Korea
- 1.5. Rest of Asia Pacific
-
2. North America
- 2.1. United States
- 2.2. Canada
- 2.3. Mexico
-
3. Europe
- 3.1. Germany
- 3.2. United Kingdom
- 3.3. Italy
- 3.4. France
- 3.5. Rest of Europe
-
4. South America
- 4.1. Brazil
- 4.2. Argentina
- 4.3. Rest of South America
-
5. Middle East and Africa
- 5.1. Saudi Arabia
- 5.2. South Africa
- 5.3. UAE
- 5.4. Rest of Middle East and Africa
Curing Agent Market REPORT HIGHLIGHTS
| Aspects | Details |
|---|---|
| Study Period | 2019-2033 |
| Base Year | 2024 |
| Estimated Year | 2025 |
| Forecast Period | 2025-2033 |
| Historical Period | 2019-2024 |
| Growth Rate | CAGR of 4.85% from 2019-2033 |
| Segmentation |
|
Table of Contents
- 1. Introduction
- 1.1. Research Scope
- 1.2. Market Segmentation
- 1.3. Research Methodology
- 1.4. Definitions and Assumptions
- 2. Executive Summary
- 2.1. Introduction
- 3. Market Dynamics
- 3.1. Introduction
- 3.2. Market Drivers
- 3.2.1. Increasing Demand from the Building and Construction Industry; New Developments in Lightweight Composite Materials; Growing Demand for Epoxy Curing Agents in the Electronics Industry
- 3.3. Market Restrains
- 3.3.1. Environmental Regulations on Amine-based Curing Agents; Other Restraints
- 3.4. Market Trends
- 3.4.1. Increasing Demand from the Paints and Coatings Industry
- 4. Market Factor Analysis
- 4.1. Porters Five Forces
- 4.2. Supply/Value Chain
- 4.3. PESTEL analysis
- 4.4. Market Entropy
- 4.5. Patent/Trademark Analysis
- 5. Global Curing Agent Market Analysis, Insights and Forecast, 2019-2031
- 5.1. Market Analysis, Insights and Forecast - by Type
- 5.1.1. Amines
- 5.1.2. Polyamides
- 5.1.3. Anhydrides
- 5.1.4. Other Types (Amidoamine, Phenalkamine )
- 5.2. Market Analysis, Insights and Forecast - by Application
- 5.2.1. Composites
- 5.2.2. Paints and Coatings
- 5.2.3. Adhesives and Sealants
- 5.2.4. Electrical and Electronics
- 5.2.5. Other Applications (Repairs)
- 5.3. Market Analysis, Insights and Forecast - by Region
- 5.3.1. Asia Pacific
- 5.3.2. North America
- 5.3.3. Europe
- 5.3.4. South America
- 5.3.5. Middle East and Africa
- 5.1. Market Analysis, Insights and Forecast - by Type
- 6. Asia Pacific Curing Agent Market Analysis, Insights and Forecast, 2019-2031
- 6.1. Market Analysis, Insights and Forecast - by Type
- 6.1.1. Amines
- 6.1.2. Polyamides
- 6.1.3. Anhydrides
- 6.1.4. Other Types (Amidoamine, Phenalkamine )
- 6.2. Market Analysis, Insights and Forecast - by Application
- 6.2.1. Composites
- 6.2.2. Paints and Coatings
- 6.2.3. Adhesives and Sealants
- 6.2.4. Electrical and Electronics
- 6.2.5. Other Applications (Repairs)
- 6.1. Market Analysis, Insights and Forecast - by Type
- 7. North America Curing Agent Market Analysis, Insights and Forecast, 2019-2031
- 7.1. Market Analysis, Insights and Forecast - by Type
- 7.1.1. Amines
- 7.1.2. Polyamides
- 7.1.3. Anhydrides
- 7.1.4. Other Types (Amidoamine, Phenalkamine )
- 7.2. Market Analysis, Insights and Forecast - by Application
- 7.2.1. Composites
- 7.2.2. Paints and Coatings
- 7.2.3. Adhesives and Sealants
- 7.2.4. Electrical and Electronics
- 7.2.5. Other Applications (Repairs)
- 7.1. Market Analysis, Insights and Forecast - by Type
- 8. Europe Curing Agent Market Analysis, Insights and Forecast, 2019-2031
- 8.1. Market Analysis, Insights and Forecast - by Type
- 8.1.1. Amines
- 8.1.2. Polyamides
- 8.1.3. Anhydrides
- 8.1.4. Other Types (Amidoamine, Phenalkamine )
- 8.2. Market Analysis, Insights and Forecast - by Application
- 8.2.1. Composites
- 8.2.2. Paints and Coatings
- 8.2.3. Adhesives and Sealants
- 8.2.4. Electrical and Electronics
- 8.2.5. Other Applications (Repairs)
- 8.1. Market Analysis, Insights and Forecast - by Type
- 9. South America Curing Agent Market Analysis, Insights and Forecast, 2019-2031
- 9.1. Market Analysis, Insights and Forecast - by Type
- 9.1.1. Amines
- 9.1.2. Polyamides
- 9.1.3. Anhydrides
- 9.1.4. Other Types (Amidoamine, Phenalkamine )
- 9.2. Market Analysis, Insights and Forecast - by Application
- 9.2.1. Composites
- 9.2.2. Paints and Coatings
- 9.2.3. Adhesives and Sealants
- 9.2.4. Electrical and Electronics
- 9.2.5. Other Applications (Repairs)
- 9.1. Market Analysis, Insights and Forecast - by Type
- 10. Middle East and Africa Curing Agent Market Analysis, Insights and Forecast, 2019-2031
- 10.1. Market Analysis, Insights and Forecast - by Type
- 10.1.1. Amines
- 10.1.2. Polyamides
- 10.1.3. Anhydrides
- 10.1.4. Other Types (Amidoamine, Phenalkamine )
- 10.2. Market Analysis, Insights and Forecast - by Application
- 10.2.1. Composites
- 10.2.2. Paints and Coatings
- 10.2.3. Adhesives and Sealants
- 10.2.4. Electrical and Electronics
- 10.2.5. Other Applications (Repairs)
- 10.1. Market Analysis, Insights and Forecast - by Type
- 11. Asia Pacific Curing Agent Market Analysis, Insights and Forecast, 2019-2031
- 11.1. Market Analysis, Insights and Forecast - By Country/Sub-region
- 11.1.1 China
- 11.1.2 India
- 11.1.3 Japan
- 11.1.4 South Korea
- 11.1.5 Rest of Asia Pacific
- 12. North America Curing Agent Market Analysis, Insights and Forecast, 2019-2031
- 12.1. Market Analysis, Insights and Forecast - By Country/Sub-region
- 12.1.1 United States
- 12.1.2 Canada
- 12.1.3 Mexico
- 13. Europe Curing Agent Market Analysis, Insights and Forecast, 2019-2031
- 13.1. Market Analysis, Insights and Forecast - By Country/Sub-region
- 13.1.1 Germany
- 13.1.2 United Kingdom
- 13.1.3 Italy
- 13.1.4 France
- 13.1.5 Rest of Europe
- 14. South America Curing Agent Market Analysis, Insights and Forecast, 2019-2031
- 14.1. Market Analysis, Insights and Forecast - By Country/Sub-region
- 14.1.1 Brazil
- 14.1.2 Argentina
- 14.1.3 Rest of South America
- 15. Middle East and Africa Curing Agent Market Analysis, Insights and Forecast, 2019-2031
- 15.1. Market Analysis, Insights and Forecast - By Country/Sub-region
- 15.1.1 Saudi Arabia
- 15.1.2 South Africa
- 15.1.3 Rest of Middle East and Africa
- 16. Competitive Analysis
- 16.1. Global Market Share Analysis 2024
- 16.2. Company Profiles
- 16.2.1 Westlake Corporation (Hexion)
- 16.2.1.1. Overview
- 16.2.1.2. Products
- 16.2.1.3. SWOT Analysis
- 16.2.1.4. Recent Developments
- 16.2.1.5. Financials (Based on Availability)
- 16.2.2 Kukdo Chemical Co Ltd
- 16.2.2.1. Overview
- 16.2.2.2. Products
- 16.2.2.3. SWOT Analysis
- 16.2.2.4. Recent Developments
- 16.2.2.5. Financials (Based on Availability)
- 16.2.3 Mitsubishi Chemical Corporation
- 16.2.3.1. Overview
- 16.2.3.2. Products
- 16.2.3.3. SWOT Analysis
- 16.2.3.4. Recent Developments
- 16.2.3.5. Financials (Based on Availability)
- 16.2.4 Olin Corporation
- 16.2.4.1. Overview
- 16.2.4.2. Products
- 16.2.4.3. SWOT Analysis
- 16.2.4.4. Recent Developments
- 16.2.4.5. Financials (Based on Availability)
- 16.2.5 Toray Industries Inc
- 16.2.5.1. Overview
- 16.2.5.2. Products
- 16.2.5.3. SWOT Analysis
- 16.2.5.4. Recent Developments
- 16.2.5.5. Financials (Based on Availability)
- 16.2.6 Evonik Industries AG
- 16.2.6.1. Overview
- 16.2.6.2. Products
- 16.2.6.3. SWOT Analysis
- 16.2.6.4. Recent Developments
- 16.2.6.5. Financials (Based on Availability)
- 16.2.7 BASF SE
- 16.2.7.1. Overview
- 16.2.7.2. Products
- 16.2.7.3. SWOT Analysis
- 16.2.7.4. Recent Developments
- 16.2.7.5. Financials (Based on Availability)
- 16.2.8 Huntsman International LLC
- 16.2.8.1. Overview
- 16.2.8.2. Products
- 16.2.8.3. SWOT Analysis
- 16.2.8.4. Recent Developments
- 16.2.8.5. Financials (Based on Availability)
- 16.2.9 Cardolite Corporation
- 16.2.9.1. Overview
- 16.2.9.2. Products
- 16.2.9.3. SWOT Analysis
- 16.2.9.4. Recent Developments
- 16.2.9.5. Financials (Based on Availability)
- 16.2.10 Atul Ltd
- 16.2.10.1. Overview
- 16.2.10.2. Products
- 16.2.10.3. SWOT Analysis
- 16.2.10.4. Recent Developments
- 16.2.10.5. Financials (Based on Availability)
- 16.2.11 Shandong Deyuan Epoxy Resin Co Ltd
- 16.2.11.1. Overview
- 16.2.11.2. Products
- 16.2.11.3. SWOT Analysis
- 16.2.11.4. Recent Developments
- 16.2.11.5. Financials (Based on Availability)
- 16.2.12 Epoxy Division Aditya Birla Chemicals (Thailand) Limited (Aditya Birla Group)
- 16.2.12.1. Overview
- 16.2.12.2. Products
- 16.2.12.3. SWOT Analysis
- 16.2.12.4. Recent Developments
- 16.2.12.5. Financials (Based on Availability)
- 16.2.13 Kumho P&B Chemicals Inc
- 16.2.13.1. Overview
- 16.2.13.2. Products
- 16.2.13.3. SWOT Analysis
- 16.2.13.4. Recent Developments
- 16.2.13.5. Financials (Based on Availability)
- 16.2.14 Epochemie - Epoxy Curing Agents
- 16.2.14.1. Overview
- 16.2.14.2. Products
- 16.2.14.3. SWOT Analysis
- 16.2.14.4. Recent Developments
- 16.2.14.5. Financials (Based on Availability)
- 16.2.1 Westlake Corporation (Hexion)
List of Figures
- Figure 1: Global Curing Agent Market Revenue Breakdown (Million, %) by Region 2024 & 2032
- Figure 2: Global Curing Agent Market Volume Breakdown (K Tons, %) by Region 2024 & 2032
- Figure 3: Asia Pacific Curing Agent Market Revenue (Million), by Country 2024 & 2032
- Figure 4: Asia Pacific Curing Agent Market Volume (K Tons), by Country 2024 & 2032
- Figure 5: Asia Pacific Curing Agent Market Revenue Share (%), by Country 2024 & 2032
- Figure 6: Asia Pacific Curing Agent Market Volume Share (%), by Country 2024 & 2032
- Figure 7: North America Curing Agent Market Revenue (Million), by Country 2024 & 2032
- Figure 8: North America Curing Agent Market Volume (K Tons), by Country 2024 & 2032
- Figure 9: North America Curing Agent Market Revenue Share (%), by Country 2024 & 2032
- Figure 10: North America Curing Agent Market Volume Share (%), by Country 2024 & 2032
- Figure 11: Europe Curing Agent Market Revenue (Million), by Country 2024 & 2032
- Figure 12: Europe Curing Agent Market Volume (K Tons), by Country 2024 & 2032
- Figure 13: Europe Curing Agent Market Revenue Share (%), by Country 2024 & 2032
- Figure 14: Europe Curing Agent Market Volume Share (%), by Country 2024 & 2032
- Figure 15: South America Curing Agent Market Revenue (Million), by Country 2024 & 2032
- Figure 16: South America Curing Agent Market Volume (K Tons), by Country 2024 & 2032
- Figure 17: South America Curing Agent Market Revenue Share (%), by Country 2024 & 2032
- Figure 18: South America Curing Agent Market Volume Share (%), by Country 2024 & 2032
- Figure 19: Middle East and Africa Curing Agent Market Revenue (Million), by Country 2024 & 2032
- Figure 20: Middle East and Africa Curing Agent Market Volume (K Tons), by Country 2024 & 2032
- Figure 21: Middle East and Africa Curing Agent Market Revenue Share (%), by Country 2024 & 2032
- Figure 22: Middle East and Africa Curing Agent Market Volume Share (%), by Country 2024 & 2032
- Figure 23: Asia Pacific Curing Agent Market Revenue (Million), by Type 2024 & 2032
- Figure 24: Asia Pacific Curing Agent Market Volume (K Tons), by Type 2024 & 2032
- Figure 25: Asia Pacific Curing Agent Market Revenue Share (%), by Type 2024 & 2032
- Figure 26: Asia Pacific Curing Agent Market Volume Share (%), by Type 2024 & 2032
- Figure 27: Asia Pacific Curing Agent Market Revenue (Million), by Application 2024 & 2032
- Figure 28: Asia Pacific Curing Agent Market Volume (K Tons), by Application 2024 & 2032
- Figure 29: Asia Pacific Curing Agent Market Revenue Share (%), by Application 2024 & 2032
- Figure 30: Asia Pacific Curing Agent Market Volume Share (%), by Application 2024 & 2032
- Figure 31: Asia Pacific Curing Agent Market Revenue (Million), by Country 2024 & 2032
- Figure 32: Asia Pacific Curing Agent Market Volume (K Tons), by Country 2024 & 2032
- Figure 33: Asia Pacific Curing Agent Market Revenue Share (%), by Country 2024 & 2032
- Figure 34: Asia Pacific Curing Agent Market Volume Share (%), by Country 2024 & 2032
- Figure 35: North America Curing Agent Market Revenue (Million), by Type 2024 & 2032
- Figure 36: North America Curing Agent Market Volume (K Tons), by Type 2024 & 2032
- Figure 37: North America Curing Agent Market Revenue Share (%), by Type 2024 & 2032
- Figure 38: North America Curing Agent Market Volume Share (%), by Type 2024 & 2032
- Figure 39: North America Curing Agent Market Revenue (Million), by Application 2024 & 2032
- Figure 40: North America Curing Agent Market Volume (K Tons), by Application 2024 & 2032
- Figure 41: North America Curing Agent Market Revenue Share (%), by Application 2024 & 2032
- Figure 42: North America Curing Agent Market Volume Share (%), by Application 2024 & 2032
- Figure 43: North America Curing Agent Market Revenue (Million), by Country 2024 & 2032
- Figure 44: North America Curing Agent Market Volume (K Tons), by Country 2024 & 2032
- Figure 45: North America Curing Agent Market Revenue Share (%), by Country 2024 & 2032
- Figure 46: North America Curing Agent Market Volume Share (%), by Country 2024 & 2032
- Figure 47: Europe Curing Agent Market Revenue (Million), by Type 2024 & 2032
- Figure 48: Europe Curing Agent Market Volume (K Tons), by Type 2024 & 2032
- Figure 49: Europe Curing Agent Market Revenue Share (%), by Type 2024 & 2032
- Figure 50: Europe Curing Agent Market Volume Share (%), by Type 2024 & 2032
- Figure 51: Europe Curing Agent Market Revenue (Million), by Application 2024 & 2032
- Figure 52: Europe Curing Agent Market Volume (K Tons), by Application 2024 & 2032
- Figure 53: Europe Curing Agent Market Revenue Share (%), by Application 2024 & 2032
- Figure 54: Europe Curing Agent Market Volume Share (%), by Application 2024 & 2032
- Figure 55: Europe Curing Agent Market Revenue (Million), by Country 2024 & 2032
- Figure 56: Europe Curing Agent Market Volume (K Tons), by Country 2024 & 2032
- Figure 57: Europe Curing Agent Market Revenue Share (%), by Country 2024 & 2032
- Figure 58: Europe Curing Agent Market Volume Share (%), by Country 2024 & 2032
- Figure 59: South America Curing Agent Market Revenue (Million), by Type 2024 & 2032
- Figure 60: South America Curing Agent Market Volume (K Tons), by Type 2024 & 2032
- Figure 61: South America Curing Agent Market Revenue Share (%), by Type 2024 & 2032
- Figure 62: South America Curing Agent Market Volume Share (%), by Type 2024 & 2032
- Figure 63: South America Curing Agent Market Revenue (Million), by Application 2024 & 2032
- Figure 64: South America Curing Agent Market Volume (K Tons), by Application 2024 & 2032
- Figure 65: South America Curing Agent Market Revenue Share (%), by Application 2024 & 2032
- Figure 66: South America Curing Agent Market Volume Share (%), by Application 2024 & 2032
- Figure 67: South America Curing Agent Market Revenue (Million), by Country 2024 & 2032
- Figure 68: South America Curing Agent Market Volume (K Tons), by Country 2024 & 2032
- Figure 69: South America Curing Agent Market Revenue Share (%), by Country 2024 & 2032
- Figure 70: South America Curing Agent Market Volume Share (%), by Country 2024 & 2032
- Figure 71: Middle East and Africa Curing Agent Market Revenue (Million), by Type 2024 & 2032
- Figure 72: Middle East and Africa Curing Agent Market Volume (K Tons), by Type 2024 & 2032
- Figure 73: Middle East and Africa Curing Agent Market Revenue Share (%), by Type 2024 & 2032
- Figure 74: Middle East and Africa Curing Agent Market Volume Share (%), by Type 2024 & 2032
- Figure 75: Middle East and Africa Curing Agent Market Revenue (Million), by Application 2024 & 2032
- Figure 76: Middle East and Africa Curing Agent Market Volume (K Tons), by Application 2024 & 2032
- Figure 77: Middle East and Africa Curing Agent Market Revenue Share (%), by Application 2024 & 2032
- Figure 78: Middle East and Africa Curing Agent Market Volume Share (%), by Application 2024 & 2032
- Figure 79: Middle East and Africa Curing Agent Market Revenue (Million), by Country 2024 & 2032
- Figure 80: Middle East and Africa Curing Agent Market Volume (K Tons), by Country 2024 & 2032
- Figure 81: Middle East and Africa Curing Agent Market Revenue Share (%), by Country 2024 & 2032
- Figure 82: Middle East and Africa Curing Agent Market Volume Share (%), by Country 2024 & 2032
List of Tables
- Table 1: Global Curing Agent Market Revenue Million Forecast, by Region 2019 & 2032
- Table 2: Global Curing Agent Market Volume K Tons Forecast, by Region 2019 & 2032
- Table 3: Global Curing Agent Market Revenue Million Forecast, by Type 2019 & 2032
- Table 4: Global Curing Agent Market Volume K Tons Forecast, by Type 2019 & 2032
- Table 5: Global Curing Agent Market Revenue Million Forecast, by Application 2019 & 2032
- Table 6: Global Curing Agent Market Volume K Tons Forecast, by Application 2019 & 2032
- Table 7: Global Curing Agent Market Revenue Million Forecast, by Region 2019 & 2032
- Table 8: Global Curing Agent Market Volume K Tons Forecast, by Region 2019 & 2032
- Table 9: Global Curing Agent Market Revenue Million Forecast, by Country 2019 & 2032
- Table 10: Global Curing Agent Market Volume K Tons Forecast, by Country 2019 & 2032
- Table 11: China Curing Agent Market Revenue (Million) Forecast, by Application 2019 & 2032
- Table 12: China Curing Agent Market Volume (K Tons) Forecast, by Application 2019 & 2032
- Table 13: India Curing Agent Market Revenue (Million) Forecast, by Application 2019 & 2032
- Table 14: India Curing Agent Market Volume (K Tons) Forecast, by Application 2019 & 2032
- Table 15: Japan Curing Agent Market Revenue (Million) Forecast, by Application 2019 & 2032
- Table 16: Japan Curing Agent Market Volume (K Tons) Forecast, by Application 2019 & 2032
- Table 17: South Korea Curing Agent Market Revenue (Million) Forecast, by Application 2019 & 2032
- Table 18: South Korea Curing Agent Market Volume (K Tons) Forecast, by Application 2019 & 2032
- Table 19: Rest of Asia Pacific Curing Agent Market Revenue (Million) Forecast, by Application 2019 & 2032
- Table 20: Rest of Asia Pacific Curing Agent Market Volume (K Tons) Forecast, by Application 2019 & 2032
- Table 21: Global Curing Agent Market Revenue Million Forecast, by Country 2019 & 2032
- Table 22: Global Curing Agent Market Volume K Tons Forecast, by Country 2019 & 2032
- Table 23: United States Curing Agent Market Revenue (Million) Forecast, by Application 2019 & 2032
- Table 24: United States Curing Agent Market Volume (K Tons) Forecast, by Application 2019 & 2032
- Table 25: Canada Curing Agent Market Revenue (Million) Forecast, by Application 2019 & 2032
- Table 26: Canada Curing Agent Market Volume (K Tons) Forecast, by Application 2019 & 2032
- Table 27: Mexico Curing Agent Market Revenue (Million) Forecast, by Application 2019 & 2032
- Table 28: Mexico Curing Agent Market Volume (K Tons) Forecast, by Application 2019 & 2032
- Table 29: Global Curing Agent Market Revenue Million Forecast, by Country 2019 & 2032
- Table 30: Global Curing Agent Market Volume K Tons Forecast, by Country 2019 & 2032
- Table 31: Germany Curing Agent Market Revenue (Million) Forecast, by Application 2019 & 2032
- Table 32: Germany Curing Agent Market Volume (K Tons) Forecast, by Application 2019 & 2032
- Table 33: United Kingdom Curing Agent Market Revenue (Million) Forecast, by Application 2019 & 2032
- Table 34: United Kingdom Curing Agent Market Volume (K Tons) Forecast, by Application 2019 & 2032
- Table 35: Italy Curing Agent Market Revenue (Million) Forecast, by Application 2019 & 2032
- Table 36: Italy Curing Agent Market Volume (K Tons) Forecast, by Application 2019 & 2032
- Table 37: France Curing Agent Market Revenue (Million) Forecast, by Application 2019 & 2032
- Table 38: France Curing Agent Market Volume (K Tons) Forecast, by Application 2019 & 2032
- Table 39: Rest of Europe Curing Agent Market Revenue (Million) Forecast, by Application 2019 & 2032
- Table 40: Rest of Europe Curing Agent Market Volume (K Tons) Forecast, by Application 2019 & 2032
- Table 41: Global Curing Agent Market Revenue Million Forecast, by Country 2019 & 2032
- Table 42: Global Curing Agent Market Volume K Tons Forecast, by Country 2019 & 2032
- Table 43: Brazil Curing Agent Market Revenue (Million) Forecast, by Application 2019 & 2032
- Table 44: Brazil Curing Agent Market Volume (K Tons) Forecast, by Application 2019 & 2032
- Table 45: Argentina Curing Agent Market Revenue (Million) Forecast, by Application 2019 & 2032
- Table 46: Argentina Curing Agent Market Volume (K Tons) Forecast, by Application 2019 & 2032
- Table 47: Rest of South America Curing Agent Market Revenue (Million) Forecast, by Application 2019 & 2032
- Table 48: Rest of South America Curing Agent Market Volume (K Tons) Forecast, by Application 2019 & 2032
- Table 49: Global Curing Agent Market Revenue Million Forecast, by Country 2019 & 2032
- Table 50: Global Curing Agent Market Volume K Tons Forecast, by Country 2019 & 2032
- Table 51: Saudi Arabia Curing Agent Market Revenue (Million) Forecast, by Application 2019 & 2032
- Table 52: Saudi Arabia Curing Agent Market Volume (K Tons) Forecast, by Application 2019 & 2032
- Table 53: South Africa Curing Agent Market Revenue (Million) Forecast, by Application 2019 & 2032
- Table 54: South Africa Curing Agent Market Volume (K Tons) Forecast, by Application 2019 & 2032
- Table 55: Rest of Middle East and Africa Curing Agent Market Revenue (Million) Forecast, by Application 2019 & 2032
- Table 56: Rest of Middle East and Africa Curing Agent Market Volume (K Tons) Forecast, by Application 2019 & 2032
- Table 57: Global Curing Agent Market Revenue Million Forecast, by Type 2019 & 2032
- Table 58: Global Curing Agent Market Volume K Tons Forecast, by Type 2019 & 2032
- Table 59: Global Curing Agent Market Revenue Million Forecast, by Application 2019 & 2032
- Table 60: Global Curing Agent Market Volume K Tons Forecast, by Application 2019 & 2032
- Table 61: Global Curing Agent Market Revenue Million Forecast, by Country 2019 & 2032
- Table 62: Global Curing Agent Market Volume K Tons Forecast, by Country 2019 & 2032
- Table 63: China Curing Agent Market Revenue (Million) Forecast, by Application 2019 & 2032
- Table 64: China Curing Agent Market Volume (K Tons) Forecast, by Application 2019 & 2032
- Table 65: India Curing Agent Market Revenue (Million) Forecast, by Application 2019 & 2032
- Table 66: India Curing Agent Market Volume (K Tons) Forecast, by Application 2019 & 2032
- Table 67: Japan Curing Agent Market Revenue (Million) Forecast, by Application 2019 & 2032
- Table 68: Japan Curing Agent Market Volume (K Tons) Forecast, by Application 2019 & 2032
- Table 69: South Korea Curing Agent Market Revenue (Million) Forecast, by Application 2019 & 2032
- Table 70: South Korea Curing Agent Market Volume (K Tons) Forecast, by Application 2019 & 2032
- Table 71: Rest of Asia Pacific Curing Agent Market Revenue (Million) Forecast, by Application 2019 & 2032
- Table 72: Rest of Asia Pacific Curing Agent Market Volume (K Tons) Forecast, by Application 2019 & 2032
- Table 73: Global Curing Agent Market Revenue Million Forecast, by Type 2019 & 2032
- Table 74: Global Curing Agent Market Volume K Tons Forecast, by Type 2019 & 2032
- Table 75: Global Curing Agent Market Revenue Million Forecast, by Application 2019 & 2032
- Table 76: Global Curing Agent Market Volume K Tons Forecast, by Application 2019 & 2032
- Table 77: Global Curing Agent Market Revenue Million Forecast, by Country 2019 & 2032
- Table 78: Global Curing Agent Market Volume K Tons Forecast, by Country 2019 & 2032
- Table 79: United States Curing Agent Market Revenue (Million) Forecast, by Application 2019 & 2032
- Table 80: United States Curing Agent Market Volume (K Tons) Forecast, by Application 2019 & 2032
- Table 81: Canada Curing Agent Market Revenue (Million) Forecast, by Application 2019 & 2032
- Table 82: Canada Curing Agent Market Volume (K Tons) Forecast, by Application 2019 & 2032
- Table 83: Mexico Curing Agent Market Revenue (Million) Forecast, by Application 2019 & 2032
- Table 84: Mexico Curing Agent Market Volume (K Tons) Forecast, by Application 2019 & 2032
- Table 85: Global Curing Agent Market Revenue Million Forecast, by Type 2019 & 2032
- Table 86: Global Curing Agent Market Volume K Tons Forecast, by Type 2019 & 2032
- Table 87: Global Curing Agent Market Revenue Million Forecast, by Application 2019 & 2032
- Table 88: Global Curing Agent Market Volume K Tons Forecast, by Application 2019 & 2032
- Table 89: Global Curing Agent Market Revenue Million Forecast, by Country 2019 & 2032
- Table 90: Global Curing Agent Market Volume K Tons Forecast, by Country 2019 & 2032
- Table 91: Germany Curing Agent Market Revenue (Million) Forecast, by Application 2019 & 2032
- Table 92: Germany Curing Agent Market Volume (K Tons) Forecast, by Application 2019 & 2032
- Table 93: United Kingdom Curing Agent Market Revenue (Million) Forecast, by Application 2019 & 2032
- Table 94: United Kingdom Curing Agent Market Volume (K Tons) Forecast, by Application 2019 & 2032
- Table 95: Italy Curing Agent Market Revenue (Million) Forecast, by Application 2019 & 2032
- Table 96: Italy Curing Agent Market Volume (K Tons) Forecast, by Application 2019 & 2032
- Table 97: France Curing Agent Market Revenue (Million) Forecast, by Application 2019 & 2032
- Table 98: France Curing Agent Market Volume (K Tons) Forecast, by Application 2019 & 2032
- Table 99: Rest of Europe Curing Agent Market Revenue (Million) Forecast, by Application 2019 & 2032
- Table 100: Rest of Europe Curing Agent Market Volume (K Tons) Forecast, by Application 2019 & 2032
- Table 101: Global Curing Agent Market Revenue Million Forecast, by Type 2019 & 2032
- Table 102: Global Curing Agent Market Volume K Tons Forecast, by Type 2019 & 2032
- Table 103: Global Curing Agent Market Revenue Million Forecast, by Application 2019 & 2032
- Table 104: Global Curing Agent Market Volume K Tons Forecast, by Application 2019 & 2032
- Table 105: Global Curing Agent Market Revenue Million Forecast, by Country 2019 & 2032
- Table 106: Global Curing Agent Market Volume K Tons Forecast, by Country 2019 & 2032
- Table 107: Brazil Curing Agent Market Revenue (Million) Forecast, by Application 2019 & 2032
- Table 108: Brazil Curing Agent Market Volume (K Tons) Forecast, by Application 2019 & 2032
- Table 109: Argentina Curing Agent Market Revenue (Million) Forecast, by Application 2019 & 2032
- Table 110: Argentina Curing Agent Market Volume (K Tons) Forecast, by Application 2019 & 2032
- Table 111: Rest of South America Curing Agent Market Revenue (Million) Forecast, by Application 2019 & 2032
- Table 112: Rest of South America Curing Agent Market Volume (K Tons) Forecast, by Application 2019 & 2032
- Table 113: Global Curing Agent Market Revenue Million Forecast, by Type 2019 & 2032
- Table 114: Global Curing Agent Market Volume K Tons Forecast, by Type 2019 & 2032
- Table 115: Global Curing Agent Market Revenue Million Forecast, by Application 2019 & 2032
- Table 116: Global Curing Agent Market Volume K Tons Forecast, by Application 2019 & 2032
- Table 117: Global Curing Agent Market Revenue Million Forecast, by Country 2019 & 2032
- Table 118: Global Curing Agent Market Volume K Tons Forecast, by Country 2019 & 2032
- Table 119: Saudi Arabia Curing Agent Market Revenue (Million) Forecast, by Application 2019 & 2032
- Table 120: Saudi Arabia Curing Agent Market Volume (K Tons) Forecast, by Application 2019 & 2032
- Table 121: South Africa Curing Agent Market Revenue (Million) Forecast, by Application 2019 & 2032
- Table 122: South Africa Curing Agent Market Volume (K Tons) Forecast, by Application 2019 & 2032
- Table 123: UAE Curing Agent Market Revenue (Million) Forecast, by Application 2019 & 2032
- Table 124: UAE Curing Agent Market Volume (K Tons) Forecast, by Application 2019 & 2032
- Table 125: Rest of Middle East and Africa Curing Agent Market Revenue (Million) Forecast, by Application 2019 & 2032
- Table 126: Rest of Middle East and Africa Curing Agent Market Volume (K Tons) Forecast, by Application 2019 & 2032
Frequently Asked Questions
1. What is the projected Compound Annual Growth Rate (CAGR) of the Curing Agent Market?
The projected CAGR is approximately 4.85%.
2. Which companies are prominent players in the Curing Agent Market?
Key companies in the market include Westlake Corporation (Hexion), Kukdo Chemical Co Ltd, Mitsubishi Chemical Corporation, Olin Corporation, Toray Industries Inc, Evonik Industries AG, BASF SE, Huntsman International LLC, Cardolite Corporation, Atul Ltd, Shandong Deyuan Epoxy Resin Co Ltd, Epoxy Division Aditya Birla Chemicals (Thailand) Limited (Aditya Birla Group), Kumho P&B Chemicals Inc, Epochemie - Epoxy Curing Agents.
3. What are the main segments of the Curing Agent Market?
The market segments include Type, Application.
4. Can you provide details about the market size?
The market size is estimated to be USD 4.29 Million as of 2022.
5. What are some drivers contributing to market growth?
Increasing Demand from the Building and Construction Industry; New Developments in Lightweight Composite Materials; Growing Demand for Epoxy Curing Agents in the Electronics Industry.
6. What are the notable trends driving market growth?
Increasing Demand from the Paints and Coatings Industry.
7. Are there any restraints impacting market growth?
Environmental Regulations on Amine-based Curing Agents; Other Restraints.
8. Can you provide examples of recent developments in the market?
June 2022: BASF SE increased the production capacity for its highly efficient curing agents and chain extenders in epoxy and polyurea applications for the wind, electrical, composites, adhesives, and flooring industries.
9. What pricing options are available for accessing the report?
Pricing options include single-user, multi-user, and enterprise licenses priced at USD 4750, USD 5250, and USD 8750 respectively.
10. Is the market size provided in terms of value or volume?
The market size is provided in terms of value, measured in Million and volume, measured in K Tons.
11. Are there any specific market keywords associated with the report?
Yes, the market keyword associated with the report is "Curing Agent Market," which aids in identifying and referencing the specific market segment covered.
12. How do I determine which pricing option suits my needs best?
The pricing options vary based on user requirements and access needs. Individual users may opt for single-user licenses, while businesses requiring broader access may choose multi-user or enterprise licenses for cost-effective access to the report.
13. Are there any additional resources or data provided in the Curing Agent Market report?
While the report offers comprehensive insights, it's advisable to review the specific contents or supplementary materials provided to ascertain if additional resources or data are available.
14. How can I stay updated on further developments or reports in the Curing Agent Market?
To stay informed about further developments, trends, and reports in the Curing Agent Market, consider subscribing to industry newsletters, following relevant companies and organizations, or regularly checking reputable industry news sources and publications.
Methodology
Step 1 - Identification of Relevant Samples Size from Population Database


Step 2 - Approaches for Defining Global Market Size (Value, Volume* & Price*)

Note*: In applicable scenarios
Step 3 - Data Sources
Primary Research
- Web Analytics
- Survey Reports
- Research Institute
- Latest Research Reports
- Opinion Leaders
Secondary Research
- Annual Reports
- White Paper
- Latest Press Release
- Industry Association
- Paid Database
- Investor Presentations

Step 4 - Data Triangulation
Involves using different sources of information in order to increase the validity of a study
These sources are likely to be stakeholders in a program - participants, other researchers, program staff, other community members, and so on.
Then we put all data in single framework & apply various statistical tools to find out the dynamic on the market.
During the analysis stage, feedback from the stakeholder groups would be compared to determine areas of agreement as well as areas of divergence


