
Key Insights
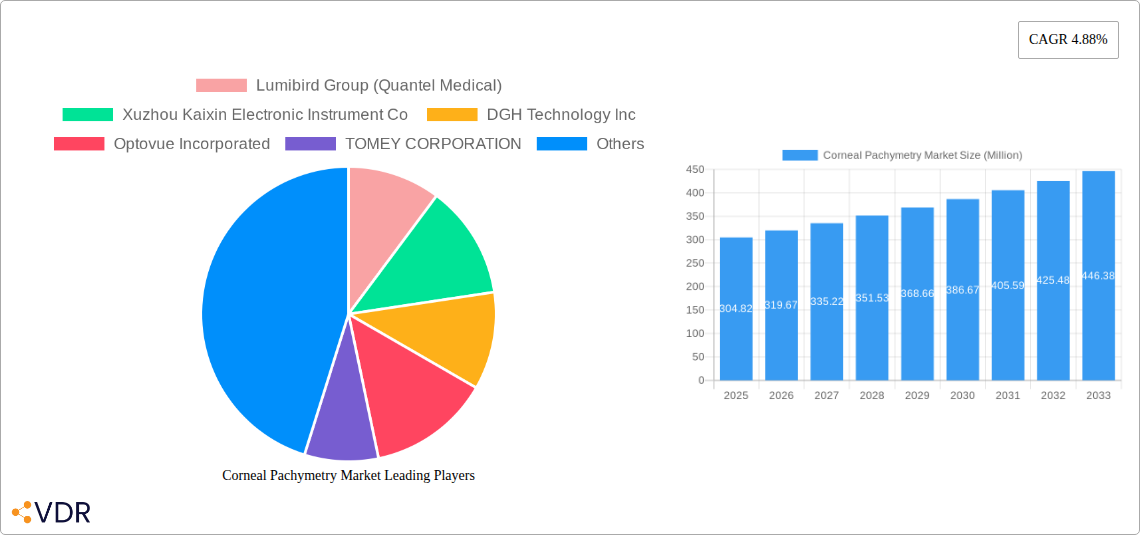
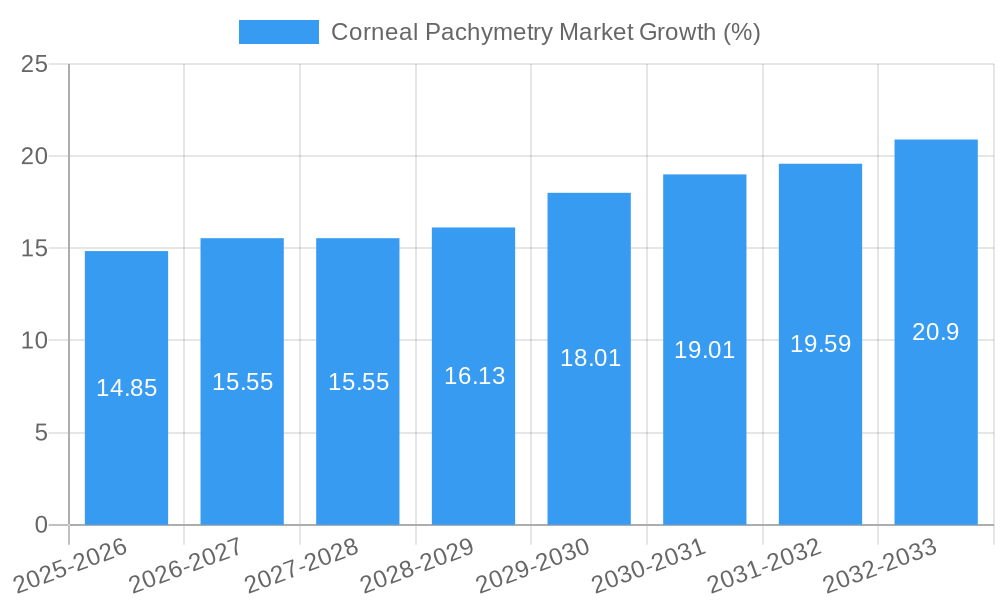
The global corneal pachymetry market, valued at $304.82 million in 2025, is projected to experience robust growth, driven by a rising prevalence of refractive errors and glaucoma, increasing demand for advanced diagnostic tools in ophthalmology, and technological advancements in corneal imaging techniques. The market's Compound Annual Growth Rate (CAGR) of 4.88% from 2025 to 2033 indicates a steady expansion, fueled by the adoption of non-invasive and precise ultrasonic and optical methods. The significant growth in refractive surgery procedures, particularly LASIK and SMILE, directly contributes to the increasing demand for accurate corneal thickness measurements. Furthermore, the growing geriatric population susceptible to glaucoma necessitates precise diagnostic tools like corneal pachymetry for effective disease management and treatment planning. Technological advancements, like the development of handheld and portable devices, are enhancing accessibility and affordability, further driving market penetration, particularly in emerging economies.
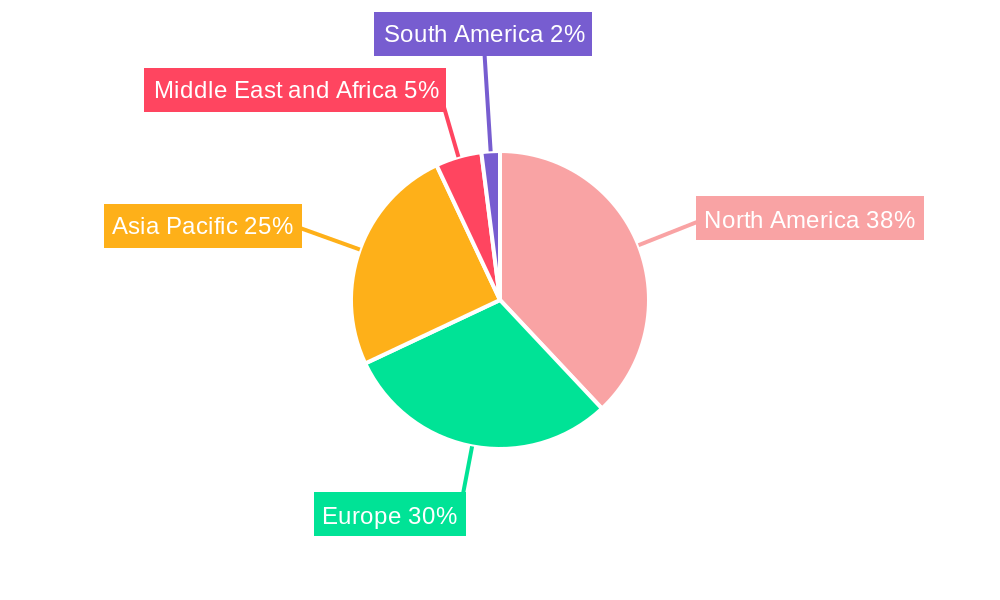
Segmentation analysis reveals a balanced distribution between ultrasonic and optical methods, with both technologies experiencing consistent growth. The refractive surgery application segment dominates the market, benefiting from the higher volume of procedures. However, glaucoma diagnostics contribute significantly to overall market growth as early and accurate diagnosis is crucial for effective treatment. Geographically, North America and Europe currently hold the largest market share due to advanced healthcare infrastructure and high adoption rates of sophisticated diagnostic technologies. However, Asia Pacific is expected to witness significant growth in the forecast period due to increasing awareness, rising disposable incomes, and expanding healthcare infrastructure. Competitive rivalry among key players, including Lumibird Group (Quantel Medical), Xuzhou Kaixin Electronic Instrument Co, and others, is fostering innovation and driving down costs, benefiting the overall market.
Corneal Pachymetry Market: A Comprehensive Report (2019-2033)
This in-depth report provides a comprehensive analysis of the Corneal Pachymetry market, encompassing market dynamics, growth trends, regional dominance, product landscape, key challenges and opportunities, and a detailed profile of leading market players. The report covers the period from 2019 to 2033, with a focus on the forecast period 2025-2033, using 2025 as the base year. The parent market is the ophthalmic diagnostic equipment market, while the child market is specifically corneal thickness measurement devices. The total market size in 2025 is estimated at xx Million.
Corneal Pachymetry Market Dynamics & Structure
The Corneal Pachymetry market is characterized by moderate concentration, with several key players holding significant market share. Technological innovation, particularly in optical methods and integration with other diagnostic tools, is a major driver. Regulatory frameworks concerning medical device approvals vary across geographies, impacting market entry and growth. Competitive pressures from substitute technologies are relatively low, given the specialized nature of corneal pachymetry. End-user demographics are primarily ophthalmologists and optometrists, with increasing demand from refractive surgery centers and glaucoma clinics. M&A activity in the ophthalmic device sector has been moderate, with xx deals recorded between 2019 and 2024, resulting in a xx% market share shift among top players.
- Market Concentration: Moderately concentrated, with top 5 players holding approximately xx% of market share in 2025.
- Technological Innovation: Focus on miniaturization, faster measurement times, and integration with other ophthalmic diagnostic systems.
- Regulatory Landscape: Stringent regulatory approvals (e.g., FDA, CE mark) create barriers to entry for new players.
- Competitive Substitutes: Limited viable substitutes, maintaining market stability.
- End-User Demographics: Primarily ophthalmologists, optometrists, and specialized clinics.
- M&A Activity: xx deals between 2019-2024, leading to market consolidation and changes in market share. Innovation barriers include high R&D costs and stringent regulatory hurdles.
Corneal Pachymetry Market Growth Trends & Insights
The Corneal Pachymetry market experienced a CAGR of xx% during the historical period (2019-2024), driven by the increasing prevalence of refractive errors and glaucoma, coupled with technological advancements. Market penetration is estimated at xx% in 2025, with significant growth potential in emerging markets. Adoption rates are particularly high in developed countries with advanced healthcare infrastructure and high prevalence of eye diseases. Technological disruptions, such as the introduction of optical pachymetry devices offering non-contact measurements, have further stimulated market growth. Consumer behavior is shifting towards preference for faster, more accurate, and less invasive technologies. The projected CAGR for 2025-2033 is xx%, indicating robust market expansion. The market size is projected to reach xx Million by 2033.
Dominant Regions, Countries, or Segments in Corneal Pachymetry Market
North America currently holds the largest market share, driven by high healthcare expenditure, a large number of ophthalmologists, and advanced healthcare infrastructure. Europe follows closely, exhibiting steady growth. Within the segment breakdown, the Ultrasonic Method continues to dominate due to its established presence and lower cost, although Optical Methods are experiencing faster growth. In terms of application, Refractive Surgery accounts for a larger market share, driven by the increasing popularity of refractive procedures such as LASIK. However, Glaucoma Diagnostics is a rapidly growing segment with significant future potential due to the rising prevalence of glaucoma.
- North America: High adoption rates due to developed healthcare infrastructure and high prevalence of eye diseases.
- Europe: Steady growth driven by increasing awareness of eye health and technological advancements.
- Ultrasonic Method: Established market share due to its lower cost and widespread availability.
- Optical Method: Faster growth due to advantages such as non-contact measurement and higher accuracy.
- Refractive Surgery: Largest market share due to the increasing popularity of refractive procedures.
- Glaucoma Diagnostics: Rapid growth driven by rising glaucoma prevalence and the need for accurate diagnosis.
Corneal Pachymetry Market Product Landscape
The corneal pachymetry market offers a range of devices, primarily categorized by measurement technique (ultrasonic and optical). Recent innovations focus on improving accuracy, reducing measurement time, and integrating the technology into comprehensive ophthalmic diagnostic platforms. Unique selling propositions include non-contact measurement (optical), portability, advanced data analysis features, and integration with electronic health records (EHRs). Technological advancements are focused on enhancing image quality, improving repeatability, and creating more user-friendly interfaces.
Key Drivers, Barriers & Challenges in Corneal Pachymetry Market
Key Drivers:
- Increasing prevalence of refractive errors and glaucoma.
- Technological advancements leading to improved accuracy and ease of use.
- Rising healthcare expenditure and improved access to healthcare.
Key Challenges:
- High cost of advanced pachymetry devices can limit accessibility in some markets.
- Stringent regulatory approvals increase time-to-market for new products.
- Competitive pressure from existing players and emerging technologies. Supply chain disruptions can impact device availability. The overall impact of these challenges is estimated to reduce market growth by approximately xx% during the forecast period.
Emerging Opportunities in Corneal Pachymetry Market
- Untapped potential in emerging markets with increasing healthcare infrastructure development.
- Integration with tele-ophthalmology platforms for remote diagnostics.
- Development of artificial intelligence (AI)-powered analysis tools for improved diagnostic accuracy.
Growth Accelerators in the Corneal Pachymetry Market Industry
Technological breakthroughs in optical pachymetry, coupled with strategic partnerships between device manufacturers and healthcare providers, are key growth accelerators. Expansion into emerging markets and increased integration with other ophthalmic diagnostic tools will further drive market growth. Strategic alliances to improve market penetration and product distribution channels are crucial for long-term success.
Key Players Shaping the Corneal Pachymetry Market Market
- Lumibird Group (Quantel Medical)
- Xuzhou Kaixin Electronic Instrument Co
- DGH Technology Inc
- Optovue Incorporated
- TOMEY CORPORATION
- Reichert Inc
- Carl Zeiss AG
- Sonomed Escalon
- Topcon Corporation
- NIDEK CO LTD
Notable Milestones in Corneal Pachymetry Market Sector
- December 2022: Entod Pharmaceuticals launched its GLO division for glaucoma treatment, expanding its ophthalmic presence.
- January 2023: Bausch + Lomb Corp. and the Glaucoma Research Foundation launched the "Screen, Protect, Cure" campaign to raise glaucoma awareness.
In-Depth Corneal Pachymetry Market Market Outlook
The future of the Corneal Pachymetry market is bright, driven by technological advancements, rising prevalence of eye diseases, and increased healthcare expenditure. Strategic opportunities exist for companies to focus on developing innovative products, expanding into untapped markets, and leveraging strategic partnerships. The market's potential for growth remains significant, with continued expansion expected throughout the forecast period, leading to a substantial increase in market size and value.
Corneal Pachymetry Market Segmentation
-
1. Type
- 1.1. Ultrasonic Method
- 1.2. Optical Method
-
2. Application
- 2.1. Refractive Surgery
- 2.2. Glaucoma Diagnostics
Corneal Pachymetry Market Segmentation By Geography
-
1. North America
- 1.1. United States
- 1.2. Canada
- 1.3. Mexico
-
2. Europe
- 2.1. Germany
- 2.2. United Kingdom
- 2.3. France
- 2.4. Italy
- 2.5. Spain
- 2.6. Rest of Europe
-
3. Asia Pacific
- 3.1. China
- 3.2. Japan
- 3.3. India
- 3.4. Australia
- 3.5. South Korea
- 3.6. Rest of Asia Pacific
-
4. Middle East and Africa
- 4.1. GCC
- 4.2. South Africa
- 4.3. Rest of Middle East and Africa
-
5. South America
- 5.1. Brazil
- 5.2. Argentina
- 5.3. Rest of South America
Corneal Pachymetry Market REPORT HIGHLIGHTS
| Aspects | Details |
|---|---|
| Study Period | 2019-2033 |
| Base Year | 2024 |
| Estimated Year | 2025 |
| Forecast Period | 2025-2033 |
| Historical Period | 2019-2024 |
| Growth Rate | CAGR of 4.88% from 2019-2033 |
| Segmentation |
|
Table of Contents
- 1. Introduction
- 1.1. Research Scope
- 1.2. Market Segmentation
- 1.3. Research Methodology
- 1.4. Definitions and Assumptions
- 2. Executive Summary
- 2.1. Introduction
- 3. Market Dynamics
- 3.1. Introduction
- 3.2. Market Drivers
- 3.2.1. Rise in Prevalence of Glaucoma and Eye-related Disorders; Rise in Prevalence of Diabetic Retinopathy
- 3.3. Market Restrains
- 3.3.1. Inadequate Reimbursement Coverage for Pachymetry; Stringent Government Regulations
- 3.4. Market Trends
- 3.4.1. Glaucoma Diagnostics Segment Expects to Register a Significant CAGR Over the Forecast Period
- 4. Market Factor Analysis
- 4.1. Porters Five Forces
- 4.2. Supply/Value Chain
- 4.3. PESTEL analysis
- 4.4. Market Entropy
- 4.5. Patent/Trademark Analysis
- 5. Global Corneal Pachymetry Market Analysis, Insights and Forecast, 2019-2031
- 5.1. Market Analysis, Insights and Forecast - by Type
- 5.1.1. Ultrasonic Method
- 5.1.2. Optical Method
- 5.2. Market Analysis, Insights and Forecast - by Application
- 5.2.1. Refractive Surgery
- 5.2.2. Glaucoma Diagnostics
- 5.3. Market Analysis, Insights and Forecast - by Region
- 5.3.1. North America
- 5.3.2. Europe
- 5.3.3. Asia Pacific
- 5.3.4. Middle East and Africa
- 5.3.5. South America
- 5.1. Market Analysis, Insights and Forecast - by Type
- 6. North America Corneal Pachymetry Market Analysis, Insights and Forecast, 2019-2031
- 6.1. Market Analysis, Insights and Forecast - by Type
- 6.1.1. Ultrasonic Method
- 6.1.2. Optical Method
- 6.2. Market Analysis, Insights and Forecast - by Application
- 6.2.1. Refractive Surgery
- 6.2.2. Glaucoma Diagnostics
- 6.1. Market Analysis, Insights and Forecast - by Type
- 7. Europe Corneal Pachymetry Market Analysis, Insights and Forecast, 2019-2031
- 7.1. Market Analysis, Insights and Forecast - by Type
- 7.1.1. Ultrasonic Method
- 7.1.2. Optical Method
- 7.2. Market Analysis, Insights and Forecast - by Application
- 7.2.1. Refractive Surgery
- 7.2.2. Glaucoma Diagnostics
- 7.1. Market Analysis, Insights and Forecast - by Type
- 8. Asia Pacific Corneal Pachymetry Market Analysis, Insights and Forecast, 2019-2031
- 8.1. Market Analysis, Insights and Forecast - by Type
- 8.1.1. Ultrasonic Method
- 8.1.2. Optical Method
- 8.2. Market Analysis, Insights and Forecast - by Application
- 8.2.1. Refractive Surgery
- 8.2.2. Glaucoma Diagnostics
- 8.1. Market Analysis, Insights and Forecast - by Type
- 9. Middle East and Africa Corneal Pachymetry Market Analysis, Insights and Forecast, 2019-2031
- 9.1. Market Analysis, Insights and Forecast - by Type
- 9.1.1. Ultrasonic Method
- 9.1.2. Optical Method
- 9.2. Market Analysis, Insights and Forecast - by Application
- 9.2.1. Refractive Surgery
- 9.2.2. Glaucoma Diagnostics
- 9.1. Market Analysis, Insights and Forecast - by Type
- 10. South America Corneal Pachymetry Market Analysis, Insights and Forecast, 2019-2031
- 10.1. Market Analysis, Insights and Forecast - by Type
- 10.1.1. Ultrasonic Method
- 10.1.2. Optical Method
- 10.2. Market Analysis, Insights and Forecast - by Application
- 10.2.1. Refractive Surgery
- 10.2.2. Glaucoma Diagnostics
- 10.1. Market Analysis, Insights and Forecast - by Type
- 11. North America Corneal Pachymetry Market Analysis, Insights and Forecast, 2019-2031
- 11.1. Market Analysis, Insights and Forecast - By Country/Sub-region
- 11.1.1 United States
- 11.1.2 Canada
- 11.1.3 Mexico
- 12. Europe Corneal Pachymetry Market Analysis, Insights and Forecast, 2019-2031
- 12.1. Market Analysis, Insights and Forecast - By Country/Sub-region
- 12.1.1 Germany
- 12.1.2 United Kingdom
- 12.1.3 France
- 12.1.4 Italy
- 12.1.5 Spain
- 12.1.6 Rest of Europe
- 13. Asia Pacific Corneal Pachymetry Market Analysis, Insights and Forecast, 2019-2031
- 13.1. Market Analysis, Insights and Forecast - By Country/Sub-region
- 13.1.1 China
- 13.1.2 Japan
- 13.1.3 India
- 13.1.4 Australia
- 13.1.5 South Korea
- 13.1.6 Rest of Asia Pacific
- 14. Middle East and Africa Corneal Pachymetry Market Analysis, Insights and Forecast, 2019-2031
- 14.1. Market Analysis, Insights and Forecast - By Country/Sub-region
- 14.1.1 GCC
- 14.1.2 South Africa
- 14.1.3 Rest of Middle East and Africa
- 15. South America Corneal Pachymetry Market Analysis, Insights and Forecast, 2019-2031
- 15.1. Market Analysis, Insights and Forecast - By Country/Sub-region
- 15.1.1 Brazil
- 15.1.2 Argentina
- 15.1.3 Rest of South America
- 16. Competitive Analysis
- 16.1. Global Market Share Analysis 2024
- 16.2. Company Profiles
- 16.2.1 Lumibird Group (Quantel Medical)
- 16.2.1.1. Overview
- 16.2.1.2. Products
- 16.2.1.3. SWOT Analysis
- 16.2.1.4. Recent Developments
- 16.2.1.5. Financials (Based on Availability)
- 16.2.2 Xuzhou Kaixin Electronic Instrument Co
- 16.2.2.1. Overview
- 16.2.2.2. Products
- 16.2.2.3. SWOT Analysis
- 16.2.2.4. Recent Developments
- 16.2.2.5. Financials (Based on Availability)
- 16.2.3 DGH Technology Inc
- 16.2.3.1. Overview
- 16.2.3.2. Products
- 16.2.3.3. SWOT Analysis
- 16.2.3.4. Recent Developments
- 16.2.3.5. Financials (Based on Availability)
- 16.2.4 Optovue Incorporated
- 16.2.4.1. Overview
- 16.2.4.2. Products
- 16.2.4.3. SWOT Analysis
- 16.2.4.4. Recent Developments
- 16.2.4.5. Financials (Based on Availability)
- 16.2.5 TOMEY CORPORATION
- 16.2.5.1. Overview
- 16.2.5.2. Products
- 16.2.5.3. SWOT Analysis
- 16.2.5.4. Recent Developments
- 16.2.5.5. Financials (Based on Availability)
- 16.2.6 Reichert Inc
- 16.2.6.1. Overview
- 16.2.6.2. Products
- 16.2.6.3. SWOT Analysis
- 16.2.6.4. Recent Developments
- 16.2.6.5. Financials (Based on Availability)
- 16.2.7 Carl Zeiss AG
- 16.2.7.1. Overview
- 16.2.7.2. Products
- 16.2.7.3. SWOT Analysis
- 16.2.7.4. Recent Developments
- 16.2.7.5. Financials (Based on Availability)
- 16.2.8 Sonomed Escalon
- 16.2.8.1. Overview
- 16.2.8.2. Products
- 16.2.8.3. SWOT Analysis
- 16.2.8.4. Recent Developments
- 16.2.8.5. Financials (Based on Availability)
- 16.2.9 Topcon Corporation
- 16.2.9.1. Overview
- 16.2.9.2. Products
- 16.2.9.3. SWOT Analysis
- 16.2.9.4. Recent Developments
- 16.2.9.5. Financials (Based on Availability)
- 16.2.10 NIDEK CO LTD
- 16.2.10.1. Overview
- 16.2.10.2. Products
- 16.2.10.3. SWOT Analysis
- 16.2.10.4. Recent Developments
- 16.2.10.5. Financials (Based on Availability)
- 16.2.1 Lumibird Group (Quantel Medical)
List of Figures
- Figure 1: Global Corneal Pachymetry Market Revenue Breakdown (Million, %) by Region 2024 & 2032
- Figure 2: Global Corneal Pachymetry Market Volume Breakdown (K Unit, %) by Region 2024 & 2032
- Figure 3: North America Corneal Pachymetry Market Revenue (Million), by Country 2024 & 2032
- Figure 4: North America Corneal Pachymetry Market Volume (K Unit), by Country 2024 & 2032
- Figure 5: North America Corneal Pachymetry Market Revenue Share (%), by Country 2024 & 2032
- Figure 6: North America Corneal Pachymetry Market Volume Share (%), by Country 2024 & 2032
- Figure 7: Europe Corneal Pachymetry Market Revenue (Million), by Country 2024 & 2032
- Figure 8: Europe Corneal Pachymetry Market Volume (K Unit), by Country 2024 & 2032
- Figure 9: Europe Corneal Pachymetry Market Revenue Share (%), by Country 2024 & 2032
- Figure 10: Europe Corneal Pachymetry Market Volume Share (%), by Country 2024 & 2032
- Figure 11: Asia Pacific Corneal Pachymetry Market Revenue (Million), by Country 2024 & 2032
- Figure 12: Asia Pacific Corneal Pachymetry Market Volume (K Unit), by Country 2024 & 2032
- Figure 13: Asia Pacific Corneal Pachymetry Market Revenue Share (%), by Country 2024 & 2032
- Figure 14: Asia Pacific Corneal Pachymetry Market Volume Share (%), by Country 2024 & 2032
- Figure 15: Middle East and Africa Corneal Pachymetry Market Revenue (Million), by Country 2024 & 2032
- Figure 16: Middle East and Africa Corneal Pachymetry Market Volume (K Unit), by Country 2024 & 2032
- Figure 17: Middle East and Africa Corneal Pachymetry Market Revenue Share (%), by Country 2024 & 2032
- Figure 18: Middle East and Africa Corneal Pachymetry Market Volume Share (%), by Country 2024 & 2032
- Figure 19: South America Corneal Pachymetry Market Revenue (Million), by Country 2024 & 2032
- Figure 20: South America Corneal Pachymetry Market Volume (K Unit), by Country 2024 & 2032
- Figure 21: South America Corneal Pachymetry Market Revenue Share (%), by Country 2024 & 2032
- Figure 22: South America Corneal Pachymetry Market Volume Share (%), by Country 2024 & 2032
- Figure 23: North America Corneal Pachymetry Market Revenue (Million), by Type 2024 & 2032
- Figure 24: North America Corneal Pachymetry Market Volume (K Unit), by Type 2024 & 2032
- Figure 25: North America Corneal Pachymetry Market Revenue Share (%), by Type 2024 & 2032
- Figure 26: North America Corneal Pachymetry Market Volume Share (%), by Type 2024 & 2032
- Figure 27: North America Corneal Pachymetry Market Revenue (Million), by Application 2024 & 2032
- Figure 28: North America Corneal Pachymetry Market Volume (K Unit), by Application 2024 & 2032
- Figure 29: North America Corneal Pachymetry Market Revenue Share (%), by Application 2024 & 2032
- Figure 30: North America Corneal Pachymetry Market Volume Share (%), by Application 2024 & 2032
- Figure 31: North America Corneal Pachymetry Market Revenue (Million), by Country 2024 & 2032
- Figure 32: North America Corneal Pachymetry Market Volume (K Unit), by Country 2024 & 2032
- Figure 33: North America Corneal Pachymetry Market Revenue Share (%), by Country 2024 & 2032
- Figure 34: North America Corneal Pachymetry Market Volume Share (%), by Country 2024 & 2032
- Figure 35: Europe Corneal Pachymetry Market Revenue (Million), by Type 2024 & 2032
- Figure 36: Europe Corneal Pachymetry Market Volume (K Unit), by Type 2024 & 2032
- Figure 37: Europe Corneal Pachymetry Market Revenue Share (%), by Type 2024 & 2032
- Figure 38: Europe Corneal Pachymetry Market Volume Share (%), by Type 2024 & 2032
- Figure 39: Europe Corneal Pachymetry Market Revenue (Million), by Application 2024 & 2032
- Figure 40: Europe Corneal Pachymetry Market Volume (K Unit), by Application 2024 & 2032
- Figure 41: Europe Corneal Pachymetry Market Revenue Share (%), by Application 2024 & 2032
- Figure 42: Europe Corneal Pachymetry Market Volume Share (%), by Application 2024 & 2032
- Figure 43: Europe Corneal Pachymetry Market Revenue (Million), by Country 2024 & 2032
- Figure 44: Europe Corneal Pachymetry Market Volume (K Unit), by Country 2024 & 2032
- Figure 45: Europe Corneal Pachymetry Market Revenue Share (%), by Country 2024 & 2032
- Figure 46: Europe Corneal Pachymetry Market Volume Share (%), by Country 2024 & 2032
- Figure 47: Asia Pacific Corneal Pachymetry Market Revenue (Million), by Type 2024 & 2032
- Figure 48: Asia Pacific Corneal Pachymetry Market Volume (K Unit), by Type 2024 & 2032
- Figure 49: Asia Pacific Corneal Pachymetry Market Revenue Share (%), by Type 2024 & 2032
- Figure 50: Asia Pacific Corneal Pachymetry Market Volume Share (%), by Type 2024 & 2032
- Figure 51: Asia Pacific Corneal Pachymetry Market Revenue (Million), by Application 2024 & 2032
- Figure 52: Asia Pacific Corneal Pachymetry Market Volume (K Unit), by Application 2024 & 2032
- Figure 53: Asia Pacific Corneal Pachymetry Market Revenue Share (%), by Application 2024 & 2032
- Figure 54: Asia Pacific Corneal Pachymetry Market Volume Share (%), by Application 2024 & 2032
- Figure 55: Asia Pacific Corneal Pachymetry Market Revenue (Million), by Country 2024 & 2032
- Figure 56: Asia Pacific Corneal Pachymetry Market Volume (K Unit), by Country 2024 & 2032
- Figure 57: Asia Pacific Corneal Pachymetry Market Revenue Share (%), by Country 2024 & 2032
- Figure 58: Asia Pacific Corneal Pachymetry Market Volume Share (%), by Country 2024 & 2032
- Figure 59: Middle East and Africa Corneal Pachymetry Market Revenue (Million), by Type 2024 & 2032
- Figure 60: Middle East and Africa Corneal Pachymetry Market Volume (K Unit), by Type 2024 & 2032
- Figure 61: Middle East and Africa Corneal Pachymetry Market Revenue Share (%), by Type 2024 & 2032
- Figure 62: Middle East and Africa Corneal Pachymetry Market Volume Share (%), by Type 2024 & 2032
- Figure 63: Middle East and Africa Corneal Pachymetry Market Revenue (Million), by Application 2024 & 2032
- Figure 64: Middle East and Africa Corneal Pachymetry Market Volume (K Unit), by Application 2024 & 2032
- Figure 65: Middle East and Africa Corneal Pachymetry Market Revenue Share (%), by Application 2024 & 2032
- Figure 66: Middle East and Africa Corneal Pachymetry Market Volume Share (%), by Application 2024 & 2032
- Figure 67: Middle East and Africa Corneal Pachymetry Market Revenue (Million), by Country 2024 & 2032
- Figure 68: Middle East and Africa Corneal Pachymetry Market Volume (K Unit), by Country 2024 & 2032
- Figure 69: Middle East and Africa Corneal Pachymetry Market Revenue Share (%), by Country 2024 & 2032
- Figure 70: Middle East and Africa Corneal Pachymetry Market Volume Share (%), by Country 2024 & 2032
- Figure 71: South America Corneal Pachymetry Market Revenue (Million), by Type 2024 & 2032
- Figure 72: South America Corneal Pachymetry Market Volume (K Unit), by Type 2024 & 2032
- Figure 73: South America Corneal Pachymetry Market Revenue Share (%), by Type 2024 & 2032
- Figure 74: South America Corneal Pachymetry Market Volume Share (%), by Type 2024 & 2032
- Figure 75: South America Corneal Pachymetry Market Revenue (Million), by Application 2024 & 2032
- Figure 76: South America Corneal Pachymetry Market Volume (K Unit), by Application 2024 & 2032
- Figure 77: South America Corneal Pachymetry Market Revenue Share (%), by Application 2024 & 2032
- Figure 78: South America Corneal Pachymetry Market Volume Share (%), by Application 2024 & 2032
- Figure 79: South America Corneal Pachymetry Market Revenue (Million), by Country 2024 & 2032
- Figure 80: South America Corneal Pachymetry Market Volume (K Unit), by Country 2024 & 2032
- Figure 81: South America Corneal Pachymetry Market Revenue Share (%), by Country 2024 & 2032
- Figure 82: South America Corneal Pachymetry Market Volume Share (%), by Country 2024 & 2032
List of Tables
- Table 1: Global Corneal Pachymetry Market Revenue Million Forecast, by Region 2019 & 2032
- Table 2: Global Corneal Pachymetry Market Volume K Unit Forecast, by Region 2019 & 2032
- Table 3: Global Corneal Pachymetry Market Revenue Million Forecast, by Type 2019 & 2032
- Table 4: Global Corneal Pachymetry Market Volume K Unit Forecast, by Type 2019 & 2032
- Table 5: Global Corneal Pachymetry Market Revenue Million Forecast, by Application 2019 & 2032
- Table 6: Global Corneal Pachymetry Market Volume K Unit Forecast, by Application 2019 & 2032
- Table 7: Global Corneal Pachymetry Market Revenue Million Forecast, by Region 2019 & 2032
- Table 8: Global Corneal Pachymetry Market Volume K Unit Forecast, by Region 2019 & 2032
- Table 9: Global Corneal Pachymetry Market Revenue Million Forecast, by Country 2019 & 2032
- Table 10: Global Corneal Pachymetry Market Volume K Unit Forecast, by Country 2019 & 2032
- Table 11: United States Corneal Pachymetry Market Revenue (Million) Forecast, by Application 2019 & 2032
- Table 12: United States Corneal Pachymetry Market Volume (K Unit) Forecast, by Application 2019 & 2032
- Table 13: Canada Corneal Pachymetry Market Revenue (Million) Forecast, by Application 2019 & 2032
- Table 14: Canada Corneal Pachymetry Market Volume (K Unit) Forecast, by Application 2019 & 2032
- Table 15: Mexico Corneal Pachymetry Market Revenue (Million) Forecast, by Application 2019 & 2032
- Table 16: Mexico Corneal Pachymetry Market Volume (K Unit) Forecast, by Application 2019 & 2032
- Table 17: Global Corneal Pachymetry Market Revenue Million Forecast, by Country 2019 & 2032
- Table 18: Global Corneal Pachymetry Market Volume K Unit Forecast, by Country 2019 & 2032
- Table 19: Germany Corneal Pachymetry Market Revenue (Million) Forecast, by Application 2019 & 2032
- Table 20: Germany Corneal Pachymetry Market Volume (K Unit) Forecast, by Application 2019 & 2032
- Table 21: United Kingdom Corneal Pachymetry Market Revenue (Million) Forecast, by Application 2019 & 2032
- Table 22: United Kingdom Corneal Pachymetry Market Volume (K Unit) Forecast, by Application 2019 & 2032
- Table 23: France Corneal Pachymetry Market Revenue (Million) Forecast, by Application 2019 & 2032
- Table 24: France Corneal Pachymetry Market Volume (K Unit) Forecast, by Application 2019 & 2032
- Table 25: Italy Corneal Pachymetry Market Revenue (Million) Forecast, by Application 2019 & 2032
- Table 26: Italy Corneal Pachymetry Market Volume (K Unit) Forecast, by Application 2019 & 2032
- Table 27: Spain Corneal Pachymetry Market Revenue (Million) Forecast, by Application 2019 & 2032
- Table 28: Spain Corneal Pachymetry Market Volume (K Unit) Forecast, by Application 2019 & 2032
- Table 29: Rest of Europe Corneal Pachymetry Market Revenue (Million) Forecast, by Application 2019 & 2032
- Table 30: Rest of Europe Corneal Pachymetry Market Volume (K Unit) Forecast, by Application 2019 & 2032
- Table 31: Global Corneal Pachymetry Market Revenue Million Forecast, by Country 2019 & 2032
- Table 32: Global Corneal Pachymetry Market Volume K Unit Forecast, by Country 2019 & 2032
- Table 33: China Corneal Pachymetry Market Revenue (Million) Forecast, by Application 2019 & 2032
- Table 34: China Corneal Pachymetry Market Volume (K Unit) Forecast, by Application 2019 & 2032
- Table 35: Japan Corneal Pachymetry Market Revenue (Million) Forecast, by Application 2019 & 2032
- Table 36: Japan Corneal Pachymetry Market Volume (K Unit) Forecast, by Application 2019 & 2032
- Table 37: India Corneal Pachymetry Market Revenue (Million) Forecast, by Application 2019 & 2032
- Table 38: India Corneal Pachymetry Market Volume (K Unit) Forecast, by Application 2019 & 2032
- Table 39: Australia Corneal Pachymetry Market Revenue (Million) Forecast, by Application 2019 & 2032
- Table 40: Australia Corneal Pachymetry Market Volume (K Unit) Forecast, by Application 2019 & 2032
- Table 41: South Korea Corneal Pachymetry Market Revenue (Million) Forecast, by Application 2019 & 2032
- Table 42: South Korea Corneal Pachymetry Market Volume (K Unit) Forecast, by Application 2019 & 2032
- Table 43: Rest of Asia Pacific Corneal Pachymetry Market Revenue (Million) Forecast, by Application 2019 & 2032
- Table 44: Rest of Asia Pacific Corneal Pachymetry Market Volume (K Unit) Forecast, by Application 2019 & 2032
- Table 45: Global Corneal Pachymetry Market Revenue Million Forecast, by Country 2019 & 2032
- Table 46: Global Corneal Pachymetry Market Volume K Unit Forecast, by Country 2019 & 2032
- Table 47: GCC Corneal Pachymetry Market Revenue (Million) Forecast, by Application 2019 & 2032
- Table 48: GCC Corneal Pachymetry Market Volume (K Unit) Forecast, by Application 2019 & 2032
- Table 49: South Africa Corneal Pachymetry Market Revenue (Million) Forecast, by Application 2019 & 2032
- Table 50: South Africa Corneal Pachymetry Market Volume (K Unit) Forecast, by Application 2019 & 2032
- Table 51: Rest of Middle East and Africa Corneal Pachymetry Market Revenue (Million) Forecast, by Application 2019 & 2032
- Table 52: Rest of Middle East and Africa Corneal Pachymetry Market Volume (K Unit) Forecast, by Application 2019 & 2032
- Table 53: Global Corneal Pachymetry Market Revenue Million Forecast, by Country 2019 & 2032
- Table 54: Global Corneal Pachymetry Market Volume K Unit Forecast, by Country 2019 & 2032
- Table 55: Brazil Corneal Pachymetry Market Revenue (Million) Forecast, by Application 2019 & 2032
- Table 56: Brazil Corneal Pachymetry Market Volume (K Unit) Forecast, by Application 2019 & 2032
- Table 57: Argentina Corneal Pachymetry Market Revenue (Million) Forecast, by Application 2019 & 2032
- Table 58: Argentina Corneal Pachymetry Market Volume (K Unit) Forecast, by Application 2019 & 2032
- Table 59: Rest of South America Corneal Pachymetry Market Revenue (Million) Forecast, by Application 2019 & 2032
- Table 60: Rest of South America Corneal Pachymetry Market Volume (K Unit) Forecast, by Application 2019 & 2032
- Table 61: Global Corneal Pachymetry Market Revenue Million Forecast, by Type 2019 & 2032
- Table 62: Global Corneal Pachymetry Market Volume K Unit Forecast, by Type 2019 & 2032
- Table 63: Global Corneal Pachymetry Market Revenue Million Forecast, by Application 2019 & 2032
- Table 64: Global Corneal Pachymetry Market Volume K Unit Forecast, by Application 2019 & 2032
- Table 65: Global Corneal Pachymetry Market Revenue Million Forecast, by Country 2019 & 2032
- Table 66: Global Corneal Pachymetry Market Volume K Unit Forecast, by Country 2019 & 2032
- Table 67: United States Corneal Pachymetry Market Revenue (Million) Forecast, by Application 2019 & 2032
- Table 68: United States Corneal Pachymetry Market Volume (K Unit) Forecast, by Application 2019 & 2032
- Table 69: Canada Corneal Pachymetry Market Revenue (Million) Forecast, by Application 2019 & 2032
- Table 70: Canada Corneal Pachymetry Market Volume (K Unit) Forecast, by Application 2019 & 2032
- Table 71: Mexico Corneal Pachymetry Market Revenue (Million) Forecast, by Application 2019 & 2032
- Table 72: Mexico Corneal Pachymetry Market Volume (K Unit) Forecast, by Application 2019 & 2032
- Table 73: Global Corneal Pachymetry Market Revenue Million Forecast, by Type 2019 & 2032
- Table 74: Global Corneal Pachymetry Market Volume K Unit Forecast, by Type 2019 & 2032
- Table 75: Global Corneal Pachymetry Market Revenue Million Forecast, by Application 2019 & 2032
- Table 76: Global Corneal Pachymetry Market Volume K Unit Forecast, by Application 2019 & 2032
- Table 77: Global Corneal Pachymetry Market Revenue Million Forecast, by Country 2019 & 2032
- Table 78: Global Corneal Pachymetry Market Volume K Unit Forecast, by Country 2019 & 2032
- Table 79: Germany Corneal Pachymetry Market Revenue (Million) Forecast, by Application 2019 & 2032
- Table 80: Germany Corneal Pachymetry Market Volume (K Unit) Forecast, by Application 2019 & 2032
- Table 81: United Kingdom Corneal Pachymetry Market Revenue (Million) Forecast, by Application 2019 & 2032
- Table 82: United Kingdom Corneal Pachymetry Market Volume (K Unit) Forecast, by Application 2019 & 2032
- Table 83: France Corneal Pachymetry Market Revenue (Million) Forecast, by Application 2019 & 2032
- Table 84: France Corneal Pachymetry Market Volume (K Unit) Forecast, by Application 2019 & 2032
- Table 85: Italy Corneal Pachymetry Market Revenue (Million) Forecast, by Application 2019 & 2032
- Table 86: Italy Corneal Pachymetry Market Volume (K Unit) Forecast, by Application 2019 & 2032
- Table 87: Spain Corneal Pachymetry Market Revenue (Million) Forecast, by Application 2019 & 2032
- Table 88: Spain Corneal Pachymetry Market Volume (K Unit) Forecast, by Application 2019 & 2032
- Table 89: Rest of Europe Corneal Pachymetry Market Revenue (Million) Forecast, by Application 2019 & 2032
- Table 90: Rest of Europe Corneal Pachymetry Market Volume (K Unit) Forecast, by Application 2019 & 2032
- Table 91: Global Corneal Pachymetry Market Revenue Million Forecast, by Type 2019 & 2032
- Table 92: Global Corneal Pachymetry Market Volume K Unit Forecast, by Type 2019 & 2032
- Table 93: Global Corneal Pachymetry Market Revenue Million Forecast, by Application 2019 & 2032
- Table 94: Global Corneal Pachymetry Market Volume K Unit Forecast, by Application 2019 & 2032
- Table 95: Global Corneal Pachymetry Market Revenue Million Forecast, by Country 2019 & 2032
- Table 96: Global Corneal Pachymetry Market Volume K Unit Forecast, by Country 2019 & 2032
- Table 97: China Corneal Pachymetry Market Revenue (Million) Forecast, by Application 2019 & 2032
- Table 98: China Corneal Pachymetry Market Volume (K Unit) Forecast, by Application 2019 & 2032
- Table 99: Japan Corneal Pachymetry Market Revenue (Million) Forecast, by Application 2019 & 2032
- Table 100: Japan Corneal Pachymetry Market Volume (K Unit) Forecast, by Application 2019 & 2032
- Table 101: India Corneal Pachymetry Market Revenue (Million) Forecast, by Application 2019 & 2032
- Table 102: India Corneal Pachymetry Market Volume (K Unit) Forecast, by Application 2019 & 2032
- Table 103: Australia Corneal Pachymetry Market Revenue (Million) Forecast, by Application 2019 & 2032
- Table 104: Australia Corneal Pachymetry Market Volume (K Unit) Forecast, by Application 2019 & 2032
- Table 105: South Korea Corneal Pachymetry Market Revenue (Million) Forecast, by Application 2019 & 2032
- Table 106: South Korea Corneal Pachymetry Market Volume (K Unit) Forecast, by Application 2019 & 2032
- Table 107: Rest of Asia Pacific Corneal Pachymetry Market Revenue (Million) Forecast, by Application 2019 & 2032
- Table 108: Rest of Asia Pacific Corneal Pachymetry Market Volume (K Unit) Forecast, by Application 2019 & 2032
- Table 109: Global Corneal Pachymetry Market Revenue Million Forecast, by Type 2019 & 2032
- Table 110: Global Corneal Pachymetry Market Volume K Unit Forecast, by Type 2019 & 2032
- Table 111: Global Corneal Pachymetry Market Revenue Million Forecast, by Application 2019 & 2032
- Table 112: Global Corneal Pachymetry Market Volume K Unit Forecast, by Application 2019 & 2032
- Table 113: Global Corneal Pachymetry Market Revenue Million Forecast, by Country 2019 & 2032
- Table 114: Global Corneal Pachymetry Market Volume K Unit Forecast, by Country 2019 & 2032
- Table 115: GCC Corneal Pachymetry Market Revenue (Million) Forecast, by Application 2019 & 2032
- Table 116: GCC Corneal Pachymetry Market Volume (K Unit) Forecast, by Application 2019 & 2032
- Table 117: South Africa Corneal Pachymetry Market Revenue (Million) Forecast, by Application 2019 & 2032
- Table 118: South Africa Corneal Pachymetry Market Volume (K Unit) Forecast, by Application 2019 & 2032
- Table 119: Rest of Middle East and Africa Corneal Pachymetry Market Revenue (Million) Forecast, by Application 2019 & 2032
- Table 120: Rest of Middle East and Africa Corneal Pachymetry Market Volume (K Unit) Forecast, by Application 2019 & 2032
- Table 121: Global Corneal Pachymetry Market Revenue Million Forecast, by Type 2019 & 2032
- Table 122: Global Corneal Pachymetry Market Volume K Unit Forecast, by Type 2019 & 2032
- Table 123: Global Corneal Pachymetry Market Revenue Million Forecast, by Application 2019 & 2032
- Table 124: Global Corneal Pachymetry Market Volume K Unit Forecast, by Application 2019 & 2032
- Table 125: Global Corneal Pachymetry Market Revenue Million Forecast, by Country 2019 & 2032
- Table 126: Global Corneal Pachymetry Market Volume K Unit Forecast, by Country 2019 & 2032
- Table 127: Brazil Corneal Pachymetry Market Revenue (Million) Forecast, by Application 2019 & 2032
- Table 128: Brazil Corneal Pachymetry Market Volume (K Unit) Forecast, by Application 2019 & 2032
- Table 129: Argentina Corneal Pachymetry Market Revenue (Million) Forecast, by Application 2019 & 2032
- Table 130: Argentina Corneal Pachymetry Market Volume (K Unit) Forecast, by Application 2019 & 2032
- Table 131: Rest of South America Corneal Pachymetry Market Revenue (Million) Forecast, by Application 2019 & 2032
- Table 132: Rest of South America Corneal Pachymetry Market Volume (K Unit) Forecast, by Application 2019 & 2032
Frequently Asked Questions
1. What is the projected Compound Annual Growth Rate (CAGR) of the Corneal Pachymetry Market?
The projected CAGR is approximately 4.88%.
2. Which companies are prominent players in the Corneal Pachymetry Market?
Key companies in the market include Lumibird Group (Quantel Medical), Xuzhou Kaixin Electronic Instrument Co , DGH Technology Inc, Optovue Incorporated, TOMEY CORPORATION, Reichert Inc, Carl Zeiss AG, Sonomed Escalon, Topcon Corporation, NIDEK CO LTD.
3. What are the main segments of the Corneal Pachymetry Market?
The market segments include Type, Application.
4. Can you provide details about the market size?
The market size is estimated to be USD 304.82 Million as of 2022.
5. What are some drivers contributing to market growth?
Rise in Prevalence of Glaucoma and Eye-related Disorders; Rise in Prevalence of Diabetic Retinopathy.
6. What are the notable trends driving market growth?
Glaucoma Diagnostics Segment Expects to Register a Significant CAGR Over the Forecast Period.
7. Are there any restraints impacting market growth?
Inadequate Reimbursement Coverage for Pachymetry; Stringent Government Regulations.
8. Can you provide examples of recent developments in the market?
January 2023: Bausch + Lomb Corp. and the Glaucoma Research Foundation (GRF) launched "Screen, Protect, Cure," a campaign designed to provide educational resources and raise awareness of glaucoma in the United States.
9. What pricing options are available for accessing the report?
Pricing options include single-user, multi-user, and enterprise licenses priced at USD 4750, USD 5250, and USD 8750 respectively.
10. Is the market size provided in terms of value or volume?
The market size is provided in terms of value, measured in Million and volume, measured in K Unit.
11. Are there any specific market keywords associated with the report?
Yes, the market keyword associated with the report is "Corneal Pachymetry Market," which aids in identifying and referencing the specific market segment covered.
12. How do I determine which pricing option suits my needs best?
The pricing options vary based on user requirements and access needs. Individual users may opt for single-user licenses, while businesses requiring broader access may choose multi-user or enterprise licenses for cost-effective access to the report.
13. Are there any additional resources or data provided in the Corneal Pachymetry Market report?
While the report offers comprehensive insights, it's advisable to review the specific contents or supplementary materials provided to ascertain if additional resources or data are available.
14. How can I stay updated on further developments or reports in the Corneal Pachymetry Market?
To stay informed about further developments, trends, and reports in the Corneal Pachymetry Market, consider subscribing to industry newsletters, following relevant companies and organizations, or regularly checking reputable industry news sources and publications.
Methodology
Step 1 - Identification of Relevant Samples Size from Population Database


Step 2 - Approaches for Defining Global Market Size (Value, Volume* & Price*)

Note*: In applicable scenarios
Step 3 - Data Sources
Primary Research
- Web Analytics
- Survey Reports
- Research Institute
- Latest Research Reports
- Opinion Leaders
Secondary Research
- Annual Reports
- White Paper
- Latest Press Release
- Industry Association
- Paid Database
- Investor Presentations

Step 4 - Data Triangulation
Involves using different sources of information in order to increase the validity of a study
These sources are likely to be stakeholders in a program - participants, other researchers, program staff, other community members, and so on.
Then we put all data in single framework & apply various statistical tools to find out the dynamic on the market.
During the analysis stage, feedback from the stakeholder groups would be compared to determine areas of agreement as well as areas of divergence


