
Key Insights
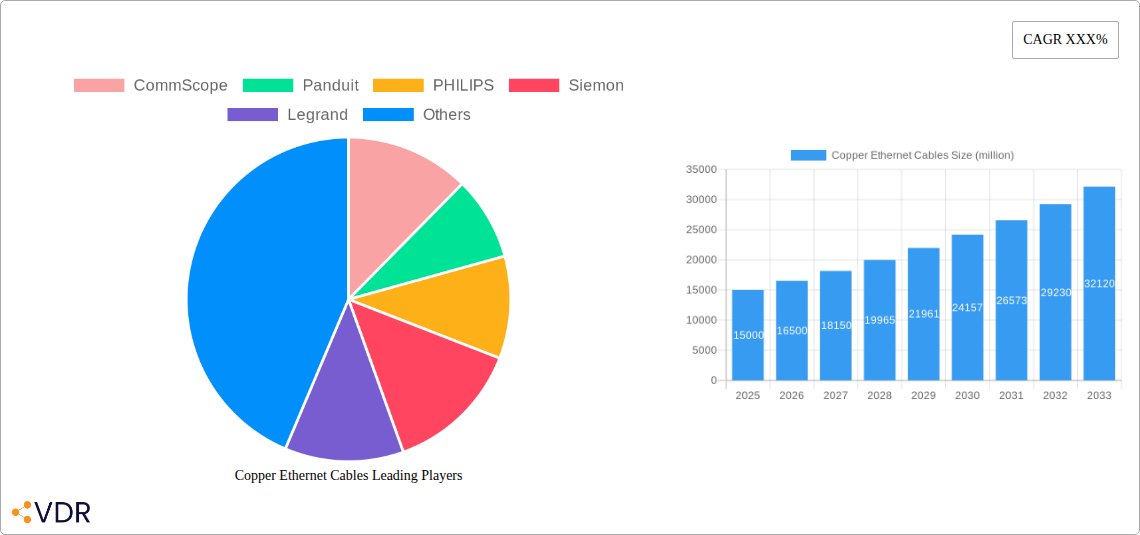
The global copper Ethernet cable market is experiencing robust growth, driven by the expanding demand for high-speed data transmission across various sectors. The increasing adoption of cloud computing, the Internet of Things (IoT), and 5G networks is fueling the need for reliable and efficient copper cabling infrastructure. Furthermore, the ongoing digital transformation across industries, including data centers, enterprises, and residential areas, necessitates significant investment in high-bandwidth cabling solutions. While fiber optic cables offer higher bandwidth capacities, copper Ethernet cables continue to maintain a significant market share due to their lower cost, ease of installation, and widespread compatibility with existing infrastructure. This makes them a cost-effective solution for many applications, particularly in areas where short-distance high-speed connectivity is sufficient. Competition within the market is intense, with major players like CommScope, Panduit, and Belden vying for market share through product innovation, strategic partnerships, and geographical expansion. The market is segmented by cable type (e.g., Cat5e, Cat6, Cat6a, Cat8), application (data centers, enterprise networks, industrial automation), and region. Future growth will be influenced by technological advancements in copper cabling technology, such as shielded twisted-pair (STP) and improved connector designs, aiming to enhance performance and reduce signal interference.
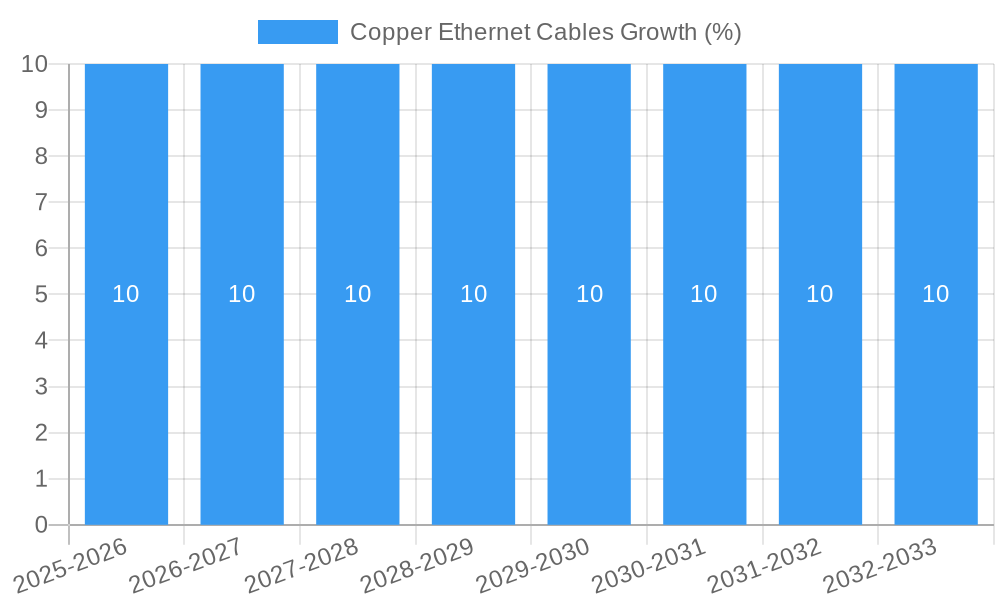
The market's growth trajectory is projected to remain positive throughout the forecast period (2025-2033), albeit at a potentially moderating rate. Factors such as rising raw material costs and increasing competition from fiber optics could act as restraints. However, the continued expansion of data centers, the growing adoption of smart city initiatives, and the persistent need for robust network connectivity in industrial settings are expected to offset these challenges. Geographic expansion into emerging markets, particularly in Asia-Pacific, offers significant potential for growth. Industry players are focusing on developing environmentally friendly and sustainable cabling solutions to meet increasing environmental regulations and corporate sustainability goals. This emphasis on sustainability, coupled with continuous innovation in copper cabling technology, will be crucial factors shaping the future landscape of this dynamic market.
Copper Ethernet Cables Market Report: 2019-2033
This comprehensive report provides an in-depth analysis of the global Copper Ethernet Cables market, encompassing market dynamics, growth trends, regional analysis, competitive landscape, and future outlook. The study period covers 2019-2033, with 2025 as the base and estimated year, and a forecast period of 2025-2033. The report caters to industry professionals, investors, and stakeholders seeking a thorough understanding of this crucial segment within the broader networking infrastructure market. The market size is expected to reach xx million units by 2033.
Copper Ethernet Cables Market Dynamics & Structure
The Copper Ethernet Cables market, a critical component of the broader data center and networking equipment market, is characterized by a moderately concentrated landscape. While a few major players hold significant market share, a multitude of regional and specialized vendors contribute to the overall dynamics. Technological innovation, driven by increasing bandwidth demands and the need for higher speeds (e.g., 10GBase-T, 25GBase-T, 40GBase-T), is a key driver. Regulatory frameworks, particularly concerning environmental standards and cable safety, influence product development and manufacturing. Fiber optic cables represent the primary competitive substitute, but copper continues to dominate shorter distances and specific applications due to cost-effectiveness and ease of installation. The end-user demographics are diverse, encompassing enterprises, data centers, telecommunications providers, and residential users. M&A activity within the sector has been relatively moderate in recent years, with xx major deals recorded between 2019 and 2024, primarily focused on expanding geographical reach and product portfolios.
- Market Concentration: Moderately concentrated, with top 5 players holding approximately xx% market share in 2024.
- Technological Innovation: Focus on higher speed standards (25GBase-T, 40GBase-T), improved shielding, and power-over-Ethernet (PoE) capabilities.
- Regulatory Landscape: Compliance with RoHS, REACH, and other environmental regulations is crucial.
- Competitive Substitutes: Fiber optic cables for long-distance transmission.
- End-User Demographics: Enterprises, data centers, telecommunications, residential.
- M&A Activity: xx major deals between 2019-2024, primarily focused on expansion and diversification.
Copper Ethernet Cables Growth Trends & Insights
The Copper Ethernet Cables market experienced steady growth during the historical period (2019-2024), driven by the proliferation of connected devices, increasing data traffic, and ongoing investments in IT infrastructure. The market size expanded from xx million units in 2019 to xx million units in 2024, registering a CAGR of xx%. This growth is expected to continue throughout the forecast period (2025-2033), although at a slightly moderated pace due to some market saturation in certain segments. The adoption rate of higher-speed Ethernet standards is a key indicator of market growth, with significant adoption of 10GBase-T and increasing penetration of 25GBase-T. Technological disruptions are expected from advancements in cable design and materials, while consumer behavior shifts towards higher bandwidth requirements for streaming and other data-intensive applications will continue to fuel demand. Market penetration of 25GBase-T and 40GBase-T is projected to increase significantly by 2033, driving overall market expansion.
Dominant Regions, Countries, or Segments in Copper Ethernet Cables
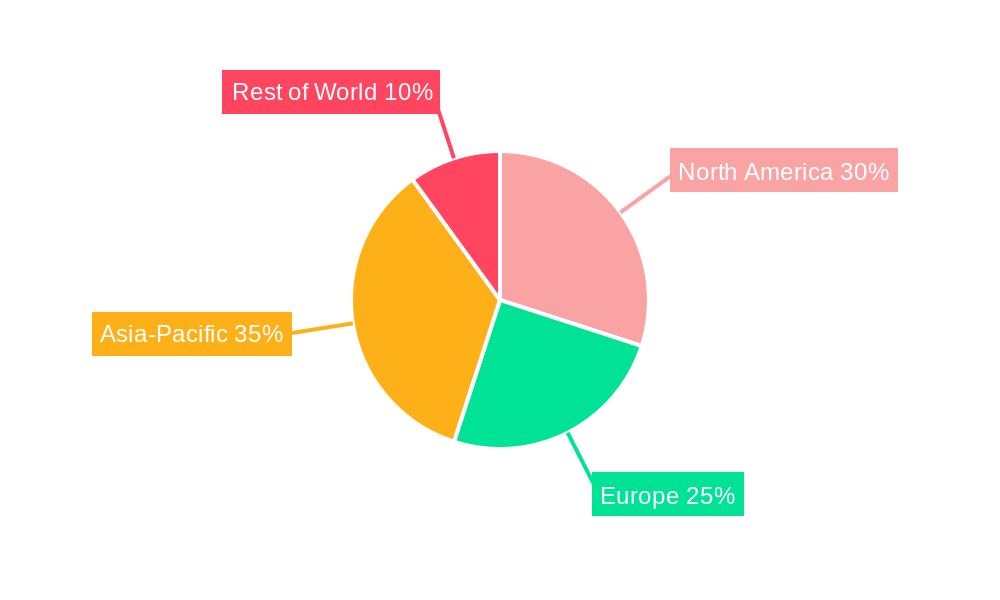
North America and Western Europe currently dominate the Copper Ethernet Cables market, driven by robust IT infrastructure, high data consumption rates, and early adoption of advanced Ethernet technologies. However, regions like Asia-Pacific are showing significant growth potential fueled by expanding economies, increased urbanization, and rising investments in digital infrastructure. Within these regions, specific countries like the United States, China, Germany, and Japan hold substantial market shares. The data center segment is the largest consumer of Copper Ethernet Cables, followed by enterprise networks and residential applications.
- Key Drivers:
- North America & Western Europe: High IT infrastructure spending, early adoption of advanced technologies.
- Asia-Pacific: Rapid economic growth, increasing urbanization, investments in digital infrastructure.
- Dominant Segments: Data centers, enterprise networks, residential applications.
- Growth Potential: Asia-Pacific shows the most significant growth potential driven by factors such as rising disposable income and increasing internet and mobile penetration.
Copper Ethernet Cables Product Landscape
The Copper Ethernet Cables market offers a range of products categorized by cable type (e.g., shielded, unshielded, twisted-pair), connectivity (e.g., RJ45), and performance characteristics (e.g., bandwidth, length). Recent innovations include cables with improved shielding for enhanced electromagnetic interference (EMI) protection, higher conductor counts to support higher bandwidths, and integrated PoE capabilities for powering network devices. These advancements enhance reliability, reduce signal attenuation, and improve power efficiency.
Key Drivers, Barriers & Challenges in Copper Ethernet Cables
Key Drivers: The increasing demand for high-speed data transmission in data centers, enterprise networks, and the growth of the Internet of Things (IoT) are major drivers. The rising adoption of cloud computing and 5G networks further fuels demand. Government initiatives promoting digital infrastructure development also contribute positively.
Key Challenges: Competition from fiber optic cables, particularly in long-distance applications, represents a significant challenge. Fluctuations in raw material prices (copper) and potential supply chain disruptions can impact profitability and product availability. Stringent regulatory compliance requirements also present hurdles for manufacturers.
Emerging Opportunities in Copper Ethernet Cables
Emerging opportunities lie in the development of high-speed, low-latency cables for demanding applications like autonomous vehicles, industrial automation, and advanced robotics. The integration of PoE++ and higher-power PoE capabilities in Ethernet cables is opening new avenues for powering more energy-intensive devices. Expansion into untapped markets, such as rural areas with limited fiber infrastructure, presents a significant growth opportunity.
Growth Accelerators in the Copper Ethernet Cables Industry
Technological advancements, such as the development of next-generation Ethernet standards (beyond 40GBase-T), will continue to drive market expansion. Strategic partnerships between cable manufacturers and network equipment vendors can accelerate product development and market penetration. Expansion into emerging markets with growing IT infrastructure investments offers substantial growth potential.
Key Players Shaping the Copper Ethernet Cables Market
- CommScope
- Panduit
- PHILIPS
- Siemon
- Legrand
- Belden
- Corning
- Schneider Electric
- Nexans
- Datwyler
- IBM
- Eland Cables
- Ship Group
- DINTEK
- Tsinghua Tongfang
- Zhejiang Zhaolong Interconnect
- Potevio
- YOFC
- Datang Telecom
- TP-LINK
- SAMZHE
- CHOSEAL
- TC Smart Systems
- Zhejiang Headway Communication
Notable Milestones in Copper Ethernet Cables Sector
- 2020: Introduction of xx Gbps Ethernet cable by CommScope.
- 2021: Partnership between Belden and a major data center operator for customized cable solutions.
- 2022: Acquisition of a smaller cable manufacturer by Legrand.
- 2023: Launch of a new shielded cable line by Panduit emphasizing improved EMI protection.
- 2024: Industry-wide adoption of a new standard for PoE++ cabling.
In-Depth Copper Ethernet Cables Market Outlook
The Copper Ethernet Cables market is poised for continued growth, driven by the unrelenting demand for higher bandwidth and faster data transmission speeds. Strategic investments in research and development, coupled with strategic partnerships and market expansion initiatives, will shape the future landscape. The increasing adoption of advanced Ethernet standards and the integration of innovative technologies will unlock new opportunities and drive long-term market expansion. The overall market is expected to maintain a healthy growth trajectory throughout the forecast period.
Copper Ethernet Cables Segmentation
-
1. Application
- 1.1. Household
- 1.2. Commercial
-
2. Type
- 2.1. Twisted Pair Cable
- 2.2. Coaxial Cable
Copper Ethernet Cables Segmentation By Geography
-
1. North America
- 1.1. United States
- 1.2. Canada
- 1.3. Mexico
-
2. South America
- 2.1. Brazil
- 2.2. Argentina
- 2.3. Rest of South America
-
3. Europe
- 3.1. United Kingdom
- 3.2. Germany
- 3.3. France
- 3.4. Italy
- 3.5. Spain
- 3.6. Russia
- 3.7. Benelux
- 3.8. Nordics
- 3.9. Rest of Europe
-
4. Middle East & Africa
- 4.1. Turkey
- 4.2. Israel
- 4.3. GCC
- 4.4. North Africa
- 4.5. South Africa
- 4.6. Rest of Middle East & Africa
-
5. Asia Pacific
- 5.1. China
- 5.2. India
- 5.3. Japan
- 5.4. South Korea
- 5.5. ASEAN
- 5.6. Oceania
- 5.7. Rest of Asia Pacific
Copper Ethernet Cables REPORT HIGHLIGHTS
| Aspects | Details |
|---|---|
| Study Period | 2019-2033 |
| Base Year | 2024 |
| Estimated Year | 2025 |
| Forecast Period | 2025-2033 |
| Historical Period | 2019-2024 |
| Growth Rate | CAGR of XXX% from 2019-2033 |
| Segmentation |
|
Table of Contents
- 1. Introduction
- 1.1. Research Scope
- 1.2. Market Segmentation
- 1.3. Research Methodology
- 1.4. Definitions and Assumptions
- 2. Executive Summary
- 2.1. Introduction
- 3. Market Dynamics
- 3.1. Introduction
- 3.2. Market Drivers
- 3.3. Market Restrains
- 3.4. Market Trends
- 4. Market Factor Analysis
- 4.1. Porters Five Forces
- 4.2. Supply/Value Chain
- 4.3. PESTEL analysis
- 4.4. Market Entropy
- 4.5. Patent/Trademark Analysis
- 5. Global Copper Ethernet Cables Analysis, Insights and Forecast, 2019-2031
- 5.1. Market Analysis, Insights and Forecast - by Application
- 5.1.1. Household
- 5.1.2. Commercial
- 5.2. Market Analysis, Insights and Forecast - by Type
- 5.2.1. Twisted Pair Cable
- 5.2.2. Coaxial Cable
- 5.3. Market Analysis, Insights and Forecast - by Region
- 5.3.1. North America
- 5.3.2. South America
- 5.3.3. Europe
- 5.3.4. Middle East & Africa
- 5.3.5. Asia Pacific
- 5.1. Market Analysis, Insights and Forecast - by Application
- 6. North America Copper Ethernet Cables Analysis, Insights and Forecast, 2019-2031
- 6.1. Market Analysis, Insights and Forecast - by Application
- 6.1.1. Household
- 6.1.2. Commercial
- 6.2. Market Analysis, Insights and Forecast - by Type
- 6.2.1. Twisted Pair Cable
- 6.2.2. Coaxial Cable
- 6.1. Market Analysis, Insights and Forecast - by Application
- 7. South America Copper Ethernet Cables Analysis, Insights and Forecast, 2019-2031
- 7.1. Market Analysis, Insights and Forecast - by Application
- 7.1.1. Household
- 7.1.2. Commercial
- 7.2. Market Analysis, Insights and Forecast - by Type
- 7.2.1. Twisted Pair Cable
- 7.2.2. Coaxial Cable
- 7.1. Market Analysis, Insights and Forecast - by Application
- 8. Europe Copper Ethernet Cables Analysis, Insights and Forecast, 2019-2031
- 8.1. Market Analysis, Insights and Forecast - by Application
- 8.1.1. Household
- 8.1.2. Commercial
- 8.2. Market Analysis, Insights and Forecast - by Type
- 8.2.1. Twisted Pair Cable
- 8.2.2. Coaxial Cable
- 8.1. Market Analysis, Insights and Forecast - by Application
- 9. Middle East & Africa Copper Ethernet Cables Analysis, Insights and Forecast, 2019-2031
- 9.1. Market Analysis, Insights and Forecast - by Application
- 9.1.1. Household
- 9.1.2. Commercial
- 9.2. Market Analysis, Insights and Forecast - by Type
- 9.2.1. Twisted Pair Cable
- 9.2.2. Coaxial Cable
- 9.1. Market Analysis, Insights and Forecast - by Application
- 10. Asia Pacific Copper Ethernet Cables Analysis, Insights and Forecast, 2019-2031
- 10.1. Market Analysis, Insights and Forecast - by Application
- 10.1.1. Household
- 10.1.2. Commercial
- 10.2. Market Analysis, Insights and Forecast - by Type
- 10.2.1. Twisted Pair Cable
- 10.2.2. Coaxial Cable
- 10.1. Market Analysis, Insights and Forecast - by Application
- 11. Competitive Analysis
- 11.1. Global Market Share Analysis 2024
- 11.2. Company Profiles
- 11.2.1 CommScope
- 11.2.1.1. Overview
- 11.2.1.2. Products
- 11.2.1.3. SWOT Analysis
- 11.2.1.4. Recent Developments
- 11.2.1.5. Financials (Based on Availability)
- 11.2.2 Panduit
- 11.2.2.1. Overview
- 11.2.2.2. Products
- 11.2.2.3. SWOT Analysis
- 11.2.2.4. Recent Developments
- 11.2.2.5. Financials (Based on Availability)
- 11.2.3 PHILIPS
- 11.2.3.1. Overview
- 11.2.3.2. Products
- 11.2.3.3. SWOT Analysis
- 11.2.3.4. Recent Developments
- 11.2.3.5. Financials (Based on Availability)
- 11.2.4 Siemon
- 11.2.4.1. Overview
- 11.2.4.2. Products
- 11.2.4.3. SWOT Analysis
- 11.2.4.4. Recent Developments
- 11.2.4.5. Financials (Based on Availability)
- 11.2.5 Legrand
- 11.2.5.1. Overview
- 11.2.5.2. Products
- 11.2.5.3. SWOT Analysis
- 11.2.5.4. Recent Developments
- 11.2.5.5. Financials (Based on Availability)
- 11.2.6 Belden
- 11.2.6.1. Overview
- 11.2.6.2. Products
- 11.2.6.3. SWOT Analysis
- 11.2.6.4. Recent Developments
- 11.2.6.5. Financials (Based on Availability)
- 11.2.7 Corning
- 11.2.7.1. Overview
- 11.2.7.2. Products
- 11.2.7.3. SWOT Analysis
- 11.2.7.4. Recent Developments
- 11.2.7.5. Financials (Based on Availability)
- 11.2.8 Schneider
- 11.2.8.1. Overview
- 11.2.8.2. Products
- 11.2.8.3. SWOT Analysis
- 11.2.8.4. Recent Developments
- 11.2.8.5. Financials (Based on Availability)
- 11.2.9 Nexans
- 11.2.9.1. Overview
- 11.2.9.2. Products
- 11.2.9.3. SWOT Analysis
- 11.2.9.4. Recent Developments
- 11.2.9.5. Financials (Based on Availability)
- 11.2.10 Datwyler
- 11.2.10.1. Overview
- 11.2.10.2. Products
- 11.2.10.3. SWOT Analysis
- 11.2.10.4. Recent Developments
- 11.2.10.5. Financials (Based on Availability)
- 11.2.11 IBM
- 11.2.11.1. Overview
- 11.2.11.2. Products
- 11.2.11.3. SWOT Analysis
- 11.2.11.4. Recent Developments
- 11.2.11.5. Financials (Based on Availability)
- 11.2.12 Eland Cables
- 11.2.12.1. Overview
- 11.2.12.2. Products
- 11.2.12.3. SWOT Analysis
- 11.2.12.4. Recent Developments
- 11.2.12.5. Financials (Based on Availability)
- 11.2.13 Ship Group
- 11.2.13.1. Overview
- 11.2.13.2. Products
- 11.2.13.3. SWOT Analysis
- 11.2.13.4. Recent Developments
- 11.2.13.5. Financials (Based on Availability)
- 11.2.14 DINTEK
- 11.2.14.1. Overview
- 11.2.14.2. Products
- 11.2.14.3. SWOT Analysis
- 11.2.14.4. Recent Developments
- 11.2.14.5. Financials (Based on Availability)
- 11.2.15 Tsinghua Tongfang
- 11.2.15.1. Overview
- 11.2.15.2. Products
- 11.2.15.3. SWOT Analysis
- 11.2.15.4. Recent Developments
- 11.2.15.5. Financials (Based on Availability)
- 11.2.16 Zhejiang Zhaolong Interconnect
- 11.2.16.1. Overview
- 11.2.16.2. Products
- 11.2.16.3. SWOT Analysis
- 11.2.16.4. Recent Developments
- 11.2.16.5. Financials (Based on Availability)
- 11.2.17 Potevio
- 11.2.17.1. Overview
- 11.2.17.2. Products
- 11.2.17.3. SWOT Analysis
- 11.2.17.4. Recent Developments
- 11.2.17.5. Financials (Based on Availability)
- 11.2.18 YOFC
- 11.2.18.1. Overview
- 11.2.18.2. Products
- 11.2.18.3. SWOT Analysis
- 11.2.18.4. Recent Developments
- 11.2.18.5. Financials (Based on Availability)
- 11.2.19 Datang Telecom
- 11.2.19.1. Overview
- 11.2.19.2. Products
- 11.2.19.3. SWOT Analysis
- 11.2.19.4. Recent Developments
- 11.2.19.5. Financials (Based on Availability)
- 11.2.20 TP-LINK
- 11.2.20.1. Overview
- 11.2.20.2. Products
- 11.2.20.3. SWOT Analysis
- 11.2.20.4. Recent Developments
- 11.2.20.5. Financials (Based on Availability)
- 11.2.21 SAMZHE
- 11.2.21.1. Overview
- 11.2.21.2. Products
- 11.2.21.3. SWOT Analysis
- 11.2.21.4. Recent Developments
- 11.2.21.5. Financials (Based on Availability)
- 11.2.22 CHOSEAL
- 11.2.22.1. Overview
- 11.2.22.2. Products
- 11.2.22.3. SWOT Analysis
- 11.2.22.4. Recent Developments
- 11.2.22.5. Financials (Based on Availability)
- 11.2.23 TC Smart Systems
- 11.2.23.1. Overview
- 11.2.23.2. Products
- 11.2.23.3. SWOT Analysis
- 11.2.23.4. Recent Developments
- 11.2.23.5. Financials (Based on Availability)
- 11.2.24 Zhejiang Headway Communication
- 11.2.24.1. Overview
- 11.2.24.2. Products
- 11.2.24.3. SWOT Analysis
- 11.2.24.4. Recent Developments
- 11.2.24.5. Financials (Based on Availability)
- 11.2.1 CommScope
List of Figures
- Figure 1: Global Copper Ethernet Cables Revenue Breakdown (million, %) by Region 2024 & 2032
- Figure 2: North America Copper Ethernet Cables Revenue (million), by Application 2024 & 2032
- Figure 3: North America Copper Ethernet Cables Revenue Share (%), by Application 2024 & 2032
- Figure 4: North America Copper Ethernet Cables Revenue (million), by Type 2024 & 2032
- Figure 5: North America Copper Ethernet Cables Revenue Share (%), by Type 2024 & 2032
- Figure 6: North America Copper Ethernet Cables Revenue (million), by Country 2024 & 2032
- Figure 7: North America Copper Ethernet Cables Revenue Share (%), by Country 2024 & 2032
- Figure 8: South America Copper Ethernet Cables Revenue (million), by Application 2024 & 2032
- Figure 9: South America Copper Ethernet Cables Revenue Share (%), by Application 2024 & 2032
- Figure 10: South America Copper Ethernet Cables Revenue (million), by Type 2024 & 2032
- Figure 11: South America Copper Ethernet Cables Revenue Share (%), by Type 2024 & 2032
- Figure 12: South America Copper Ethernet Cables Revenue (million), by Country 2024 & 2032
- Figure 13: South America Copper Ethernet Cables Revenue Share (%), by Country 2024 & 2032
- Figure 14: Europe Copper Ethernet Cables Revenue (million), by Application 2024 & 2032
- Figure 15: Europe Copper Ethernet Cables Revenue Share (%), by Application 2024 & 2032
- Figure 16: Europe Copper Ethernet Cables Revenue (million), by Type 2024 & 2032
- Figure 17: Europe Copper Ethernet Cables Revenue Share (%), by Type 2024 & 2032
- Figure 18: Europe Copper Ethernet Cables Revenue (million), by Country 2024 & 2032
- Figure 19: Europe Copper Ethernet Cables Revenue Share (%), by Country 2024 & 2032
- Figure 20: Middle East & Africa Copper Ethernet Cables Revenue (million), by Application 2024 & 2032
- Figure 21: Middle East & Africa Copper Ethernet Cables Revenue Share (%), by Application 2024 & 2032
- Figure 22: Middle East & Africa Copper Ethernet Cables Revenue (million), by Type 2024 & 2032
- Figure 23: Middle East & Africa Copper Ethernet Cables Revenue Share (%), by Type 2024 & 2032
- Figure 24: Middle East & Africa Copper Ethernet Cables Revenue (million), by Country 2024 & 2032
- Figure 25: Middle East & Africa Copper Ethernet Cables Revenue Share (%), by Country 2024 & 2032
- Figure 26: Asia Pacific Copper Ethernet Cables Revenue (million), by Application 2024 & 2032
- Figure 27: Asia Pacific Copper Ethernet Cables Revenue Share (%), by Application 2024 & 2032
- Figure 28: Asia Pacific Copper Ethernet Cables Revenue (million), by Type 2024 & 2032
- Figure 29: Asia Pacific Copper Ethernet Cables Revenue Share (%), by Type 2024 & 2032
- Figure 30: Asia Pacific Copper Ethernet Cables Revenue (million), by Country 2024 & 2032
- Figure 31: Asia Pacific Copper Ethernet Cables Revenue Share (%), by Country 2024 & 2032
List of Tables
- Table 1: Global Copper Ethernet Cables Revenue million Forecast, by Region 2019 & 2032
- Table 2: Global Copper Ethernet Cables Revenue million Forecast, by Application 2019 & 2032
- Table 3: Global Copper Ethernet Cables Revenue million Forecast, by Type 2019 & 2032
- Table 4: Global Copper Ethernet Cables Revenue million Forecast, by Region 2019 & 2032
- Table 5: Global Copper Ethernet Cables Revenue million Forecast, by Application 2019 & 2032
- Table 6: Global Copper Ethernet Cables Revenue million Forecast, by Type 2019 & 2032
- Table 7: Global Copper Ethernet Cables Revenue million Forecast, by Country 2019 & 2032
- Table 8: United States Copper Ethernet Cables Revenue (million) Forecast, by Application 2019 & 2032
- Table 9: Canada Copper Ethernet Cables Revenue (million) Forecast, by Application 2019 & 2032
- Table 10: Mexico Copper Ethernet Cables Revenue (million) Forecast, by Application 2019 & 2032
- Table 11: Global Copper Ethernet Cables Revenue million Forecast, by Application 2019 & 2032
- Table 12: Global Copper Ethernet Cables Revenue million Forecast, by Type 2019 & 2032
- Table 13: Global Copper Ethernet Cables Revenue million Forecast, by Country 2019 & 2032
- Table 14: Brazil Copper Ethernet Cables Revenue (million) Forecast, by Application 2019 & 2032
- Table 15: Argentina Copper Ethernet Cables Revenue (million) Forecast, by Application 2019 & 2032
- Table 16: Rest of South America Copper Ethernet Cables Revenue (million) Forecast, by Application 2019 & 2032
- Table 17: Global Copper Ethernet Cables Revenue million Forecast, by Application 2019 & 2032
- Table 18: Global Copper Ethernet Cables Revenue million Forecast, by Type 2019 & 2032
- Table 19: Global Copper Ethernet Cables Revenue million Forecast, by Country 2019 & 2032
- Table 20: United Kingdom Copper Ethernet Cables Revenue (million) Forecast, by Application 2019 & 2032
- Table 21: Germany Copper Ethernet Cables Revenue (million) Forecast, by Application 2019 & 2032
- Table 22: France Copper Ethernet Cables Revenue (million) Forecast, by Application 2019 & 2032
- Table 23: Italy Copper Ethernet Cables Revenue (million) Forecast, by Application 2019 & 2032
- Table 24: Spain Copper Ethernet Cables Revenue (million) Forecast, by Application 2019 & 2032
- Table 25: Russia Copper Ethernet Cables Revenue (million) Forecast, by Application 2019 & 2032
- Table 26: Benelux Copper Ethernet Cables Revenue (million) Forecast, by Application 2019 & 2032
- Table 27: Nordics Copper Ethernet Cables Revenue (million) Forecast, by Application 2019 & 2032
- Table 28: Rest of Europe Copper Ethernet Cables Revenue (million) Forecast, by Application 2019 & 2032
- Table 29: Global Copper Ethernet Cables Revenue million Forecast, by Application 2019 & 2032
- Table 30: Global Copper Ethernet Cables Revenue million Forecast, by Type 2019 & 2032
- Table 31: Global Copper Ethernet Cables Revenue million Forecast, by Country 2019 & 2032
- Table 32: Turkey Copper Ethernet Cables Revenue (million) Forecast, by Application 2019 & 2032
- Table 33: Israel Copper Ethernet Cables Revenue (million) Forecast, by Application 2019 & 2032
- Table 34: GCC Copper Ethernet Cables Revenue (million) Forecast, by Application 2019 & 2032
- Table 35: North Africa Copper Ethernet Cables Revenue (million) Forecast, by Application 2019 & 2032
- Table 36: South Africa Copper Ethernet Cables Revenue (million) Forecast, by Application 2019 & 2032
- Table 37: Rest of Middle East & Africa Copper Ethernet Cables Revenue (million) Forecast, by Application 2019 & 2032
- Table 38: Global Copper Ethernet Cables Revenue million Forecast, by Application 2019 & 2032
- Table 39: Global Copper Ethernet Cables Revenue million Forecast, by Type 2019 & 2032
- Table 40: Global Copper Ethernet Cables Revenue million Forecast, by Country 2019 & 2032
- Table 41: China Copper Ethernet Cables Revenue (million) Forecast, by Application 2019 & 2032
- Table 42: India Copper Ethernet Cables Revenue (million) Forecast, by Application 2019 & 2032
- Table 43: Japan Copper Ethernet Cables Revenue (million) Forecast, by Application 2019 & 2032
- Table 44: South Korea Copper Ethernet Cables Revenue (million) Forecast, by Application 2019 & 2032
- Table 45: ASEAN Copper Ethernet Cables Revenue (million) Forecast, by Application 2019 & 2032
- Table 46: Oceania Copper Ethernet Cables Revenue (million) Forecast, by Application 2019 & 2032
- Table 47: Rest of Asia Pacific Copper Ethernet Cables Revenue (million) Forecast, by Application 2019 & 2032
Frequently Asked Questions
1. What is the projected Compound Annual Growth Rate (CAGR) of the Copper Ethernet Cables?
The projected CAGR is approximately XXX%.
2. Which companies are prominent players in the Copper Ethernet Cables?
Key companies in the market include CommScope, Panduit, PHILIPS, Siemon, Legrand, Belden, Corning, Schneider, Nexans, Datwyler, IBM, Eland Cables, Ship Group, DINTEK, Tsinghua Tongfang, Zhejiang Zhaolong Interconnect, Potevio, YOFC, Datang Telecom, TP-LINK, SAMZHE, CHOSEAL, TC Smart Systems, Zhejiang Headway Communication.
3. What are the main segments of the Copper Ethernet Cables?
The market segments include Application, Type.
4. Can you provide details about the market size?
The market size is estimated to be USD XXX million as of 2022.
5. What are some drivers contributing to market growth?
N/A
6. What are the notable trends driving market growth?
N/A
7. Are there any restraints impacting market growth?
N/A
8. Can you provide examples of recent developments in the market?
N/A
9. What pricing options are available for accessing the report?
Pricing options include single-user, multi-user, and enterprise licenses priced at USD 4250.00, USD 6375.00, and USD 8500.00 respectively.
10. Is the market size provided in terms of value or volume?
The market size is provided in terms of value, measured in million.
11. Are there any specific market keywords associated with the report?
Yes, the market keyword associated with the report is "Copper Ethernet Cables," which aids in identifying and referencing the specific market segment covered.
12. How do I determine which pricing option suits my needs best?
The pricing options vary based on user requirements and access needs. Individual users may opt for single-user licenses, while businesses requiring broader access may choose multi-user or enterprise licenses for cost-effective access to the report.
13. Are there any additional resources or data provided in the Copper Ethernet Cables report?
While the report offers comprehensive insights, it's advisable to review the specific contents or supplementary materials provided to ascertain if additional resources or data are available.
14. How can I stay updated on further developments or reports in the Copper Ethernet Cables?
To stay informed about further developments, trends, and reports in the Copper Ethernet Cables, consider subscribing to industry newsletters, following relevant companies and organizations, or regularly checking reputable industry news sources and publications.
Methodology
Step 1 - Identification of Relevant Samples Size from Population Database


Step 2 - Approaches for Defining Global Market Size (Value, Volume* & Price*)

Note*: In applicable scenarios
Step 3 - Data Sources
Primary Research
- Web Analytics
- Survey Reports
- Research Institute
- Latest Research Reports
- Opinion Leaders
Secondary Research
- Annual Reports
- White Paper
- Latest Press Release
- Industry Association
- Paid Database
- Investor Presentations

Step 4 - Data Triangulation
Involves using different sources of information in order to increase the validity of a study
These sources are likely to be stakeholders in a program - participants, other researchers, program staff, other community members, and so on.
Then we put all data in single framework & apply various statistical tools to find out the dynamic on the market.
During the analysis stage, feedback from the stakeholder groups would be compared to determine areas of agreement as well as areas of divergence


