
Key Insights
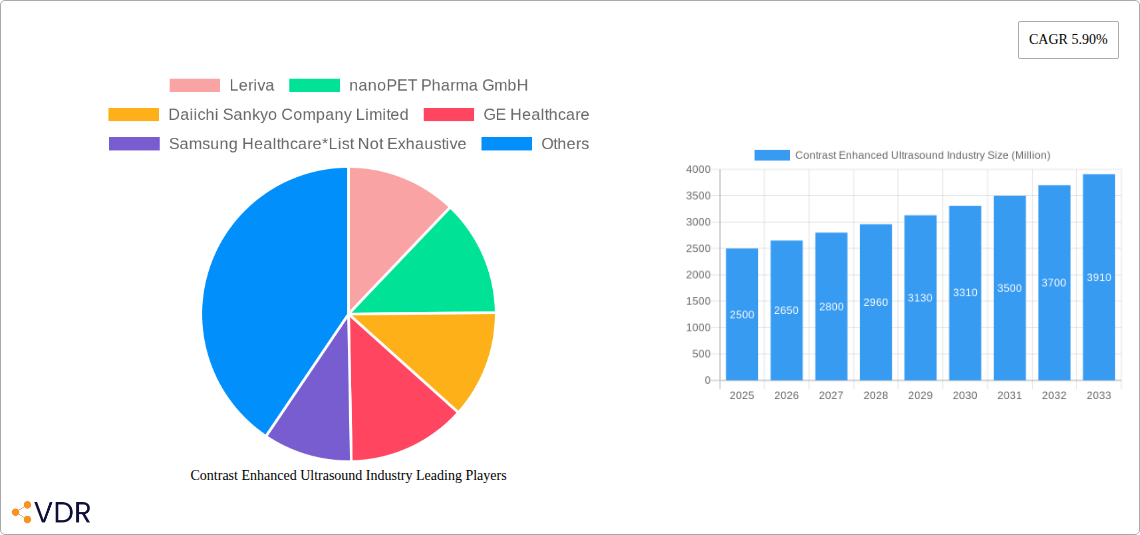
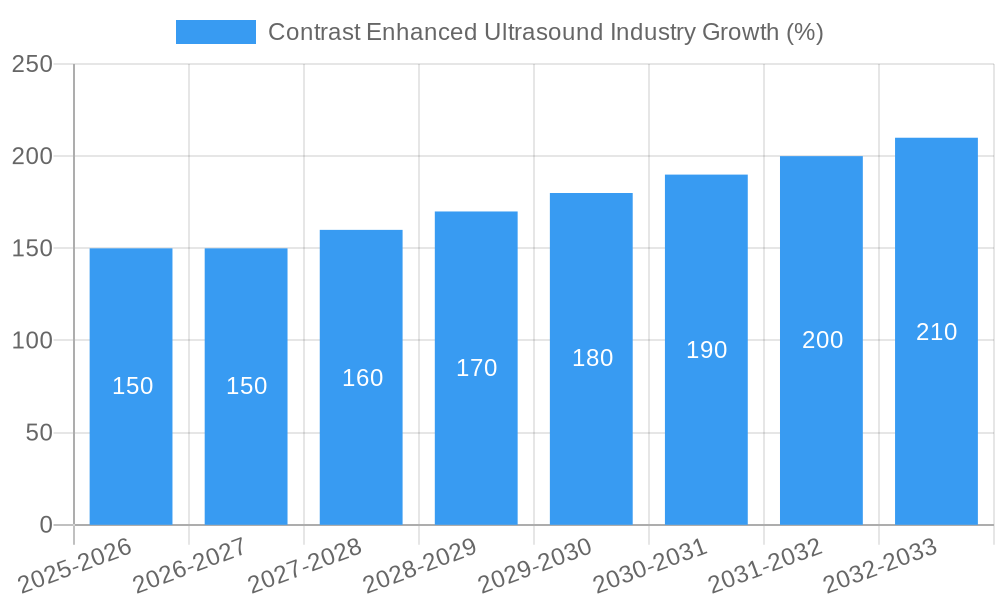
The Contrast Enhanced Ultrasound (CEUS) market is experiencing robust growth, driven by the increasing prevalence of various diseases requiring accurate and timely diagnosis, coupled with the advantages CEUS offers over other imaging modalities. The market's 5.90% CAGR indicates a steady expansion projected through 2033. This growth is fueled by several key factors, including the rising adoption of CEUS in liver, breast, and thyroid assessments, where its ability to provide real-time, high-resolution images with minimal invasiveness proves invaluable. Technological advancements, such as the development of more sophisticated contrast agents and targeted imaging techniques, are further enhancing the capabilities and clinical utility of CEUS, leading to increased demand. Furthermore, the relatively lower cost and ease of use compared to other advanced imaging technologies like MRI or CT scans make CEUS a more accessible and cost-effective option for healthcare providers, particularly in developing economies. The market segmentation reveals a significant share for equipment, highlighting the importance of technological innovation in driving market growth. Key players like GE Healthcare, Siemens Healthineers, and Bracco are actively involved in developing and deploying advanced CEUS equipment and contrast agents, intensifying competition and driving innovation.
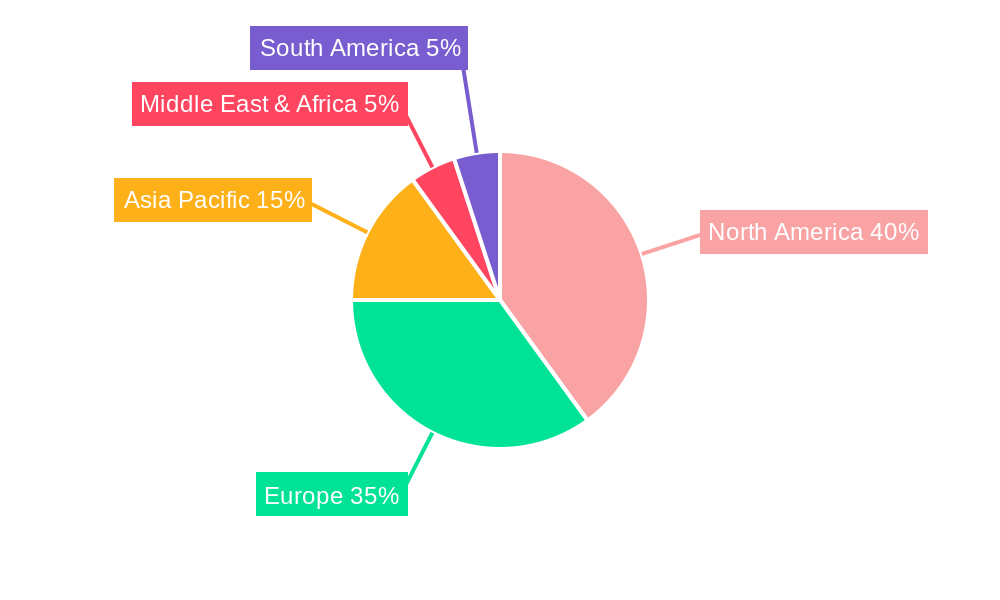
Regional analysis shows strong performance across North America and Europe, driven by established healthcare infrastructure and high adoption rates. However, Asia-Pacific is poised for substantial growth in the coming years, driven by increasing healthcare expenditure and growing awareness of advanced imaging techniques. The market faces some restraints, including the potential for adverse reactions to contrast agents and the need for skilled technicians for optimal image acquisition and interpretation. Despite these challenges, the continued focus on improving image quality, developing more specific contrast agents, and expanding clinical applications will ensure that the CEUS market maintains its upward trajectory in the foreseeable future. The market size in 2025 is estimated at $2.5 billion based on available data and reasonable estimations using industry averages for similar markets.
Contrast Enhanced Ultrasound (CEUS) Industry Report: 2019-2033
This comprehensive report provides an in-depth analysis of the Contrast Enhanced Ultrasound (CEUS) industry, encompassing market dynamics, growth trends, regional dominance, product landscape, key players, and future outlook. The report covers the period from 2019 to 2033, with a focus on the forecast period of 2025-2033 and a base year of 2025. The study meticulously examines both parent (medical imaging) and child (contrast enhanced ultrasound) markets. The total market size is estimated to be XX million units in 2025 and is projected to reach XX million units by 2033.
Contrast Enhanced Ultrasound Industry Market Dynamics & Structure
The CEUS market is characterized by a moderately concentrated landscape, with key players like GE Healthcare, Philips, and Siemens Healthineers holding significant market share. However, the emergence of innovative companies such as Leriva and nanoPET Pharma GmbH signals increasing competition. Technological advancements, particularly in targeted contrast agents and improved imaging technologies, are primary growth drivers. Stringent regulatory frameworks, including FDA approvals in the US, influence market access and adoption. The market faces competition from alternative imaging modalities like MRI and CT scans, but CEUS offers advantages in terms of cost-effectiveness, portability, and real-time imaging capabilities. The end-user demographics primarily comprise hospitals, diagnostic imaging centers, and clinics catering to a diverse range of patients. M&A activity in the sector has been moderate, with a focus on strategic acquisitions enhancing technological capabilities and expanding market reach. Over the historical period (2019-2024), approximately xx M&A deals were recorded in the sector. The market share of the top 5 players was around xx% in 2024.
- Market Concentration: Moderately concentrated, with significant players holding a major share.
- Technological Innovation: Key driver, focusing on targeted contrast agents and advanced imaging techniques.
- Regulatory Landscape: Stringent regulations influence market access and product approvals.
- Competitive Substitutes: MRI and CT scans pose competition, but CEUS offers advantages in cost and accessibility.
- End-User Demographics: Hospitals, diagnostic centers, and clinics form the primary user base.
- M&A Trends: Moderate activity, driven by expansion and technological integration strategies.
Contrast Enhanced Ultrasound Industry Growth Trends & Insights
The CEUS market has witnessed consistent growth over the historical period (2019-2024), driven by factors including increasing prevalence of liver diseases, technological advancements, rising healthcare expenditure, and growing awareness among healthcare professionals. The market is experiencing a steady adoption rate, with significant growth projected in the forecast period (2025-2033). The Compound Annual Growth Rate (CAGR) is estimated to be xx% during this period. Technological disruptions, such as the introduction of novel contrast agents and improved ultrasound systems with enhanced functionalities, are further propelling market expansion. Shifting consumer behavior, focusing on minimally invasive procedures and improved diagnostic accuracy, contributes significantly to market growth. The market penetration rate is projected to increase from xx% in 2025 to xx% in 2033.
Dominant Regions, Countries, or Segments in Contrast Enhanced Ultrasound Industry
North America currently holds the largest market share in the CEUS industry, driven by high healthcare expenditure, advanced infrastructure, and early adoption of innovative technologies. Within North America, the United States is the leading market. Europe follows as a significant regional market, with Germany and France showing substantial growth. The Asia-Pacific region is witnessing rapid expansion, fueled by increasing healthcare investments, growing awareness of liver diseases, and rising disposable incomes.
By Product Type: The equipment segment dominates, with a higher market share than contrast agents. Technological advancements in ultrasound equipment are a crucial driver.
By Technology: The non-targeted contrast agent segment currently holds a larger market share due to its wide applicability and established presence. However, targeted contrast agents are expected to witness faster growth in the forecast period due to increasing demand for improved diagnostic accuracy and therapeutic guidance.
- North America: High healthcare expenditure, advanced infrastructure, and early adoption of new technologies are key drivers.
- Europe: Significant market, driven by Germany and France, with substantial growth potential.
- Asia-Pacific: Rapid expansion fuelled by healthcare investments, rising awareness of liver diseases, and increased disposable incomes.
- By Product Type (Equipment vs. Contrast Agents): Equipment segment dominates.
- By Technology (Targeted vs. Non-Targeted): Non-targeted holds a larger share but targeted is expected to show faster growth.
Contrast Enhanced Ultrasound Industry Product Landscape
The CEUS product landscape features diverse equipment, including high-end ultrasound systems with advanced functionalities like real-time shear wave elastography and sophisticated contrast agents tailored for specific applications. These products offer improved diagnostic accuracy, reduced procedure time, and enhanced patient comfort. Unique selling propositions (USPs) include improved image quality, advanced visualization techniques, and enhanced workflow efficiency. Continuous technological advancements, particularly in contrast agent design and system integration, are shaping the product landscape.
Key Drivers, Barriers & Challenges in Contrast Enhanced Ultrasound Industry
Key Drivers:
- Technological advancements in ultrasound systems and contrast agents.
- Rising prevalence of liver and other targeted diseases.
- Increased healthcare expenditure and improved healthcare infrastructure.
- Growing awareness amongst healthcare professionals about the advantages of CEUS.
Challenges & Restraints:
- High cost of equipment and contrast agents can limit accessibility in certain regions.
- Stringent regulatory approvals can slow down market entry for new products.
- Competition from alternative imaging techniques can affect market share.
- The potential for adverse reactions from the contrast agents could impact the market. This effect is estimated to reduce market growth by xx% in the coming years.
Emerging Opportunities in Contrast Enhanced Ultrasound Industry
- Expansion into untapped markets in developing countries.
- Development of innovative contrast agents with improved safety and efficacy.
- Growing use of CEUS in areas such as oncology, cardiology, and musculoskeletal imaging.
- Integration of CEUS with other imaging modalities like CT and MRI for enhanced diagnostic capabilities.
Growth Accelerators in the Contrast Enhanced Ultrasound Industry
Technological advancements in contrast agent formulation and ultrasound system capabilities, coupled with strategic partnerships and collaborations between technology providers and healthcare institutions, are accelerating market growth. Expansion into emerging markets and increasing awareness of CEUS's advantages are further propelling the market's long-term expansion.
Key Players Shaping the Contrast Enhanced Ultrasound Industry Market
- Leriva
- nanoPET Pharma GmbH
- Daiichi Sankyo Company Limited
- GE Healthcare
- Samsung Healthcare
- Trivitron Healthcare Pvt Ltd
- Siemens Healthineers AG
- Lantheus Medical Imaging Inc
- Bracco Diagnostic Inc
- Koninklijke Philips NV
- Esaote SPA
- Shenzhen Mindray Bio-Medical Electronics Co Ltd
Notable Milestones in Contrast Enhanced Ultrasound Industry Sector
- June 2022: Siemens Healthineers launched its refreshed Acuson ultrasound systems, including new transducers with CEUS capabilities.
- November 2021: Royal Philips received FDA clearance for Liver Fat Quantification tools integrated into its ultrasound systems.
In-Depth Contrast Enhanced Ultrasound Industry Market Outlook
The CEUS market holds significant potential for growth, driven by continuous technological innovation, expanding applications, and increasing adoption across various medical specialties. Strategic partnerships and market expansion initiatives will further shape the market's future trajectory, presenting lucrative opportunities for both established players and emerging companies. The long-term outlook is positive, with consistent growth expected in the coming years.
Contrast Enhanced Ultrasound Industry Segmentation
-
1. Product Type
- 1.1. Equipment
- 1.2. Contrast Agents
-
2. Technology
- 2.1. Non-targeted
- 2.2. Targeted
Contrast Enhanced Ultrasound Industry Segmentation By Geography
-
1. North America
- 1.1. United States
- 1.2. Canada
- 1.3. Mexico
-
2. Europe
- 2.1. Germany
- 2.2. United Kingdom
- 2.3. France
- 2.4. Italy
- 2.5. Spain
- 2.6. Rest of Europe
-
3. Asia Pacific
- 3.1. China
- 3.2. Japan
- 3.3. India
- 3.4. Australia
- 3.5. South Korea
- 3.6. Rest of Asia Pacific
-
4. Middle East and Africa
- 4.1. GCC
- 4.2. South Africa
- 4.3. Rest of Middle East and Africa
-
5. South America
- 5.1. Brazil
- 5.2. Argentina
- 5.3. Rest of South America
Contrast Enhanced Ultrasound Industry REPORT HIGHLIGHTS
| Aspects | Details |
|---|---|
| Study Period | 2019-2033 |
| Base Year | 2024 |
| Estimated Year | 2025 |
| Forecast Period | 2025-2033 |
| Historical Period | 2019-2024 |
| Growth Rate | CAGR of 5.90% from 2019-2033 |
| Segmentation |
|
Table of Contents
- 1. Introduction
- 1.1. Research Scope
- 1.2. Market Segmentation
- 1.3. Research Methodology
- 1.4. Definitions and Assumptions
- 2. Executive Summary
- 2.1. Introduction
- 3. Market Dynamics
- 3.1. Introduction
- 3.2. Market Drivers
- 3.2.1. Increasing Prevalence of Long-term Diseases and Complex Comorbidities; Technical Advancements in Contrast-enhanced Ultrasound Imaging; Increasing Investments by Government and Private Organization
- 3.3. Market Restrains
- 3.3.1. High Cost Associated with the Devices and Procedures; Shortage of Helium
- 3.4. Market Trends
- 3.4.1. Contrast Agent Segment is Expected to Grow During the Forecast Period
- 4. Market Factor Analysis
- 4.1. Porters Five Forces
- 4.2. Supply/Value Chain
- 4.3. PESTEL analysis
- 4.4. Market Entropy
- 4.5. Patent/Trademark Analysis
- 5. Global Contrast Enhanced Ultrasound Industry Analysis, Insights and Forecast, 2019-2031
- 5.1. Market Analysis, Insights and Forecast - by Product Type
- 5.1.1. Equipment
- 5.1.2. Contrast Agents
- 5.2. Market Analysis, Insights and Forecast - by Technology
- 5.2.1. Non-targeted
- 5.2.2. Targeted
- 5.3. Market Analysis, Insights and Forecast - by Region
- 5.3.1. North America
- 5.3.2. Europe
- 5.3.3. Asia Pacific
- 5.3.4. Middle East and Africa
- 5.3.5. South America
- 5.1. Market Analysis, Insights and Forecast - by Product Type
- 6. North America Contrast Enhanced Ultrasound Industry Analysis, Insights and Forecast, 2019-2031
- 6.1. Market Analysis, Insights and Forecast - by Product Type
- 6.1.1. Equipment
- 6.1.2. Contrast Agents
- 6.2. Market Analysis, Insights and Forecast - by Technology
- 6.2.1. Non-targeted
- 6.2.2. Targeted
- 6.1. Market Analysis, Insights and Forecast - by Product Type
- 7. Europe Contrast Enhanced Ultrasound Industry Analysis, Insights and Forecast, 2019-2031
- 7.1. Market Analysis, Insights and Forecast - by Product Type
- 7.1.1. Equipment
- 7.1.2. Contrast Agents
- 7.2. Market Analysis, Insights and Forecast - by Technology
- 7.2.1. Non-targeted
- 7.2.2. Targeted
- 7.1. Market Analysis, Insights and Forecast - by Product Type
- 8. Asia Pacific Contrast Enhanced Ultrasound Industry Analysis, Insights and Forecast, 2019-2031
- 8.1. Market Analysis, Insights and Forecast - by Product Type
- 8.1.1. Equipment
- 8.1.2. Contrast Agents
- 8.2. Market Analysis, Insights and Forecast - by Technology
- 8.2.1. Non-targeted
- 8.2.2. Targeted
- 8.1. Market Analysis, Insights and Forecast - by Product Type
- 9. Middle East and Africa Contrast Enhanced Ultrasound Industry Analysis, Insights and Forecast, 2019-2031
- 9.1. Market Analysis, Insights and Forecast - by Product Type
- 9.1.1. Equipment
- 9.1.2. Contrast Agents
- 9.2. Market Analysis, Insights and Forecast - by Technology
- 9.2.1. Non-targeted
- 9.2.2. Targeted
- 9.1. Market Analysis, Insights and Forecast - by Product Type
- 10. South America Contrast Enhanced Ultrasound Industry Analysis, Insights and Forecast, 2019-2031
- 10.1. Market Analysis, Insights and Forecast - by Product Type
- 10.1.1. Equipment
- 10.1.2. Contrast Agents
- 10.2. Market Analysis, Insights and Forecast - by Technology
- 10.2.1. Non-targeted
- 10.2.2. Targeted
- 10.1. Market Analysis, Insights and Forecast - by Product Type
- 11. North America Contrast Enhanced Ultrasound Industry Analysis, Insights and Forecast, 2019-2031
- 11.1. Market Analysis, Insights and Forecast - By Country/Sub-region
- 11.1.1 United States
- 11.1.2 Canada
- 11.1.3 Mexico
- 12. Europe Contrast Enhanced Ultrasound Industry Analysis, Insights and Forecast, 2019-2031
- 12.1. Market Analysis, Insights and Forecast - By Country/Sub-region
- 12.1.1 Germany
- 12.1.2 United Kingdom
- 12.1.3 France
- 12.1.4 Italy
- 12.1.5 Spain
- 12.1.6 Rest of Europe
- 13. Asia Pacific Contrast Enhanced Ultrasound Industry Analysis, Insights and Forecast, 2019-2031
- 13.1. Market Analysis, Insights and Forecast - By Country/Sub-region
- 13.1.1 China
- 13.1.2 Japan
- 13.1.3 India
- 13.1.4 Australia
- 13.1.5 South Korea
- 13.1.6 Rest of Asia Pacific
- 14. Middle East and Africa Contrast Enhanced Ultrasound Industry Analysis, Insights and Forecast, 2019-2031
- 14.1. Market Analysis, Insights and Forecast - By Country/Sub-region
- 14.1.1 GCC
- 14.1.2 South Africa
- 14.1.3 Rest of Middle East and Africa
- 15. South America Contrast Enhanced Ultrasound Industry Analysis, Insights and Forecast, 2019-2031
- 15.1. Market Analysis, Insights and Forecast - By Country/Sub-region
- 15.1.1 Brazil
- 15.1.2 Argentina
- 15.1.3 Rest of South America
- 16. Competitive Analysis
- 16.1. Global Market Share Analysis 2024
- 16.2. Company Profiles
- 16.2.1 Leriva
- 16.2.1.1. Overview
- 16.2.1.2. Products
- 16.2.1.3. SWOT Analysis
- 16.2.1.4. Recent Developments
- 16.2.1.5. Financials (Based on Availability)
- 16.2.2 nanoPET Pharma GmbH
- 16.2.2.1. Overview
- 16.2.2.2. Products
- 16.2.2.3. SWOT Analysis
- 16.2.2.4. Recent Developments
- 16.2.2.5. Financials (Based on Availability)
- 16.2.3 Daiichi Sankyo Company Limited
- 16.2.3.1. Overview
- 16.2.3.2. Products
- 16.2.3.3. SWOT Analysis
- 16.2.3.4. Recent Developments
- 16.2.3.5. Financials (Based on Availability)
- 16.2.4 GE Healthcare
- 16.2.4.1. Overview
- 16.2.4.2. Products
- 16.2.4.3. SWOT Analysis
- 16.2.4.4. Recent Developments
- 16.2.4.5. Financials (Based on Availability)
- 16.2.5 Samsung Healthcare*List Not Exhaustive
- 16.2.5.1. Overview
- 16.2.5.2. Products
- 16.2.5.3. SWOT Analysis
- 16.2.5.4. Recent Developments
- 16.2.5.5. Financials (Based on Availability)
- 16.2.6 Trivitron Healthcare Pvt Ltd
- 16.2.6.1. Overview
- 16.2.6.2. Products
- 16.2.6.3. SWOT Analysis
- 16.2.6.4. Recent Developments
- 16.2.6.5. Financials (Based on Availability)
- 16.2.7 Siemens Healthineers AG
- 16.2.7.1. Overview
- 16.2.7.2. Products
- 16.2.7.3. SWOT Analysis
- 16.2.7.4. Recent Developments
- 16.2.7.5. Financials (Based on Availability)
- 16.2.8 Lantheus Medical Imaging Inc
- 16.2.8.1. Overview
- 16.2.8.2. Products
- 16.2.8.3. SWOT Analysis
- 16.2.8.4. Recent Developments
- 16.2.8.5. Financials (Based on Availability)
- 16.2.9 Bracco Diagnostic Inc
- 16.2.9.1. Overview
- 16.2.9.2. Products
- 16.2.9.3. SWOT Analysis
- 16.2.9.4. Recent Developments
- 16.2.9.5. Financials (Based on Availability)
- 16.2.10 Koninklijke Philips NV
- 16.2.10.1. Overview
- 16.2.10.2. Products
- 16.2.10.3. SWOT Analysis
- 16.2.10.4. Recent Developments
- 16.2.10.5. Financials (Based on Availability)
- 16.2.11 Esaote SPA
- 16.2.11.1. Overview
- 16.2.11.2. Products
- 16.2.11.3. SWOT Analysis
- 16.2.11.4. Recent Developments
- 16.2.11.5. Financials (Based on Availability)
- 16.2.12 Shenzhen Mindray Bio-Medical Electronics Co Ltd
- 16.2.12.1. Overview
- 16.2.12.2. Products
- 16.2.12.3. SWOT Analysis
- 16.2.12.4. Recent Developments
- 16.2.12.5. Financials (Based on Availability)
- 16.2.1 Leriva
List of Figures
- Figure 1: Global Contrast Enhanced Ultrasound Industry Revenue Breakdown (Million, %) by Region 2024 & 2032
- Figure 2: North America Contrast Enhanced Ultrasound Industry Revenue (Million), by Country 2024 & 2032
- Figure 3: North America Contrast Enhanced Ultrasound Industry Revenue Share (%), by Country 2024 & 2032
- Figure 4: Europe Contrast Enhanced Ultrasound Industry Revenue (Million), by Country 2024 & 2032
- Figure 5: Europe Contrast Enhanced Ultrasound Industry Revenue Share (%), by Country 2024 & 2032
- Figure 6: Asia Pacific Contrast Enhanced Ultrasound Industry Revenue (Million), by Country 2024 & 2032
- Figure 7: Asia Pacific Contrast Enhanced Ultrasound Industry Revenue Share (%), by Country 2024 & 2032
- Figure 8: Middle East and Africa Contrast Enhanced Ultrasound Industry Revenue (Million), by Country 2024 & 2032
- Figure 9: Middle East and Africa Contrast Enhanced Ultrasound Industry Revenue Share (%), by Country 2024 & 2032
- Figure 10: South America Contrast Enhanced Ultrasound Industry Revenue (Million), by Country 2024 & 2032
- Figure 11: South America Contrast Enhanced Ultrasound Industry Revenue Share (%), by Country 2024 & 2032
- Figure 12: North America Contrast Enhanced Ultrasound Industry Revenue (Million), by Product Type 2024 & 2032
- Figure 13: North America Contrast Enhanced Ultrasound Industry Revenue Share (%), by Product Type 2024 & 2032
- Figure 14: North America Contrast Enhanced Ultrasound Industry Revenue (Million), by Technology 2024 & 2032
- Figure 15: North America Contrast Enhanced Ultrasound Industry Revenue Share (%), by Technology 2024 & 2032
- Figure 16: North America Contrast Enhanced Ultrasound Industry Revenue (Million), by Country 2024 & 2032
- Figure 17: North America Contrast Enhanced Ultrasound Industry Revenue Share (%), by Country 2024 & 2032
- Figure 18: Europe Contrast Enhanced Ultrasound Industry Revenue (Million), by Product Type 2024 & 2032
- Figure 19: Europe Contrast Enhanced Ultrasound Industry Revenue Share (%), by Product Type 2024 & 2032
- Figure 20: Europe Contrast Enhanced Ultrasound Industry Revenue (Million), by Technology 2024 & 2032
- Figure 21: Europe Contrast Enhanced Ultrasound Industry Revenue Share (%), by Technology 2024 & 2032
- Figure 22: Europe Contrast Enhanced Ultrasound Industry Revenue (Million), by Country 2024 & 2032
- Figure 23: Europe Contrast Enhanced Ultrasound Industry Revenue Share (%), by Country 2024 & 2032
- Figure 24: Asia Pacific Contrast Enhanced Ultrasound Industry Revenue (Million), by Product Type 2024 & 2032
- Figure 25: Asia Pacific Contrast Enhanced Ultrasound Industry Revenue Share (%), by Product Type 2024 & 2032
- Figure 26: Asia Pacific Contrast Enhanced Ultrasound Industry Revenue (Million), by Technology 2024 & 2032
- Figure 27: Asia Pacific Contrast Enhanced Ultrasound Industry Revenue Share (%), by Technology 2024 & 2032
- Figure 28: Asia Pacific Contrast Enhanced Ultrasound Industry Revenue (Million), by Country 2024 & 2032
- Figure 29: Asia Pacific Contrast Enhanced Ultrasound Industry Revenue Share (%), by Country 2024 & 2032
- Figure 30: Middle East and Africa Contrast Enhanced Ultrasound Industry Revenue (Million), by Product Type 2024 & 2032
- Figure 31: Middle East and Africa Contrast Enhanced Ultrasound Industry Revenue Share (%), by Product Type 2024 & 2032
- Figure 32: Middle East and Africa Contrast Enhanced Ultrasound Industry Revenue (Million), by Technology 2024 & 2032
- Figure 33: Middle East and Africa Contrast Enhanced Ultrasound Industry Revenue Share (%), by Technology 2024 & 2032
- Figure 34: Middle East and Africa Contrast Enhanced Ultrasound Industry Revenue (Million), by Country 2024 & 2032
- Figure 35: Middle East and Africa Contrast Enhanced Ultrasound Industry Revenue Share (%), by Country 2024 & 2032
- Figure 36: South America Contrast Enhanced Ultrasound Industry Revenue (Million), by Product Type 2024 & 2032
- Figure 37: South America Contrast Enhanced Ultrasound Industry Revenue Share (%), by Product Type 2024 & 2032
- Figure 38: South America Contrast Enhanced Ultrasound Industry Revenue (Million), by Technology 2024 & 2032
- Figure 39: South America Contrast Enhanced Ultrasound Industry Revenue Share (%), by Technology 2024 & 2032
- Figure 40: South America Contrast Enhanced Ultrasound Industry Revenue (Million), by Country 2024 & 2032
- Figure 41: South America Contrast Enhanced Ultrasound Industry Revenue Share (%), by Country 2024 & 2032
List of Tables
- Table 1: Global Contrast Enhanced Ultrasound Industry Revenue Million Forecast, by Region 2019 & 2032
- Table 2: Global Contrast Enhanced Ultrasound Industry Revenue Million Forecast, by Product Type 2019 & 2032
- Table 3: Global Contrast Enhanced Ultrasound Industry Revenue Million Forecast, by Technology 2019 & 2032
- Table 4: Global Contrast Enhanced Ultrasound Industry Revenue Million Forecast, by Region 2019 & 2032
- Table 5: Global Contrast Enhanced Ultrasound Industry Revenue Million Forecast, by Country 2019 & 2032
- Table 6: United States Contrast Enhanced Ultrasound Industry Revenue (Million) Forecast, by Application 2019 & 2032
- Table 7: Canada Contrast Enhanced Ultrasound Industry Revenue (Million) Forecast, by Application 2019 & 2032
- Table 8: Mexico Contrast Enhanced Ultrasound Industry Revenue (Million) Forecast, by Application 2019 & 2032
- Table 9: Global Contrast Enhanced Ultrasound Industry Revenue Million Forecast, by Country 2019 & 2032
- Table 10: Germany Contrast Enhanced Ultrasound Industry Revenue (Million) Forecast, by Application 2019 & 2032
- Table 11: United Kingdom Contrast Enhanced Ultrasound Industry Revenue (Million) Forecast, by Application 2019 & 2032
- Table 12: France Contrast Enhanced Ultrasound Industry Revenue (Million) Forecast, by Application 2019 & 2032
- Table 13: Italy Contrast Enhanced Ultrasound Industry Revenue (Million) Forecast, by Application 2019 & 2032
- Table 14: Spain Contrast Enhanced Ultrasound Industry Revenue (Million) Forecast, by Application 2019 & 2032
- Table 15: Rest of Europe Contrast Enhanced Ultrasound Industry Revenue (Million) Forecast, by Application 2019 & 2032
- Table 16: Global Contrast Enhanced Ultrasound Industry Revenue Million Forecast, by Country 2019 & 2032
- Table 17: China Contrast Enhanced Ultrasound Industry Revenue (Million) Forecast, by Application 2019 & 2032
- Table 18: Japan Contrast Enhanced Ultrasound Industry Revenue (Million) Forecast, by Application 2019 & 2032
- Table 19: India Contrast Enhanced Ultrasound Industry Revenue (Million) Forecast, by Application 2019 & 2032
- Table 20: Australia Contrast Enhanced Ultrasound Industry Revenue (Million) Forecast, by Application 2019 & 2032
- Table 21: South Korea Contrast Enhanced Ultrasound Industry Revenue (Million) Forecast, by Application 2019 & 2032
- Table 22: Rest of Asia Pacific Contrast Enhanced Ultrasound Industry Revenue (Million) Forecast, by Application 2019 & 2032
- Table 23: Global Contrast Enhanced Ultrasound Industry Revenue Million Forecast, by Country 2019 & 2032
- Table 24: GCC Contrast Enhanced Ultrasound Industry Revenue (Million) Forecast, by Application 2019 & 2032
- Table 25: South Africa Contrast Enhanced Ultrasound Industry Revenue (Million) Forecast, by Application 2019 & 2032
- Table 26: Rest of Middle East and Africa Contrast Enhanced Ultrasound Industry Revenue (Million) Forecast, by Application 2019 & 2032
- Table 27: Global Contrast Enhanced Ultrasound Industry Revenue Million Forecast, by Country 2019 & 2032
- Table 28: Brazil Contrast Enhanced Ultrasound Industry Revenue (Million) Forecast, by Application 2019 & 2032
- Table 29: Argentina Contrast Enhanced Ultrasound Industry Revenue (Million) Forecast, by Application 2019 & 2032
- Table 30: Rest of South America Contrast Enhanced Ultrasound Industry Revenue (Million) Forecast, by Application 2019 & 2032
- Table 31: Global Contrast Enhanced Ultrasound Industry Revenue Million Forecast, by Product Type 2019 & 2032
- Table 32: Global Contrast Enhanced Ultrasound Industry Revenue Million Forecast, by Technology 2019 & 2032
- Table 33: Global Contrast Enhanced Ultrasound Industry Revenue Million Forecast, by Country 2019 & 2032
- Table 34: United States Contrast Enhanced Ultrasound Industry Revenue (Million) Forecast, by Application 2019 & 2032
- Table 35: Canada Contrast Enhanced Ultrasound Industry Revenue (Million) Forecast, by Application 2019 & 2032
- Table 36: Mexico Contrast Enhanced Ultrasound Industry Revenue (Million) Forecast, by Application 2019 & 2032
- Table 37: Global Contrast Enhanced Ultrasound Industry Revenue Million Forecast, by Product Type 2019 & 2032
- Table 38: Global Contrast Enhanced Ultrasound Industry Revenue Million Forecast, by Technology 2019 & 2032
- Table 39: Global Contrast Enhanced Ultrasound Industry Revenue Million Forecast, by Country 2019 & 2032
- Table 40: Germany Contrast Enhanced Ultrasound Industry Revenue (Million) Forecast, by Application 2019 & 2032
- Table 41: United Kingdom Contrast Enhanced Ultrasound Industry Revenue (Million) Forecast, by Application 2019 & 2032
- Table 42: France Contrast Enhanced Ultrasound Industry Revenue (Million) Forecast, by Application 2019 & 2032
- Table 43: Italy Contrast Enhanced Ultrasound Industry Revenue (Million) Forecast, by Application 2019 & 2032
- Table 44: Spain Contrast Enhanced Ultrasound Industry Revenue (Million) Forecast, by Application 2019 & 2032
- Table 45: Rest of Europe Contrast Enhanced Ultrasound Industry Revenue (Million) Forecast, by Application 2019 & 2032
- Table 46: Global Contrast Enhanced Ultrasound Industry Revenue Million Forecast, by Product Type 2019 & 2032
- Table 47: Global Contrast Enhanced Ultrasound Industry Revenue Million Forecast, by Technology 2019 & 2032
- Table 48: Global Contrast Enhanced Ultrasound Industry Revenue Million Forecast, by Country 2019 & 2032
- Table 49: China Contrast Enhanced Ultrasound Industry Revenue (Million) Forecast, by Application 2019 & 2032
- Table 50: Japan Contrast Enhanced Ultrasound Industry Revenue (Million) Forecast, by Application 2019 & 2032
- Table 51: India Contrast Enhanced Ultrasound Industry Revenue (Million) Forecast, by Application 2019 & 2032
- Table 52: Australia Contrast Enhanced Ultrasound Industry Revenue (Million) Forecast, by Application 2019 & 2032
- Table 53: South Korea Contrast Enhanced Ultrasound Industry Revenue (Million) Forecast, by Application 2019 & 2032
- Table 54: Rest of Asia Pacific Contrast Enhanced Ultrasound Industry Revenue (Million) Forecast, by Application 2019 & 2032
- Table 55: Global Contrast Enhanced Ultrasound Industry Revenue Million Forecast, by Product Type 2019 & 2032
- Table 56: Global Contrast Enhanced Ultrasound Industry Revenue Million Forecast, by Technology 2019 & 2032
- Table 57: Global Contrast Enhanced Ultrasound Industry Revenue Million Forecast, by Country 2019 & 2032
- Table 58: GCC Contrast Enhanced Ultrasound Industry Revenue (Million) Forecast, by Application 2019 & 2032
- Table 59: South Africa Contrast Enhanced Ultrasound Industry Revenue (Million) Forecast, by Application 2019 & 2032
- Table 60: Rest of Middle East and Africa Contrast Enhanced Ultrasound Industry Revenue (Million) Forecast, by Application 2019 & 2032
- Table 61: Global Contrast Enhanced Ultrasound Industry Revenue Million Forecast, by Product Type 2019 & 2032
- Table 62: Global Contrast Enhanced Ultrasound Industry Revenue Million Forecast, by Technology 2019 & 2032
- Table 63: Global Contrast Enhanced Ultrasound Industry Revenue Million Forecast, by Country 2019 & 2032
- Table 64: Brazil Contrast Enhanced Ultrasound Industry Revenue (Million) Forecast, by Application 2019 & 2032
- Table 65: Argentina Contrast Enhanced Ultrasound Industry Revenue (Million) Forecast, by Application 2019 & 2032
- Table 66: Rest of South America Contrast Enhanced Ultrasound Industry Revenue (Million) Forecast, by Application 2019 & 2032
Frequently Asked Questions
1. What is the projected Compound Annual Growth Rate (CAGR) of the Contrast Enhanced Ultrasound Industry?
The projected CAGR is approximately 5.90%.
2. Which companies are prominent players in the Contrast Enhanced Ultrasound Industry?
Key companies in the market include Leriva, nanoPET Pharma GmbH, Daiichi Sankyo Company Limited, GE Healthcare, Samsung Healthcare*List Not Exhaustive, Trivitron Healthcare Pvt Ltd, Siemens Healthineers AG, Lantheus Medical Imaging Inc, Bracco Diagnostic Inc, Koninklijke Philips NV, Esaote SPA, Shenzhen Mindray Bio-Medical Electronics Co Ltd.
3. What are the main segments of the Contrast Enhanced Ultrasound Industry?
The market segments include Product Type, Technology.
4. Can you provide details about the market size?
The market size is estimated to be USD XX Million as of 2022.
5. What are some drivers contributing to market growth?
Increasing Prevalence of Long-term Diseases and Complex Comorbidities; Technical Advancements in Contrast-enhanced Ultrasound Imaging; Increasing Investments by Government and Private Organization.
6. What are the notable trends driving market growth?
Contrast Agent Segment is Expected to Grow During the Forecast Period.
7. Are there any restraints impacting market growth?
High Cost Associated with the Devices and Procedures; Shortage of Helium.
8. Can you provide examples of recent developments in the market?
In June 2022, Siemens Healthineers launched its refreshed Acuson family of ultrasounds at the European Congress of Radiology (ECR) in Vienna. The company introduced 12 new transducers across four ultrasound systems, including the Acuson Juniper 2.0 Integrated Battery Support. This allows up to 75 minutes of unplugged scanning for a rapid bedside assessment, and providers can access the new 6C1 single crystal transducer equipped with contrast-enhanced ultrasound (CEUS) and liver elastography to deliver a comprehensive liver evaluation.
9. What pricing options are available for accessing the report?
Pricing options include single-user, multi-user, and enterprise licenses priced at USD 4750, USD 5250, and USD 8750 respectively.
10. Is the market size provided in terms of value or volume?
The market size is provided in terms of value, measured in Million.
11. Are there any specific market keywords associated with the report?
Yes, the market keyword associated with the report is "Contrast Enhanced Ultrasound Industry," which aids in identifying and referencing the specific market segment covered.
12. How do I determine which pricing option suits my needs best?
The pricing options vary based on user requirements and access needs. Individual users may opt for single-user licenses, while businesses requiring broader access may choose multi-user or enterprise licenses for cost-effective access to the report.
13. Are there any additional resources or data provided in the Contrast Enhanced Ultrasound Industry report?
While the report offers comprehensive insights, it's advisable to review the specific contents or supplementary materials provided to ascertain if additional resources or data are available.
14. How can I stay updated on further developments or reports in the Contrast Enhanced Ultrasound Industry?
To stay informed about further developments, trends, and reports in the Contrast Enhanced Ultrasound Industry, consider subscribing to industry newsletters, following relevant companies and organizations, or regularly checking reputable industry news sources and publications.
Methodology
Step 1 - Identification of Relevant Samples Size from Population Database


Step 2 - Approaches for Defining Global Market Size (Value, Volume* & Price*)

Note*: In applicable scenarios
Step 3 - Data Sources
Primary Research
- Web Analytics
- Survey Reports
- Research Institute
- Latest Research Reports
- Opinion Leaders
Secondary Research
- Annual Reports
- White Paper
- Latest Press Release
- Industry Association
- Paid Database
- Investor Presentations

Step 4 - Data Triangulation
Involves using different sources of information in order to increase the validity of a study
These sources are likely to be stakeholders in a program - participants, other researchers, program staff, other community members, and so on.
Then we put all data in single framework & apply various statistical tools to find out the dynamic on the market.
During the analysis stage, feedback from the stakeholder groups would be compared to determine areas of agreement as well as areas of divergence


