
Key Insights
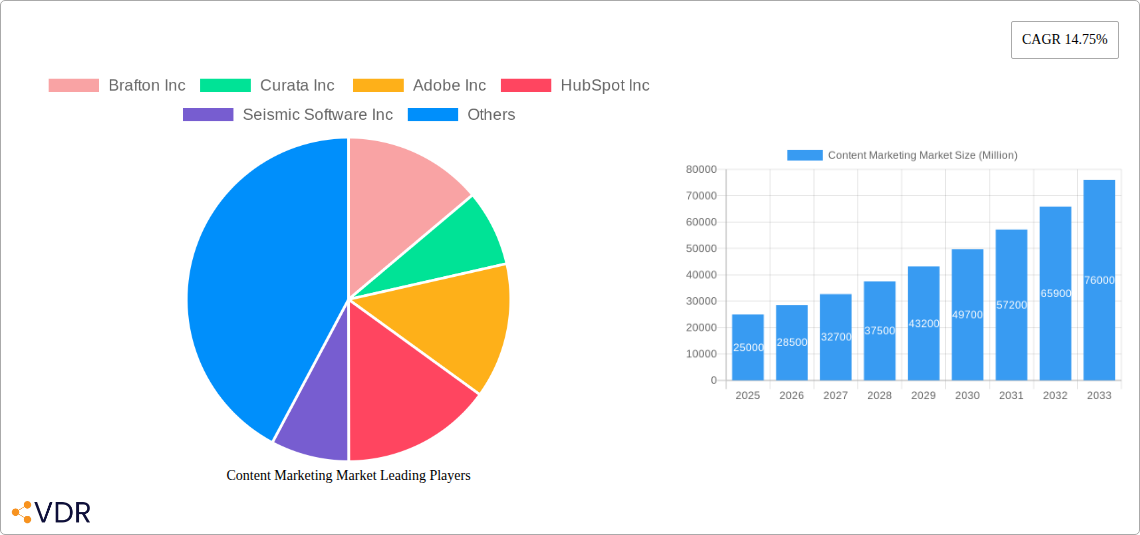
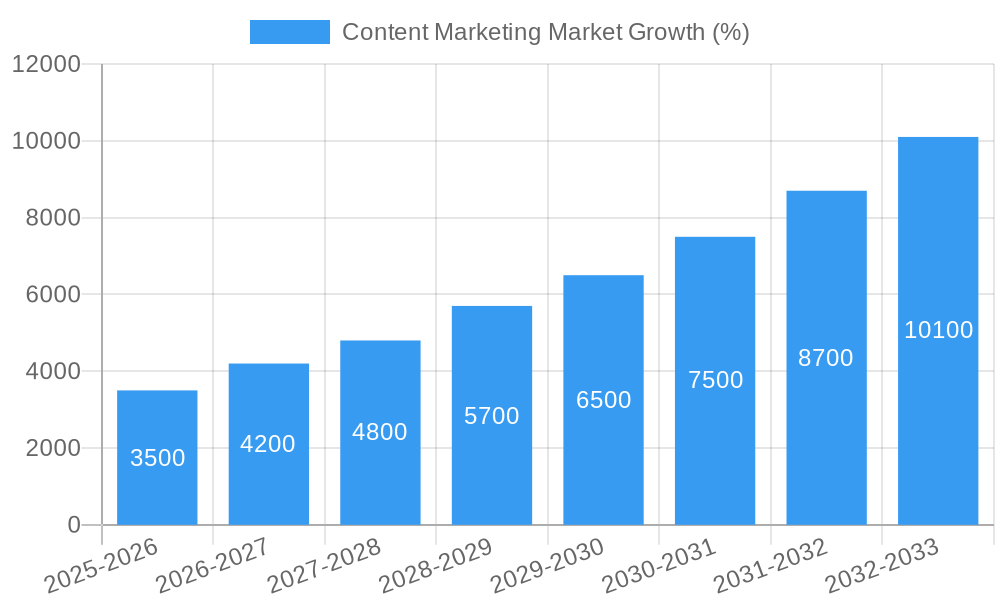
The global content marketing market is experiencing robust growth, projected to reach a significant size by 2033. A compound annual growth rate (CAGR) of 14.75% from 2025 to 2033 indicates substantial market expansion driven by several key factors. The increasing reliance on digital channels for brand building and customer engagement fuels demand for effective content strategies. Businesses across diverse sectors, including retail, BFSI (Banking, Financial Services, and Insurance), media and entertainment, and telecommunications, are heavily investing in content marketing to enhance brand awareness, generate leads, and drive sales. The market's segmentation into software, services, and various content platforms (blogging, videos, infographics, case studies) reflects its versatility and adaptability to evolving marketing needs. The rising adoption of data-driven content strategies and sophisticated analytics tools further contributes to market expansion. The competitive landscape involves both established players like Adobe and HubSpot and specialized content marketing agencies, indicating a dynamic and evolving market. Geographic expansion, particularly within rapidly developing economies in Asia-Pacific, presents significant growth opportunities for market participants.
Challenges to market growth include the ever-increasing costs associated with high-quality content creation and distribution. Furthermore, measuring the return on investment (ROI) for content marketing remains a hurdle for some businesses. The effectiveness of content marketing campaigns is highly dependent on understanding the target audience and creating relevant, engaging content; otherwise, it risks falling short of expectations. However, the ongoing evolution of content marketing strategies and technologies, combined with a growing appreciation for its long-term value, suggests that this market will continue its trajectory of impressive growth in the coming years. The increasing sophistication of content marketing analytics will also help overcome the ROI challenges, leading to greater market adoption.
Content Marketing Market: A Comprehensive Report (2019-2033)
This in-depth report provides a comprehensive analysis of the Content Marketing Market, encompassing market dynamics, growth trends, regional dominance, product landscape, key players, and future outlook. The study period covers 2019-2033, with 2025 as the base and estimated year. The report leverages extensive data analysis to provide actionable insights for industry professionals, investors, and businesses seeking to navigate this dynamic market. The parent market is the broader digital marketing industry, while the child market specifically focuses on content creation, strategy, and distribution.
Content Marketing Market Dynamics & Structure
The Content Marketing Market is characterized by a moderately concentrated landscape with several major players and a multitude of smaller niche providers. Technological innovation, particularly in AI-driven content creation and automation tools, is a significant driver of market growth. Regulatory frameworks concerning data privacy and advertising compliance influence market practices. Competitive product substitutes include traditional marketing channels, but content marketing's effectiveness in building brand loyalty and driving organic traffic sustains its demand. End-user demographics are broadening, with businesses of all sizes increasingly adopting content marketing strategies. Mergers and acquisitions are frequent, particularly among software and service providers aiming for greater market share.
- Market Concentration: Moderately concentrated, with top 10 players holding approximately xx% market share in 2024.
- Technological Innovation: AI-powered content creation, automation tools, and data analytics are key drivers.
- Regulatory Framework: GDPR, CCPA, and other data privacy regulations are shaping market practices.
- M&A Activity: An estimated xx M&A deals occurred between 2019 and 2024, with an average deal size of xx million.
- Innovation Barriers: High initial investment in technology and skilled personnel can be a barrier to entry for smaller players.
Content Marketing Market Growth Trends & Insights
The Content Marketing Market experienced significant growth during the historical period (2019-2024), with a CAGR of xx%. This growth is projected to continue during the forecast period (2025-2033), driven by increasing digital adoption, the rising importance of SEO, and the effectiveness of targeted content marketing campaigns in achieving marketing goals. Market penetration is expected to reach xx% by 2033, indicating significant growth potential. The shift toward personalized content and the increasing use of video and interactive content are major trends shaping consumer behavior. Technological disruptions, such as the rise of AI-driven content creation, are accelerating market transformation.
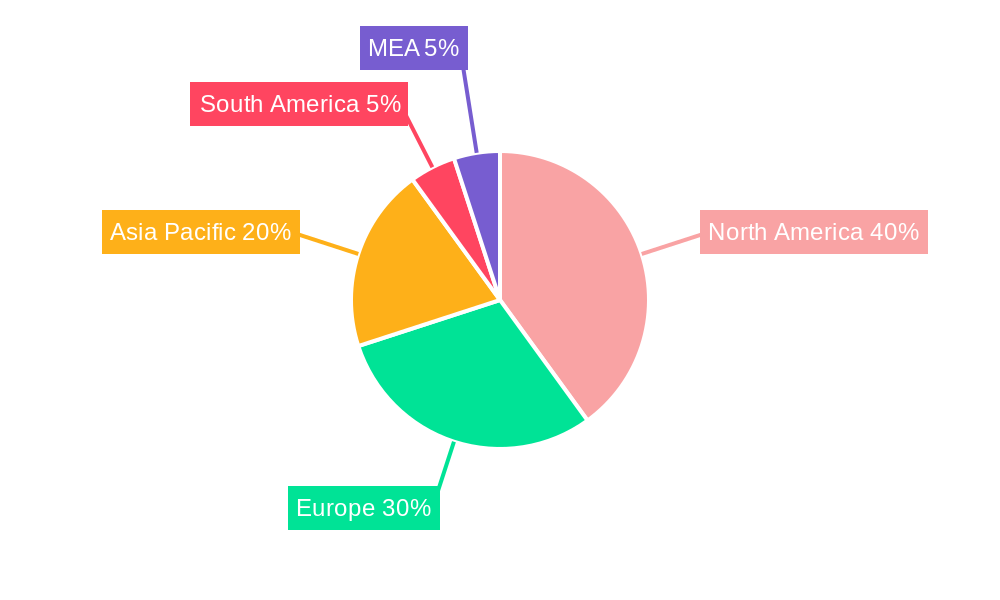
Dominant Regions, Countries, or Segments in Content Marketing Market
North America currently holds the largest market share, driven by high digital adoption rates and a mature marketing ecosystem. However, Asia-Pacific is showing the fastest growth, fueled by expanding internet penetration and increasing investment in digital marketing.
By Component: The software segment is the largest, owing to increasing demand for content management systems (CMS) and marketing automation platforms. The service segment is also experiencing substantial growth, driven by the need for specialized expertise in content strategy, creation, and optimization.
By Platform: Video marketing is witnessing rapid adoption due to its high engagement rates. Blogging remains a cornerstone of content marketing, followed by infographics and case studies.
By End-user Industry: Retail and BFSI sectors are significant adopters of content marketing, followed by Media and Entertainment and Telecom.
- North America Drivers: High digital literacy, advanced marketing infrastructure, and early adoption of new technologies.
- Asia-Pacific Drivers: Rapid internet penetration, growing mobile usage, and increasing investment in digital marketing.
- Software Segment Drivers: Demand for integrated marketing platforms, content automation tools, and data analytics capabilities.
- Video Marketing Drivers: High engagement rates, diverse content formats (live streaming, short-form videos), and accessibility on various platforms.
Content Marketing Market Product Landscape
The Content Marketing Market offers a wide array of products and services, ranging from sophisticated content management systems and marketing automation platforms to specialized services like content strategy consulting and SEO optimization. Product innovation focuses on AI-powered tools that automate content creation, enhance personalization, and improve content performance tracking. Key performance metrics include website traffic, engagement rates, lead generation, and conversion rates. Unique selling propositions often center on ease of use, scalability, and integration with other marketing tools.
Key Drivers, Barriers & Challenges in Content Marketing Market
Key Drivers:
- Increasing digitalization and adoption of online marketing strategies.
- The rising importance of SEO and organic traffic generation.
- Growing demand for personalized and engaging content experiences.
- Technological advancements in content creation and distribution.
Key Challenges:
- Measuring the ROI of content marketing campaigns effectively.
- The need for high-quality, engaging content creation.
- Keeping up with ever-changing search engine algorithms and user preferences.
- Maintaining consistency and brand voice across all content channels.
Emerging Opportunities in Content Marketing Market
- AI-driven content personalization: Delivering tailored experiences to individual users.
- Interactive content formats: Increasing user engagement and data collection opportunities.
- Growth in niche content marketing: Focusing on specific industries or demographics.
- Expansion into emerging markets: Reaching new audiences with localized content strategies.
Growth Accelerators in the Content Marketing Market Industry
Strategic partnerships between technology providers and content marketing agencies are creating innovative solutions. The expansion into emerging markets and the development of new content formats (e.g., interactive videos, AR/VR experiences) are fueling market growth. Technological breakthroughs in AI-driven content optimization and personalization are further accelerating adoption.
Key Players Shaping the Content Marketing Market Market
- Brafton Inc
- Curata Inc
- Adobe Inc
- HubSpot Inc
- Seismic Software Inc
- Contently Inc
- Influence and Co
- Hootsuite Inc
- Contentoo B V
- Upland Software Inc
Notable Milestones in Content Marketing Market Sector
- February 2023: Scalenut launched an AI-powered content optimization platform, enhancing SEO content creation.
- March 2023: IBM and Adobe partnered to optimize content supply chains for marketing and creative organizations.
In-Depth Content Marketing Market Outlook
The Content Marketing Market is poised for continued robust growth, driven by ongoing technological advancements, increasing demand for personalized content, and the expanding adoption of digital marketing strategies across various industries. The focus on data-driven decision-making, the evolution of AI-powered tools, and the exploration of new content formats will shape the future of the market, offering significant opportunities for businesses to capitalize on this expanding landscape. Strategic partnerships and investments in innovation will be crucial for companies aiming to maintain a competitive edge.
Content Marketing Market Segmentation
-
1. Component
- 1.1. Software
- 1.2. Service
-
2. Platform
- 2.1. Blogging
- 2.2. Videos
- 2.3. Infographics
- 2.4. Case Studies
- 2.5. Others
-
3. End-user Industry
- 3.1. Retail
- 3.2. BFSI
- 3.3. Media and Entertainment
- 3.4. Telecom
- 3.5. Other End-user Industries
Content Marketing Market Segmentation By Geography
- 1. North America
- 2. Europe
- 3. Asia
- 4. Australia and New Zealand
- 5. Latin America
- 6. Middle East and Africa
Content Marketing Market REPORT HIGHLIGHTS
| Aspects | Details |
|---|---|
| Study Period | 2019-2033 |
| Base Year | 2024 |
| Estimated Year | 2025 |
| Forecast Period | 2025-2033 |
| Historical Period | 2019-2024 |
| Growth Rate | CAGR of 14.75% from 2019-2033 |
| Segmentation |
|
Table of Contents
- 1. Introduction
- 1.1. Research Scope
- 1.2. Market Segmentation
- 1.3. Research Methodology
- 1.4. Definitions and Assumptions
- 2. Executive Summary
- 2.1. Introduction
- 3. Market Dynamics
- 3.1. Introduction
- 3.2. Market Drivers
- 3.2.1. Rise of Digital Channels; Growing Need for Demand Generation and Personalized Marketing Strategy
- 3.3. Market Restrains
- 3.3.1. Risk of Data Security Threats
- 3.4. Market Trends
- 3.4.1. Rise of Digital Channels to Drive Market Growth
- 4. Market Factor Analysis
- 4.1. Porters Five Forces
- 4.2. Supply/Value Chain
- 4.3. PESTEL analysis
- 4.4. Market Entropy
- 4.5. Patent/Trademark Analysis
- 5. Global Content Marketing Market Analysis, Insights and Forecast, 2019-2031
- 5.1. Market Analysis, Insights and Forecast - by Component
- 5.1.1. Software
- 5.1.2. Service
- 5.2. Market Analysis, Insights and Forecast - by Platform
- 5.2.1. Blogging
- 5.2.2. Videos
- 5.2.3. Infographics
- 5.2.4. Case Studies
- 5.2.5. Others
- 5.3. Market Analysis, Insights and Forecast - by End-user Industry
- 5.3.1. Retail
- 5.3.2. BFSI
- 5.3.3. Media and Entertainment
- 5.3.4. Telecom
- 5.3.5. Other End-user Industries
- 5.4. Market Analysis, Insights and Forecast - by Region
- 5.4.1. North America
- 5.4.2. Europe
- 5.4.3. Asia
- 5.4.4. Australia and New Zealand
- 5.4.5. Latin America
- 5.4.6. Middle East and Africa
- 5.1. Market Analysis, Insights and Forecast - by Component
- 6. North America Content Marketing Market Analysis, Insights and Forecast, 2019-2031
- 6.1. Market Analysis, Insights and Forecast - by Component
- 6.1.1. Software
- 6.1.2. Service
- 6.2. Market Analysis, Insights and Forecast - by Platform
- 6.2.1. Blogging
- 6.2.2. Videos
- 6.2.3. Infographics
- 6.2.4. Case Studies
- 6.2.5. Others
- 6.3. Market Analysis, Insights and Forecast - by End-user Industry
- 6.3.1. Retail
- 6.3.2. BFSI
- 6.3.3. Media and Entertainment
- 6.3.4. Telecom
- 6.3.5. Other End-user Industries
- 6.1. Market Analysis, Insights and Forecast - by Component
- 7. Europe Content Marketing Market Analysis, Insights and Forecast, 2019-2031
- 7.1. Market Analysis, Insights and Forecast - by Component
- 7.1.1. Software
- 7.1.2. Service
- 7.2. Market Analysis, Insights and Forecast - by Platform
- 7.2.1. Blogging
- 7.2.2. Videos
- 7.2.3. Infographics
- 7.2.4. Case Studies
- 7.2.5. Others
- 7.3. Market Analysis, Insights and Forecast - by End-user Industry
- 7.3.1. Retail
- 7.3.2. BFSI
- 7.3.3. Media and Entertainment
- 7.3.4. Telecom
- 7.3.5. Other End-user Industries
- 7.1. Market Analysis, Insights and Forecast - by Component
- 8. Asia Content Marketing Market Analysis, Insights and Forecast, 2019-2031
- 8.1. Market Analysis, Insights and Forecast - by Component
- 8.1.1. Software
- 8.1.2. Service
- 8.2. Market Analysis, Insights and Forecast - by Platform
- 8.2.1. Blogging
- 8.2.2. Videos
- 8.2.3. Infographics
- 8.2.4. Case Studies
- 8.2.5. Others
- 8.3. Market Analysis, Insights and Forecast - by End-user Industry
- 8.3.1. Retail
- 8.3.2. BFSI
- 8.3.3. Media and Entertainment
- 8.3.4. Telecom
- 8.3.5. Other End-user Industries
- 8.1. Market Analysis, Insights and Forecast - by Component
- 9. Australia and New Zealand Content Marketing Market Analysis, Insights and Forecast, 2019-2031
- 9.1. Market Analysis, Insights and Forecast - by Component
- 9.1.1. Software
- 9.1.2. Service
- 9.2. Market Analysis, Insights and Forecast - by Platform
- 9.2.1. Blogging
- 9.2.2. Videos
- 9.2.3. Infographics
- 9.2.4. Case Studies
- 9.2.5. Others
- 9.3. Market Analysis, Insights and Forecast - by End-user Industry
- 9.3.1. Retail
- 9.3.2. BFSI
- 9.3.3. Media and Entertainment
- 9.3.4. Telecom
- 9.3.5. Other End-user Industries
- 9.1. Market Analysis, Insights and Forecast - by Component
- 10. Latin America Content Marketing Market Analysis, Insights and Forecast, 2019-2031
- 10.1. Market Analysis, Insights and Forecast - by Component
- 10.1.1. Software
- 10.1.2. Service
- 10.2. Market Analysis, Insights and Forecast - by Platform
- 10.2.1. Blogging
- 10.2.2. Videos
- 10.2.3. Infographics
- 10.2.4. Case Studies
- 10.2.5. Others
- 10.3. Market Analysis, Insights and Forecast - by End-user Industry
- 10.3.1. Retail
- 10.3.2. BFSI
- 10.3.3. Media and Entertainment
- 10.3.4. Telecom
- 10.3.5. Other End-user Industries
- 10.1. Market Analysis, Insights and Forecast - by Component
- 11. Middle East and Africa Content Marketing Market Analysis, Insights and Forecast, 2019-2031
- 11.1. Market Analysis, Insights and Forecast - by Component
- 11.1.1. Software
- 11.1.2. Service
- 11.2. Market Analysis, Insights and Forecast - by Platform
- 11.2.1. Blogging
- 11.2.2. Videos
- 11.2.3. Infographics
- 11.2.4. Case Studies
- 11.2.5. Others
- 11.3. Market Analysis, Insights and Forecast - by End-user Industry
- 11.3.1. Retail
- 11.3.2. BFSI
- 11.3.3. Media and Entertainment
- 11.3.4. Telecom
- 11.3.5. Other End-user Industries
- 11.1. Market Analysis, Insights and Forecast - by Component
- 12. North America Content Marketing Market Analysis, Insights and Forecast, 2019-2031
- 12.1. Market Analysis, Insights and Forecast - By Country/Sub-region
- 12.1.1 United States
- 12.1.2 Canada
- 12.1.3 Mexico
- 13. Europe Content Marketing Market Analysis, Insights and Forecast, 2019-2031
- 13.1. Market Analysis, Insights and Forecast - By Country/Sub-region
- 13.1.1 Germany
- 13.1.2 United Kingdom
- 13.1.3 France
- 13.1.4 Spain
- 13.1.5 Italy
- 13.1.6 Spain
- 13.1.7 Belgium
- 13.1.8 Netherland
- 13.1.9 Nordics
- 13.1.10 Rest of Europe
- 14. Asia Pacific Content Marketing Market Analysis, Insights and Forecast, 2019-2031
- 14.1. Market Analysis, Insights and Forecast - By Country/Sub-region
- 14.1.1 China
- 14.1.2 Japan
- 14.1.3 India
- 14.1.4 South Korea
- 14.1.5 Southeast Asia
- 14.1.6 Australia
- 14.1.7 Indonesia
- 14.1.8 Phillipes
- 14.1.9 Singapore
- 14.1.10 Thailandc
- 14.1.11 Rest of Asia Pacific
- 15. South America Content Marketing Market Analysis, Insights and Forecast, 2019-2031
- 15.1. Market Analysis, Insights and Forecast - By Country/Sub-region
- 15.1.1 Brazil
- 15.1.2 Argentina
- 15.1.3 Peru
- 15.1.4 Chile
- 15.1.5 Colombia
- 15.1.6 Ecuador
- 15.1.7 Venezuela
- 15.1.8 Rest of South America
- 16. North America Content Marketing Market Analysis, Insights and Forecast, 2019-2031
- 16.1. Market Analysis, Insights and Forecast - By Country/Sub-region
- 16.1.1 United States
- 16.1.2 Canada
- 16.1.3 Mexico
- 17. MEA Content Marketing Market Analysis, Insights and Forecast, 2019-2031
- 17.1. Market Analysis, Insights and Forecast - By Country/Sub-region
- 17.1.1 United Arab Emirates
- 17.1.2 Saudi Arabia
- 17.1.3 South Africa
- 17.1.4 Rest of Middle East and Africa
- 18. Competitive Analysis
- 18.1. Global Market Share Analysis 2024
- 18.2. Company Profiles
- 18.2.1 Brafton Inc
- 18.2.1.1. Overview
- 18.2.1.2. Products
- 18.2.1.3. SWOT Analysis
- 18.2.1.4. Recent Developments
- 18.2.1.5. Financials (Based on Availability)
- 18.2.2 Curata Inc
- 18.2.2.1. Overview
- 18.2.2.2. Products
- 18.2.2.3. SWOT Analysis
- 18.2.2.4. Recent Developments
- 18.2.2.5. Financials (Based on Availability)
- 18.2.3 Adobe Inc
- 18.2.3.1. Overview
- 18.2.3.2. Products
- 18.2.3.3. SWOT Analysis
- 18.2.3.4. Recent Developments
- 18.2.3.5. Financials (Based on Availability)
- 18.2.4 HubSpot Inc
- 18.2.4.1. Overview
- 18.2.4.2. Products
- 18.2.4.3. SWOT Analysis
- 18.2.4.4. Recent Developments
- 18.2.4.5. Financials (Based on Availability)
- 18.2.5 Seismic Software Inc
- 18.2.5.1. Overview
- 18.2.5.2. Products
- 18.2.5.3. SWOT Analysis
- 18.2.5.4. Recent Developments
- 18.2.5.5. Financials (Based on Availability)
- 18.2.6 Contently Inc
- 18.2.6.1. Overview
- 18.2.6.2. Products
- 18.2.6.3. SWOT Analysis
- 18.2.6.4. Recent Developments
- 18.2.6.5. Financials (Based on Availability)
- 18.2.7 Influence and Co
- 18.2.7.1. Overview
- 18.2.7.2. Products
- 18.2.7.3. SWOT Analysis
- 18.2.7.4. Recent Developments
- 18.2.7.5. Financials (Based on Availability)
- 18.2.8 Hootsuite Inc
- 18.2.8.1. Overview
- 18.2.8.2. Products
- 18.2.8.3. SWOT Analysis
- 18.2.8.4. Recent Developments
- 18.2.8.5. Financials (Based on Availability)
- 18.2.9 Contentoo B V
- 18.2.9.1. Overview
- 18.2.9.2. Products
- 18.2.9.3. SWOT Analysis
- 18.2.9.4. Recent Developments
- 18.2.9.5. Financials (Based on Availability)
- 18.2.10 Upland Software Inc
- 18.2.10.1. Overview
- 18.2.10.2. Products
- 18.2.10.3. SWOT Analysis
- 18.2.10.4. Recent Developments
- 18.2.10.5. Financials (Based on Availability)
- 18.2.1 Brafton Inc
List of Figures
- Figure 1: Global Content Marketing Market Revenue Breakdown (Million, %) by Region 2024 & 2032
- Figure 2: Global Content Marketing Market Volume Breakdown (K Unit, %) by Region 2024 & 2032
- Figure 3: North America Content Marketing Market Revenue (Million), by Country 2024 & 2032
- Figure 4: North America Content Marketing Market Volume (K Unit), by Country 2024 & 2032
- Figure 5: North America Content Marketing Market Revenue Share (%), by Country 2024 & 2032
- Figure 6: North America Content Marketing Market Volume Share (%), by Country 2024 & 2032
- Figure 7: Europe Content Marketing Market Revenue (Million), by Country 2024 & 2032
- Figure 8: Europe Content Marketing Market Volume (K Unit), by Country 2024 & 2032
- Figure 9: Europe Content Marketing Market Revenue Share (%), by Country 2024 & 2032
- Figure 10: Europe Content Marketing Market Volume Share (%), by Country 2024 & 2032
- Figure 11: Asia Pacific Content Marketing Market Revenue (Million), by Country 2024 & 2032
- Figure 12: Asia Pacific Content Marketing Market Volume (K Unit), by Country 2024 & 2032
- Figure 13: Asia Pacific Content Marketing Market Revenue Share (%), by Country 2024 & 2032
- Figure 14: Asia Pacific Content Marketing Market Volume Share (%), by Country 2024 & 2032
- Figure 15: South America Content Marketing Market Revenue (Million), by Country 2024 & 2032
- Figure 16: South America Content Marketing Market Volume (K Unit), by Country 2024 & 2032
- Figure 17: South America Content Marketing Market Revenue Share (%), by Country 2024 & 2032
- Figure 18: South America Content Marketing Market Volume Share (%), by Country 2024 & 2032
- Figure 19: North America Content Marketing Market Revenue (Million), by Country 2024 & 2032
- Figure 20: North America Content Marketing Market Volume (K Unit), by Country 2024 & 2032
- Figure 21: North America Content Marketing Market Revenue Share (%), by Country 2024 & 2032
- Figure 22: North America Content Marketing Market Volume Share (%), by Country 2024 & 2032
- Figure 23: MEA Content Marketing Market Revenue (Million), by Country 2024 & 2032
- Figure 24: MEA Content Marketing Market Volume (K Unit), by Country 2024 & 2032
- Figure 25: MEA Content Marketing Market Revenue Share (%), by Country 2024 & 2032
- Figure 26: MEA Content Marketing Market Volume Share (%), by Country 2024 & 2032
- Figure 27: North America Content Marketing Market Revenue (Million), by Component 2024 & 2032
- Figure 28: North America Content Marketing Market Volume (K Unit), by Component 2024 & 2032
- Figure 29: North America Content Marketing Market Revenue Share (%), by Component 2024 & 2032
- Figure 30: North America Content Marketing Market Volume Share (%), by Component 2024 & 2032
- Figure 31: North America Content Marketing Market Revenue (Million), by Platform 2024 & 2032
- Figure 32: North America Content Marketing Market Volume (K Unit), by Platform 2024 & 2032
- Figure 33: North America Content Marketing Market Revenue Share (%), by Platform 2024 & 2032
- Figure 34: North America Content Marketing Market Volume Share (%), by Platform 2024 & 2032
- Figure 35: North America Content Marketing Market Revenue (Million), by End-user Industry 2024 & 2032
- Figure 36: North America Content Marketing Market Volume (K Unit), by End-user Industry 2024 & 2032
- Figure 37: North America Content Marketing Market Revenue Share (%), by End-user Industry 2024 & 2032
- Figure 38: North America Content Marketing Market Volume Share (%), by End-user Industry 2024 & 2032
- Figure 39: North America Content Marketing Market Revenue (Million), by Country 2024 & 2032
- Figure 40: North America Content Marketing Market Volume (K Unit), by Country 2024 & 2032
- Figure 41: North America Content Marketing Market Revenue Share (%), by Country 2024 & 2032
- Figure 42: North America Content Marketing Market Volume Share (%), by Country 2024 & 2032
- Figure 43: Europe Content Marketing Market Revenue (Million), by Component 2024 & 2032
- Figure 44: Europe Content Marketing Market Volume (K Unit), by Component 2024 & 2032
- Figure 45: Europe Content Marketing Market Revenue Share (%), by Component 2024 & 2032
- Figure 46: Europe Content Marketing Market Volume Share (%), by Component 2024 & 2032
- Figure 47: Europe Content Marketing Market Revenue (Million), by Platform 2024 & 2032
- Figure 48: Europe Content Marketing Market Volume (K Unit), by Platform 2024 & 2032
- Figure 49: Europe Content Marketing Market Revenue Share (%), by Platform 2024 & 2032
- Figure 50: Europe Content Marketing Market Volume Share (%), by Platform 2024 & 2032
- Figure 51: Europe Content Marketing Market Revenue (Million), by End-user Industry 2024 & 2032
- Figure 52: Europe Content Marketing Market Volume (K Unit), by End-user Industry 2024 & 2032
- Figure 53: Europe Content Marketing Market Revenue Share (%), by End-user Industry 2024 & 2032
- Figure 54: Europe Content Marketing Market Volume Share (%), by End-user Industry 2024 & 2032
- Figure 55: Europe Content Marketing Market Revenue (Million), by Country 2024 & 2032
- Figure 56: Europe Content Marketing Market Volume (K Unit), by Country 2024 & 2032
- Figure 57: Europe Content Marketing Market Revenue Share (%), by Country 2024 & 2032
- Figure 58: Europe Content Marketing Market Volume Share (%), by Country 2024 & 2032
- Figure 59: Asia Content Marketing Market Revenue (Million), by Component 2024 & 2032
- Figure 60: Asia Content Marketing Market Volume (K Unit), by Component 2024 & 2032
- Figure 61: Asia Content Marketing Market Revenue Share (%), by Component 2024 & 2032
- Figure 62: Asia Content Marketing Market Volume Share (%), by Component 2024 & 2032
- Figure 63: Asia Content Marketing Market Revenue (Million), by Platform 2024 & 2032
- Figure 64: Asia Content Marketing Market Volume (K Unit), by Platform 2024 & 2032
- Figure 65: Asia Content Marketing Market Revenue Share (%), by Platform 2024 & 2032
- Figure 66: Asia Content Marketing Market Volume Share (%), by Platform 2024 & 2032
- Figure 67: Asia Content Marketing Market Revenue (Million), by End-user Industry 2024 & 2032
- Figure 68: Asia Content Marketing Market Volume (K Unit), by End-user Industry 2024 & 2032
- Figure 69: Asia Content Marketing Market Revenue Share (%), by End-user Industry 2024 & 2032
- Figure 70: Asia Content Marketing Market Volume Share (%), by End-user Industry 2024 & 2032
- Figure 71: Asia Content Marketing Market Revenue (Million), by Country 2024 & 2032
- Figure 72: Asia Content Marketing Market Volume (K Unit), by Country 2024 & 2032
- Figure 73: Asia Content Marketing Market Revenue Share (%), by Country 2024 & 2032
- Figure 74: Asia Content Marketing Market Volume Share (%), by Country 2024 & 2032
- Figure 75: Australia and New Zealand Content Marketing Market Revenue (Million), by Component 2024 & 2032
- Figure 76: Australia and New Zealand Content Marketing Market Volume (K Unit), by Component 2024 & 2032
- Figure 77: Australia and New Zealand Content Marketing Market Revenue Share (%), by Component 2024 & 2032
- Figure 78: Australia and New Zealand Content Marketing Market Volume Share (%), by Component 2024 & 2032
- Figure 79: Australia and New Zealand Content Marketing Market Revenue (Million), by Platform 2024 & 2032
- Figure 80: Australia and New Zealand Content Marketing Market Volume (K Unit), by Platform 2024 & 2032
- Figure 81: Australia and New Zealand Content Marketing Market Revenue Share (%), by Platform 2024 & 2032
- Figure 82: Australia and New Zealand Content Marketing Market Volume Share (%), by Platform 2024 & 2032
- Figure 83: Australia and New Zealand Content Marketing Market Revenue (Million), by End-user Industry 2024 & 2032
- Figure 84: Australia and New Zealand Content Marketing Market Volume (K Unit), by End-user Industry 2024 & 2032
- Figure 85: Australia and New Zealand Content Marketing Market Revenue Share (%), by End-user Industry 2024 & 2032
- Figure 86: Australia and New Zealand Content Marketing Market Volume Share (%), by End-user Industry 2024 & 2032
- Figure 87: Australia and New Zealand Content Marketing Market Revenue (Million), by Country 2024 & 2032
- Figure 88: Australia and New Zealand Content Marketing Market Volume (K Unit), by Country 2024 & 2032
- Figure 89: Australia and New Zealand Content Marketing Market Revenue Share (%), by Country 2024 & 2032
- Figure 90: Australia and New Zealand Content Marketing Market Volume Share (%), by Country 2024 & 2032
- Figure 91: Latin America Content Marketing Market Revenue (Million), by Component 2024 & 2032
- Figure 92: Latin America Content Marketing Market Volume (K Unit), by Component 2024 & 2032
- Figure 93: Latin America Content Marketing Market Revenue Share (%), by Component 2024 & 2032
- Figure 94: Latin America Content Marketing Market Volume Share (%), by Component 2024 & 2032
- Figure 95: Latin America Content Marketing Market Revenue (Million), by Platform 2024 & 2032
- Figure 96: Latin America Content Marketing Market Volume (K Unit), by Platform 2024 & 2032
- Figure 97: Latin America Content Marketing Market Revenue Share (%), by Platform 2024 & 2032
- Figure 98: Latin America Content Marketing Market Volume Share (%), by Platform 2024 & 2032
- Figure 99: Latin America Content Marketing Market Revenue (Million), by End-user Industry 2024 & 2032
- Figure 100: Latin America Content Marketing Market Volume (K Unit), by End-user Industry 2024 & 2032
- Figure 101: Latin America Content Marketing Market Revenue Share (%), by End-user Industry 2024 & 2032
- Figure 102: Latin America Content Marketing Market Volume Share (%), by End-user Industry 2024 & 2032
- Figure 103: Latin America Content Marketing Market Revenue (Million), by Country 2024 & 2032
- Figure 104: Latin America Content Marketing Market Volume (K Unit), by Country 2024 & 2032
- Figure 105: Latin America Content Marketing Market Revenue Share (%), by Country 2024 & 2032
- Figure 106: Latin America Content Marketing Market Volume Share (%), by Country 2024 & 2032
- Figure 107: Middle East and Africa Content Marketing Market Revenue (Million), by Component 2024 & 2032
- Figure 108: Middle East and Africa Content Marketing Market Volume (K Unit), by Component 2024 & 2032
- Figure 109: Middle East and Africa Content Marketing Market Revenue Share (%), by Component 2024 & 2032
- Figure 110: Middle East and Africa Content Marketing Market Volume Share (%), by Component 2024 & 2032
- Figure 111: Middle East and Africa Content Marketing Market Revenue (Million), by Platform 2024 & 2032
- Figure 112: Middle East and Africa Content Marketing Market Volume (K Unit), by Platform 2024 & 2032
- Figure 113: Middle East and Africa Content Marketing Market Revenue Share (%), by Platform 2024 & 2032
- Figure 114: Middle East and Africa Content Marketing Market Volume Share (%), by Platform 2024 & 2032
- Figure 115: Middle East and Africa Content Marketing Market Revenue (Million), by End-user Industry 2024 & 2032
- Figure 116: Middle East and Africa Content Marketing Market Volume (K Unit), by End-user Industry 2024 & 2032
- Figure 117: Middle East and Africa Content Marketing Market Revenue Share (%), by End-user Industry 2024 & 2032
- Figure 118: Middle East and Africa Content Marketing Market Volume Share (%), by End-user Industry 2024 & 2032
- Figure 119: Middle East and Africa Content Marketing Market Revenue (Million), by Country 2024 & 2032
- Figure 120: Middle East and Africa Content Marketing Market Volume (K Unit), by Country 2024 & 2032
- Figure 121: Middle East and Africa Content Marketing Market Revenue Share (%), by Country 2024 & 2032
- Figure 122: Middle East and Africa Content Marketing Market Volume Share (%), by Country 2024 & 2032
List of Tables
- Table 1: Global Content Marketing Market Revenue Million Forecast, by Region 2019 & 2032
- Table 2: Global Content Marketing Market Volume K Unit Forecast, by Region 2019 & 2032
- Table 3: Global Content Marketing Market Revenue Million Forecast, by Component 2019 & 2032
- Table 4: Global Content Marketing Market Volume K Unit Forecast, by Component 2019 & 2032
- Table 5: Global Content Marketing Market Revenue Million Forecast, by Platform 2019 & 2032
- Table 6: Global Content Marketing Market Volume K Unit Forecast, by Platform 2019 & 2032
- Table 7: Global Content Marketing Market Revenue Million Forecast, by End-user Industry 2019 & 2032
- Table 8: Global Content Marketing Market Volume K Unit Forecast, by End-user Industry 2019 & 2032
- Table 9: Global Content Marketing Market Revenue Million Forecast, by Region 2019 & 2032
- Table 10: Global Content Marketing Market Volume K Unit Forecast, by Region 2019 & 2032
- Table 11: Global Content Marketing Market Revenue Million Forecast, by Country 2019 & 2032
- Table 12: Global Content Marketing Market Volume K Unit Forecast, by Country 2019 & 2032
- Table 13: United States Content Marketing Market Revenue (Million) Forecast, by Application 2019 & 2032
- Table 14: United States Content Marketing Market Volume (K Unit) Forecast, by Application 2019 & 2032
- Table 15: Canada Content Marketing Market Revenue (Million) Forecast, by Application 2019 & 2032
- Table 16: Canada Content Marketing Market Volume (K Unit) Forecast, by Application 2019 & 2032
- Table 17: Mexico Content Marketing Market Revenue (Million) Forecast, by Application 2019 & 2032
- Table 18: Mexico Content Marketing Market Volume (K Unit) Forecast, by Application 2019 & 2032
- Table 19: Global Content Marketing Market Revenue Million Forecast, by Country 2019 & 2032
- Table 20: Global Content Marketing Market Volume K Unit Forecast, by Country 2019 & 2032
- Table 21: Germany Content Marketing Market Revenue (Million) Forecast, by Application 2019 & 2032
- Table 22: Germany Content Marketing Market Volume (K Unit) Forecast, by Application 2019 & 2032
- Table 23: United Kingdom Content Marketing Market Revenue (Million) Forecast, by Application 2019 & 2032
- Table 24: United Kingdom Content Marketing Market Volume (K Unit) Forecast, by Application 2019 & 2032
- Table 25: France Content Marketing Market Revenue (Million) Forecast, by Application 2019 & 2032
- Table 26: France Content Marketing Market Volume (K Unit) Forecast, by Application 2019 & 2032
- Table 27: Spain Content Marketing Market Revenue (Million) Forecast, by Application 2019 & 2032
- Table 28: Spain Content Marketing Market Volume (K Unit) Forecast, by Application 2019 & 2032
- Table 29: Italy Content Marketing Market Revenue (Million) Forecast, by Application 2019 & 2032
- Table 30: Italy Content Marketing Market Volume (K Unit) Forecast, by Application 2019 & 2032
- Table 31: Spain Content Marketing Market Revenue (Million) Forecast, by Application 2019 & 2032
- Table 32: Spain Content Marketing Market Volume (K Unit) Forecast, by Application 2019 & 2032
- Table 33: Belgium Content Marketing Market Revenue (Million) Forecast, by Application 2019 & 2032
- Table 34: Belgium Content Marketing Market Volume (K Unit) Forecast, by Application 2019 & 2032
- Table 35: Netherland Content Marketing Market Revenue (Million) Forecast, by Application 2019 & 2032
- Table 36: Netherland Content Marketing Market Volume (K Unit) Forecast, by Application 2019 & 2032
- Table 37: Nordics Content Marketing Market Revenue (Million) Forecast, by Application 2019 & 2032
- Table 38: Nordics Content Marketing Market Volume (K Unit) Forecast, by Application 2019 & 2032
- Table 39: Rest of Europe Content Marketing Market Revenue (Million) Forecast, by Application 2019 & 2032
- Table 40: Rest of Europe Content Marketing Market Volume (K Unit) Forecast, by Application 2019 & 2032
- Table 41: Global Content Marketing Market Revenue Million Forecast, by Country 2019 & 2032
- Table 42: Global Content Marketing Market Volume K Unit Forecast, by Country 2019 & 2032
- Table 43: China Content Marketing Market Revenue (Million) Forecast, by Application 2019 & 2032
- Table 44: China Content Marketing Market Volume (K Unit) Forecast, by Application 2019 & 2032
- Table 45: Japan Content Marketing Market Revenue (Million) Forecast, by Application 2019 & 2032
- Table 46: Japan Content Marketing Market Volume (K Unit) Forecast, by Application 2019 & 2032
- Table 47: India Content Marketing Market Revenue (Million) Forecast, by Application 2019 & 2032
- Table 48: India Content Marketing Market Volume (K Unit) Forecast, by Application 2019 & 2032
- Table 49: South Korea Content Marketing Market Revenue (Million) Forecast, by Application 2019 & 2032
- Table 50: South Korea Content Marketing Market Volume (K Unit) Forecast, by Application 2019 & 2032
- Table 51: Southeast Asia Content Marketing Market Revenue (Million) Forecast, by Application 2019 & 2032
- Table 52: Southeast Asia Content Marketing Market Volume (K Unit) Forecast, by Application 2019 & 2032
- Table 53: Australia Content Marketing Market Revenue (Million) Forecast, by Application 2019 & 2032
- Table 54: Australia Content Marketing Market Volume (K Unit) Forecast, by Application 2019 & 2032
- Table 55: Indonesia Content Marketing Market Revenue (Million) Forecast, by Application 2019 & 2032
- Table 56: Indonesia Content Marketing Market Volume (K Unit) Forecast, by Application 2019 & 2032
- Table 57: Phillipes Content Marketing Market Revenue (Million) Forecast, by Application 2019 & 2032
- Table 58: Phillipes Content Marketing Market Volume (K Unit) Forecast, by Application 2019 & 2032
- Table 59: Singapore Content Marketing Market Revenue (Million) Forecast, by Application 2019 & 2032
- Table 60: Singapore Content Marketing Market Volume (K Unit) Forecast, by Application 2019 & 2032
- Table 61: Thailandc Content Marketing Market Revenue (Million) Forecast, by Application 2019 & 2032
- Table 62: Thailandc Content Marketing Market Volume (K Unit) Forecast, by Application 2019 & 2032
- Table 63: Rest of Asia Pacific Content Marketing Market Revenue (Million) Forecast, by Application 2019 & 2032
- Table 64: Rest of Asia Pacific Content Marketing Market Volume (K Unit) Forecast, by Application 2019 & 2032
- Table 65: Global Content Marketing Market Revenue Million Forecast, by Country 2019 & 2032
- Table 66: Global Content Marketing Market Volume K Unit Forecast, by Country 2019 & 2032
- Table 67: Brazil Content Marketing Market Revenue (Million) Forecast, by Application 2019 & 2032
- Table 68: Brazil Content Marketing Market Volume (K Unit) Forecast, by Application 2019 & 2032
- Table 69: Argentina Content Marketing Market Revenue (Million) Forecast, by Application 2019 & 2032
- Table 70: Argentina Content Marketing Market Volume (K Unit) Forecast, by Application 2019 & 2032
- Table 71: Peru Content Marketing Market Revenue (Million) Forecast, by Application 2019 & 2032
- Table 72: Peru Content Marketing Market Volume (K Unit) Forecast, by Application 2019 & 2032
- Table 73: Chile Content Marketing Market Revenue (Million) Forecast, by Application 2019 & 2032
- Table 74: Chile Content Marketing Market Volume (K Unit) Forecast, by Application 2019 & 2032
- Table 75: Colombia Content Marketing Market Revenue (Million) Forecast, by Application 2019 & 2032
- Table 76: Colombia Content Marketing Market Volume (K Unit) Forecast, by Application 2019 & 2032
- Table 77: Ecuador Content Marketing Market Revenue (Million) Forecast, by Application 2019 & 2032
- Table 78: Ecuador Content Marketing Market Volume (K Unit) Forecast, by Application 2019 & 2032
- Table 79: Venezuela Content Marketing Market Revenue (Million) Forecast, by Application 2019 & 2032
- Table 80: Venezuela Content Marketing Market Volume (K Unit) Forecast, by Application 2019 & 2032
- Table 81: Rest of South America Content Marketing Market Revenue (Million) Forecast, by Application 2019 & 2032
- Table 82: Rest of South America Content Marketing Market Volume (K Unit) Forecast, by Application 2019 & 2032
- Table 83: Global Content Marketing Market Revenue Million Forecast, by Country 2019 & 2032
- Table 84: Global Content Marketing Market Volume K Unit Forecast, by Country 2019 & 2032
- Table 85: United States Content Marketing Market Revenue (Million) Forecast, by Application 2019 & 2032
- Table 86: United States Content Marketing Market Volume (K Unit) Forecast, by Application 2019 & 2032
- Table 87: Canada Content Marketing Market Revenue (Million) Forecast, by Application 2019 & 2032
- Table 88: Canada Content Marketing Market Volume (K Unit) Forecast, by Application 2019 & 2032
- Table 89: Mexico Content Marketing Market Revenue (Million) Forecast, by Application 2019 & 2032
- Table 90: Mexico Content Marketing Market Volume (K Unit) Forecast, by Application 2019 & 2032
- Table 91: Global Content Marketing Market Revenue Million Forecast, by Country 2019 & 2032
- Table 92: Global Content Marketing Market Volume K Unit Forecast, by Country 2019 & 2032
- Table 93: United Arab Emirates Content Marketing Market Revenue (Million) Forecast, by Application 2019 & 2032
- Table 94: United Arab Emirates Content Marketing Market Volume (K Unit) Forecast, by Application 2019 & 2032
- Table 95: Saudi Arabia Content Marketing Market Revenue (Million) Forecast, by Application 2019 & 2032
- Table 96: Saudi Arabia Content Marketing Market Volume (K Unit) Forecast, by Application 2019 & 2032
- Table 97: South Africa Content Marketing Market Revenue (Million) Forecast, by Application 2019 & 2032
- Table 98: South Africa Content Marketing Market Volume (K Unit) Forecast, by Application 2019 & 2032
- Table 99: Rest of Middle East and Africa Content Marketing Market Revenue (Million) Forecast, by Application 2019 & 2032
- Table 100: Rest of Middle East and Africa Content Marketing Market Volume (K Unit) Forecast, by Application 2019 & 2032
- Table 101: Global Content Marketing Market Revenue Million Forecast, by Component 2019 & 2032
- Table 102: Global Content Marketing Market Volume K Unit Forecast, by Component 2019 & 2032
- Table 103: Global Content Marketing Market Revenue Million Forecast, by Platform 2019 & 2032
- Table 104: Global Content Marketing Market Volume K Unit Forecast, by Platform 2019 & 2032
- Table 105: Global Content Marketing Market Revenue Million Forecast, by End-user Industry 2019 & 2032
- Table 106: Global Content Marketing Market Volume K Unit Forecast, by End-user Industry 2019 & 2032
- Table 107: Global Content Marketing Market Revenue Million Forecast, by Country 2019 & 2032
- Table 108: Global Content Marketing Market Volume K Unit Forecast, by Country 2019 & 2032
- Table 109: Global Content Marketing Market Revenue Million Forecast, by Component 2019 & 2032
- Table 110: Global Content Marketing Market Volume K Unit Forecast, by Component 2019 & 2032
- Table 111: Global Content Marketing Market Revenue Million Forecast, by Platform 2019 & 2032
- Table 112: Global Content Marketing Market Volume K Unit Forecast, by Platform 2019 & 2032
- Table 113: Global Content Marketing Market Revenue Million Forecast, by End-user Industry 2019 & 2032
- Table 114: Global Content Marketing Market Volume K Unit Forecast, by End-user Industry 2019 & 2032
- Table 115: Global Content Marketing Market Revenue Million Forecast, by Country 2019 & 2032
- Table 116: Global Content Marketing Market Volume K Unit Forecast, by Country 2019 & 2032
- Table 117: Global Content Marketing Market Revenue Million Forecast, by Component 2019 & 2032
- Table 118: Global Content Marketing Market Volume K Unit Forecast, by Component 2019 & 2032
- Table 119: Global Content Marketing Market Revenue Million Forecast, by Platform 2019 & 2032
- Table 120: Global Content Marketing Market Volume K Unit Forecast, by Platform 2019 & 2032
- Table 121: Global Content Marketing Market Revenue Million Forecast, by End-user Industry 2019 & 2032
- Table 122: Global Content Marketing Market Volume K Unit Forecast, by End-user Industry 2019 & 2032
- Table 123: Global Content Marketing Market Revenue Million Forecast, by Country 2019 & 2032
- Table 124: Global Content Marketing Market Volume K Unit Forecast, by Country 2019 & 2032
- Table 125: Global Content Marketing Market Revenue Million Forecast, by Component 2019 & 2032
- Table 126: Global Content Marketing Market Volume K Unit Forecast, by Component 2019 & 2032
- Table 127: Global Content Marketing Market Revenue Million Forecast, by Platform 2019 & 2032
- Table 128: Global Content Marketing Market Volume K Unit Forecast, by Platform 2019 & 2032
- Table 129: Global Content Marketing Market Revenue Million Forecast, by End-user Industry 2019 & 2032
- Table 130: Global Content Marketing Market Volume K Unit Forecast, by End-user Industry 2019 & 2032
- Table 131: Global Content Marketing Market Revenue Million Forecast, by Country 2019 & 2032
- Table 132: Global Content Marketing Market Volume K Unit Forecast, by Country 2019 & 2032
- Table 133: Global Content Marketing Market Revenue Million Forecast, by Component 2019 & 2032
- Table 134: Global Content Marketing Market Volume K Unit Forecast, by Component 2019 & 2032
- Table 135: Global Content Marketing Market Revenue Million Forecast, by Platform 2019 & 2032
- Table 136: Global Content Marketing Market Volume K Unit Forecast, by Platform 2019 & 2032
- Table 137: Global Content Marketing Market Revenue Million Forecast, by End-user Industry 2019 & 2032
- Table 138: Global Content Marketing Market Volume K Unit Forecast, by End-user Industry 2019 & 2032
- Table 139: Global Content Marketing Market Revenue Million Forecast, by Country 2019 & 2032
- Table 140: Global Content Marketing Market Volume K Unit Forecast, by Country 2019 & 2032
- Table 141: Global Content Marketing Market Revenue Million Forecast, by Component 2019 & 2032
- Table 142: Global Content Marketing Market Volume K Unit Forecast, by Component 2019 & 2032
- Table 143: Global Content Marketing Market Revenue Million Forecast, by Platform 2019 & 2032
- Table 144: Global Content Marketing Market Volume K Unit Forecast, by Platform 2019 & 2032
- Table 145: Global Content Marketing Market Revenue Million Forecast, by End-user Industry 2019 & 2032
- Table 146: Global Content Marketing Market Volume K Unit Forecast, by End-user Industry 2019 & 2032
- Table 147: Global Content Marketing Market Revenue Million Forecast, by Country 2019 & 2032
- Table 148: Global Content Marketing Market Volume K Unit Forecast, by Country 2019 & 2032
Frequently Asked Questions
1. What is the projected Compound Annual Growth Rate (CAGR) of the Content Marketing Market?
The projected CAGR is approximately 14.75%.
2. Which companies are prominent players in the Content Marketing Market?
Key companies in the market include Brafton Inc, Curata Inc , Adobe Inc, HubSpot Inc, Seismic Software Inc, Contently Inc, Influence and Co, Hootsuite Inc, Contentoo B V, Upland Software Inc.
3. What are the main segments of the Content Marketing Market?
The market segments include Component, Platform, End-user Industry.
4. Can you provide details about the market size?
The market size is estimated to be USD XX Million as of 2022.
5. What are some drivers contributing to market growth?
Rise of Digital Channels; Growing Need for Demand Generation and Personalized Marketing Strategy.
6. What are the notable trends driving market growth?
Rise of Digital Channels to Drive Market Growth.
7. Are there any restraints impacting market growth?
Risk of Data Security Threats.
8. Can you provide examples of recent developments in the market?
March 2023 - IBM and Adobe partnered to help marketing and creative organizations optimize their content supply chain. For this, IBM is introducing a new way to help Adobe's clients utilize its technologies to transform their marketing organizations by optimizing their content supply chain.
9. What pricing options are available for accessing the report?
Pricing options include single-user, multi-user, and enterprise licenses priced at USD 4750, USD 5250, and USD 8750 respectively.
10. Is the market size provided in terms of value or volume?
The market size is provided in terms of value, measured in Million and volume, measured in K Unit.
11. Are there any specific market keywords associated with the report?
Yes, the market keyword associated with the report is "Content Marketing Market," which aids in identifying and referencing the specific market segment covered.
12. How do I determine which pricing option suits my needs best?
The pricing options vary based on user requirements and access needs. Individual users may opt for single-user licenses, while businesses requiring broader access may choose multi-user or enterprise licenses for cost-effective access to the report.
13. Are there any additional resources or data provided in the Content Marketing Market report?
While the report offers comprehensive insights, it's advisable to review the specific contents or supplementary materials provided to ascertain if additional resources or data are available.
14. How can I stay updated on further developments or reports in the Content Marketing Market?
To stay informed about further developments, trends, and reports in the Content Marketing Market, consider subscribing to industry newsletters, following relevant companies and organizations, or regularly checking reputable industry news sources and publications.
Methodology
Step 1 - Identification of Relevant Samples Size from Population Database


Step 2 - Approaches for Defining Global Market Size (Value, Volume* & Price*)

Note*: In applicable scenarios
Step 3 - Data Sources
Primary Research
- Web Analytics
- Survey Reports
- Research Institute
- Latest Research Reports
- Opinion Leaders
Secondary Research
- Annual Reports
- White Paper
- Latest Press Release
- Industry Association
- Paid Database
- Investor Presentations

Step 4 - Data Triangulation
Involves using different sources of information in order to increase the validity of a study
These sources are likely to be stakeholders in a program - participants, other researchers, program staff, other community members, and so on.
Then we put all data in single framework & apply various statistical tools to find out the dynamic on the market.
During the analysis stage, feedback from the stakeholder groups would be compared to determine areas of agreement as well as areas of divergence


