
Key Insights
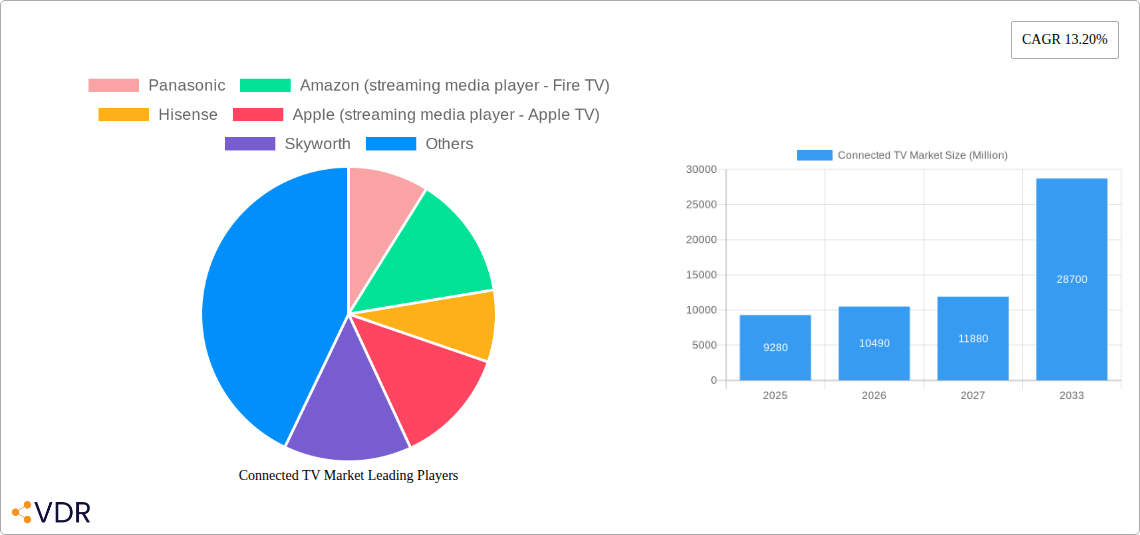
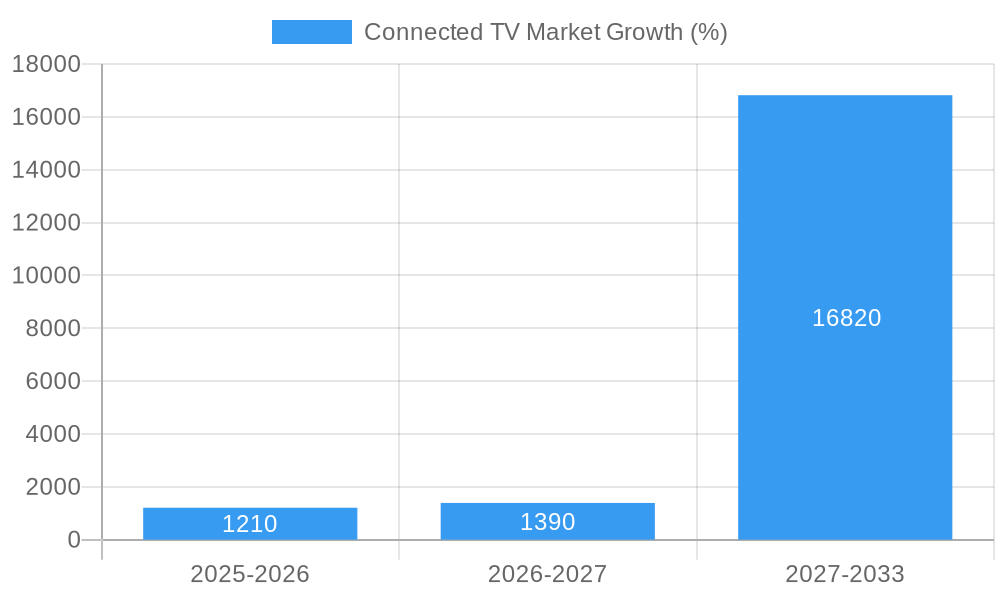
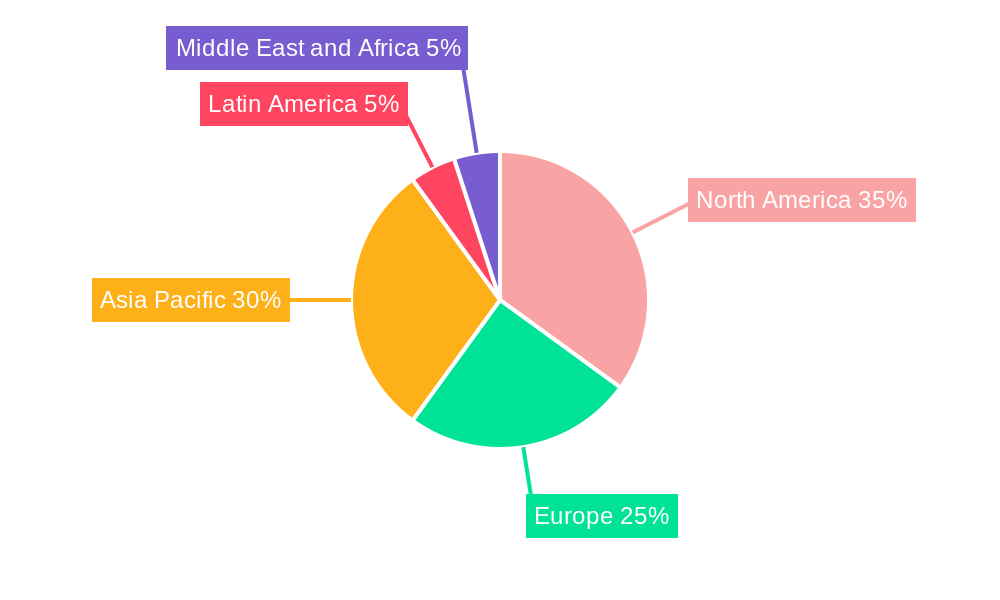
The Connected TV (CTV) market is experiencing robust growth, driven by increasing adoption of streaming services, improvements in internet infrastructure, and the rising popularity of high-resolution displays like 4K and 8K. With a current market size of $9.28 billion in 2025 and a Compound Annual Growth Rate (CAGR) of 13.20%, the market is projected to reach significant heights by 2033. Key drivers include the expanding availability of affordable smart TVs and streaming media players, the shift from traditional cable television, and the growing demand for on-demand and personalized content. The proliferation of streaming platforms such as Netflix, Amazon Prime Video, Disney+, and Hulu is fueling this growth, offering viewers a vast library of content at competitive prices. Furthermore, technological advancements in display technology, such as the increasing adoption of 4K and the emergence of 8K resolution, are enhancing the viewing experience and stimulating consumer demand for CTV devices. The market is segmented by device type (smart TVs and streaming media players) and geographically distributed, with North America and Asia Pacific currently leading. However, emerging markets in Latin America and the Middle East and Africa are showing promising growth potential. The competitive landscape includes established players like Samsung, LG, Sony, and Panasonic alongside tech giants such as Amazon, Apple, and Google, constantly innovating to maintain their market share.
The continued growth of the CTV market hinges on several factors. The ongoing development of 5G and other high-speed internet technologies will enable smoother streaming experiences, crucial for wider adoption. The rise of immersive technologies like HDR and Dolby Vision is further pushing premium viewing experiences, boosting consumer interest in high-end CTV devices. However, challenges remain, including the need for robust cybersecurity measures to protect user data and the potential for increased competition from emerging technologies such as virtual and augmented reality. Nonetheless, the overall outlook for the CTV market remains highly positive, indicating substantial growth and transformation in the years to come. Companies are strategically investing in content creation and device optimization to cater to the evolving needs and preferences of consumers, fueling the market's continued expansion.
This in-depth report provides a comprehensive analysis of the Connected TV market, encompassing market dynamics, growth trends, regional dominance, product landscape, key players, and future outlook. The study period spans from 2019 to 2033, with 2025 as the base and estimated year. This report is crucial for industry professionals, investors, and strategists seeking to navigate the rapidly evolving landscape of connected television.
Connected TV Market Dynamics & Structure
The Connected TV market is characterized by intense competition among established players and emerging entrants. Market concentration is moderate, with a few dominant players holding significant market share, while numerous smaller players compete in niche segments. Technological innovation is a primary driver, fueled by advancements in display technology (4K, 8K, OLED, QLED), processing power, and streaming capabilities. Regulatory frameworks concerning data privacy and content licensing significantly influence market dynamics. The rise of streaming services acts as a strong substitute for traditional cable television, driving market expansion. End-user demographics are shifting towards younger, tech-savvy consumers who prefer on-demand content and personalized viewing experiences. M&A activity remains moderate, with strategic acquisitions aimed at expanding product portfolios and market reach.
- Market Concentration: Moderate, with top 5 players holding approximately xx% market share in 2024.
- Technological Innovation: Key drivers include advancements in display resolution (4K, 8K), HDR technology, and AI-powered features.
- Regulatory Frameworks: Data privacy regulations and content licensing agreements impact market operations.
- Competitive Product Substitutes: Streaming services and online video platforms pose a significant threat to traditional cable TV.
- End-User Demographics: Shifting towards younger consumers with high internet penetration and streaming subscriptions.
- M&A Trends: Strategic acquisitions focused on expanding product lines and geographic reach, with xx deals recorded in 2024.
Connected TV Market Growth Trends & Insights
The Connected TV market exhibits robust growth, driven by increasing internet penetration, rising disposable incomes, and the proliferation of streaming services. Market size is projected to reach xx million units by 2033, demonstrating a CAGR of xx% from 2025 to 2033. Adoption rates are highest in developed economies, with saturation nearing completion in some regions. However, significant growth opportunities remain in developing markets. Technological disruptions, such as the introduction of 8K resolution and advancements in AI-powered features, are fueling further market expansion. Consumer behavior shifts toward personalized content recommendations and immersive viewing experiences are driving demand for premium connected TVs and streaming media players. The shift from traditional TV viewing to streaming platforms is further accelerating this growth.
Dominant Regions, Countries, or Segments in Connected TV Market
North America and Asia-Pacific currently dominate the Connected TV market, driven by high internet penetration rates, strong consumer spending power, and a rapidly expanding middle class in developing Asian economies. Within these regions, key countries such as the USA, China, India, and Japan exhibit the highest market share and growth potential. The Smart TV segment constitutes the largest portion of the market, accounting for xx million units in 2024, with 4K and higher resolution TVs increasingly dominating. The Streaming Media Player segment is also experiencing substantial growth, driven by the popularity of streaming services and the increasing affordability of these devices.
- Dominant Regions: North America and Asia-Pacific.
- Key Countries: USA, China, India, Japan.
- Dominant Segment: Smart TVs (xx million units in 2024).
- Growth Drivers: High internet penetration, rising disposable incomes, and increasing demand for streaming content.
Connected TV Market Product Landscape
The Connected TV market offers a diverse range of products, including Smart TVs with varying screen sizes, resolutions (4K, 8K), and smart features, and streaming media players offering diverse content access options. Innovations focus on improved picture quality (e.g., HDR, OLED), enhanced audio capabilities, AI-powered features (voice control, content recommendations), and seamless integration with smart home ecosystems. Unique selling propositions center around display technology, processing power, user interface design, and content integration with popular streaming services. Technological advancements are continually pushing the boundaries of viewing experience and expanding features.
Key Drivers, Barriers & Challenges in Connected TV Market
Key Drivers: Increasing internet and mobile penetration, rising disposable incomes in emerging economies, growing adoption of streaming services, technological advancements in display and audio technology, and the launch of new, feature-rich smart TVs and streaming devices.
Challenges and Restraints: High initial investment costs for premium connected TVs, increasing competition from budget-friendly models, concerns about data privacy and security, the complexity of navigating smart TV interfaces for older users, supply chain disruptions impacting production and distribution, and varying regulatory frameworks across different countries. Supply chain disruptions led to a xx% decrease in production in 2022, impacting market growth.
Emerging Opportunities in Connected TV Market
Emerging opportunities exist in expanding into untapped markets in Africa and Latin America, developing new applications for connected TVs (e.g., gaming, fitness, education), leveraging AI and machine learning to personalize the viewing experience, and catering to specific niche markets with customized features and content. The increasing demand for 8K resolution displays offers a significant expansion opportunity.
Growth Accelerators in the Connected TV Market Industry
Strategic partnerships between TV manufacturers, content providers, and technology companies, the development of innovative technologies such as 8K resolution, HDR, and improved AI, and the expansion into new markets with unmet demands are key catalysts for long-term growth.
Key Players Shaping the Connected TV Market Market
- Panasonic
- Amazon (streaming media player - Fire TV)
- Hisense
- Apple (streaming media player - Apple TV)
- Skyworth
- Google (Chromecast)
- Sharp Electronics
- Xiaomi Corporation
- TCL
- Haier Group
- Vizio Inc
- Roku (streaming media player - Roku)
- Samsung Corporation
- LG Electronics
- Sony Corporation
Notable Milestones in Connected TV Market Sector
- May 2023: Blaupunkt and Flipkart partnered to launch the 40-inch Android TV Sigma series.
- May 2023: Hisense launched its ULED X and U8 TV products in the UAE, increasing brand awareness by 25 percentage points.
- November 2022: Samsung launched the Samsung Crystal 55AU7700 55-inch Ultra HD 4K Smart LED TV in India.
In-Depth Connected TV Market Market Outlook
The Connected TV market presents substantial future potential, driven by technological advancements, increasing internet penetration, and evolving consumer preferences. Strategic opportunities abound in expanding into new markets, developing innovative applications, and strengthening partnerships to capitalize on the burgeoning demand for high-quality, feature-rich connected television experiences. The continued shift towards streaming services will further fuel market growth in the coming years.
Connected TV Market Segmentation
-
1. Device
-
1.1. Smart TV
- 1.1.1. Smart TV
- 1.1.2. Smart TV
- 1.1.3. Key shif
- 1.2. Streamin
-
1.1. Smart TV
Connected TV Market Segmentation By Geography
-
1. North America
- 1.1. United States
- 1.2. Canada
-
2. Europe
- 2.1. United Kingdom
- 2.2. Germany
- 2.3. France
-
3. Asia
- 3.1. China
- 3.2. India
- 3.3. Japan
- 3.4. Australia and New Zealand
- 4. Latin America
- 5. Middle East and Africa
Connected TV Market REPORT HIGHLIGHTS
| Aspects | Details |
|---|---|
| Study Period | 2019-2033 |
| Base Year | 2024 |
| Estimated Year | 2025 |
| Forecast Period | 2025-2033 |
| Historical Period | 2019-2024 |
| Growth Rate | CAGR of 13.20% from 2019-2033 |
| Segmentation |
|
Table of Contents
- 1. Introduction
- 1.1. Research Scope
- 1.2. Market Segmentation
- 1.3. Research Methodology
- 1.4. Definitions and Assumptions
- 2. Executive Summary
- 2.1. Introduction
- 3. Market Dynamics
- 3.1. Introduction
- 3.2. Market Drivers
- 3.2.1. Growing internet penetration and anticipated shift from conventional TVs; Industry collaborations and favorable market conditions (shift from internet TV to smart TV)
- 3.3. Market Restrains
- 3.3.1. The Need for High Investment in Content Creation and Broadcasting; Bandwidth Allocation for 4K Resolution
- 3.4. Market Trends
- 3.4.1. Smart TV Accounts for the Largest Market Share
- 4. Market Factor Analysis
- 4.1. Porters Five Forces
- 4.2. Supply/Value Chain
- 4.3. PESTEL analysis
- 4.4. Market Entropy
- 4.5. Patent/Trademark Analysis
- 5. Global Connected TV Market Analysis, Insights and Forecast, 2019-2031
- 5.1. Market Analysis, Insights and Forecast - by Device
- 5.1.1. Smart TV
- 5.1.1.1. Smart TV
- 5.1.1.2. Smart TV
- 5.1.1.3. Key shif
- 5.1.2. Streamin
- 5.1.1. Smart TV
- 5.2. Market Analysis, Insights and Forecast - by Region
- 5.2.1. North America
- 5.2.2. Europe
- 5.2.3. Asia
- 5.2.4. Latin America
- 5.2.5. Middle East and Africa
- 5.1. Market Analysis, Insights and Forecast - by Device
- 6. North America Connected TV Market Analysis, Insights and Forecast, 2019-2031
- 6.1. Market Analysis, Insights and Forecast - by Device
- 6.1.1. Smart TV
- 6.1.1.1. Smart TV
- 6.1.1.2. Smart TV
- 6.1.1.3. Key shif
- 6.1.2. Streamin
- 6.1.1. Smart TV
- 6.1. Market Analysis, Insights and Forecast - by Device
- 7. Europe Connected TV Market Analysis, Insights and Forecast, 2019-2031
- 7.1. Market Analysis, Insights and Forecast - by Device
- 7.1.1. Smart TV
- 7.1.1.1. Smart TV
- 7.1.1.2. Smart TV
- 7.1.1.3. Key shif
- 7.1.2. Streamin
- 7.1.1. Smart TV
- 7.1. Market Analysis, Insights and Forecast - by Device
- 8. Asia Connected TV Market Analysis, Insights and Forecast, 2019-2031
- 8.1. Market Analysis, Insights and Forecast - by Device
- 8.1.1. Smart TV
- 8.1.1.1. Smart TV
- 8.1.1.2. Smart TV
- 8.1.1.3. Key shif
- 8.1.2. Streamin
- 8.1.1. Smart TV
- 8.1. Market Analysis, Insights and Forecast - by Device
- 9. Latin America Connected TV Market Analysis, Insights and Forecast, 2019-2031
- 9.1. Market Analysis, Insights and Forecast - by Device
- 9.1.1. Smart TV
- 9.1.1.1. Smart TV
- 9.1.1.2. Smart TV
- 9.1.1.3. Key shif
- 9.1.2. Streamin
- 9.1.1. Smart TV
- 9.1. Market Analysis, Insights and Forecast - by Device
- 10. Middle East and Africa Connected TV Market Analysis, Insights and Forecast, 2019-2031
- 10.1. Market Analysis, Insights and Forecast - by Device
- 10.1.1. Smart TV
- 10.1.1.1. Smart TV
- 10.1.1.2. Smart TV
- 10.1.1.3. Key shif
- 10.1.2. Streamin
- 10.1.1. Smart TV
- 10.1. Market Analysis, Insights and Forecast - by Device
- 11. North America Connected TV Market Analysis, Insights and Forecast, 2019-2031
- 11.1. Market Analysis, Insights and Forecast - By Country/Sub-region
- 11.1.1 United States
- 11.1.2 Canada
- 12. Europe Connected TV Market Analysis, Insights and Forecast, 2019-2031
- 12.1. Market Analysis, Insights and Forecast - By Country/Sub-region
- 12.1.1 United Kingdom
- 12.1.2 Germany
- 12.1.3 France
- 12.1.4 Rest of Europe
- 13. Asia Pacific Connected TV Market Analysis, Insights and Forecast, 2019-2031
- 13.1. Market Analysis, Insights and Forecast - By Country/Sub-region
- 13.1.1 China
- 13.1.2 India
- 13.1.3 Japan
- 13.1.4 Rest of Asia Pacific
- 14. Latin America Connected TV Market Analysis, Insights and Forecast, 2019-2031
- 14.1. Market Analysis, Insights and Forecast - By Country/Sub-region
- 14.1.1.
- 15. Middle East and Africa Connected TV Market Analysis, Insights and Forecast, 2019-2031
- 15.1. Market Analysis, Insights and Forecast - By Country/Sub-region
- 15.1.1.
- 16. Competitive Analysis
- 16.1. Global Market Share Analysis 2024
- 16.2. Company Profiles
- 16.2.1 Panasonic
- 16.2.1.1. Overview
- 16.2.1.2. Products
- 16.2.1.3. SWOT Analysis
- 16.2.1.4. Recent Developments
- 16.2.1.5. Financials (Based on Availability)
- 16.2.2 Amazon (streaming media player - Fire TV)
- 16.2.2.1. Overview
- 16.2.2.2. Products
- 16.2.2.3. SWOT Analysis
- 16.2.2.4. Recent Developments
- 16.2.2.5. Financials (Based on Availability)
- 16.2.3 Hisense
- 16.2.3.1. Overview
- 16.2.3.2. Products
- 16.2.3.3. SWOT Analysis
- 16.2.3.4. Recent Developments
- 16.2.3.5. Financials (Based on Availability)
- 16.2.4 Apple (streaming media player - Apple TV)
- 16.2.4.1. Overview
- 16.2.4.2. Products
- 16.2.4.3. SWOT Analysis
- 16.2.4.4. Recent Developments
- 16.2.4.5. Financials (Based on Availability)
- 16.2.5 Skyworth
- 16.2.5.1. Overview
- 16.2.5.2. Products
- 16.2.5.3. SWOT Analysis
- 16.2.5.4. Recent Developments
- 16.2.5.5. Financials (Based on Availability)
- 16.2.6 Google (Chromecast)*List Not Exhaustive
- 16.2.6.1. Overview
- 16.2.6.2. Products
- 16.2.6.3. SWOT Analysis
- 16.2.6.4. Recent Developments
- 16.2.6.5. Financials (Based on Availability)
- 16.2.7 Sharp Electronics
- 16.2.7.1. Overview
- 16.2.7.2. Products
- 16.2.7.3. SWOT Analysis
- 16.2.7.4. Recent Developments
- 16.2.7.5. Financials (Based on Availability)
- 16.2.8 Xiaomi Corporation
- 16.2.8.1. Overview
- 16.2.8.2. Products
- 16.2.8.3. SWOT Analysis
- 16.2.8.4. Recent Developments
- 16.2.8.5. Financials (Based on Availability)
- 16.2.9 TCL
- 16.2.9.1. Overview
- 16.2.9.2. Products
- 16.2.9.3. SWOT Analysis
- 16.2.9.4. Recent Developments
- 16.2.9.5. Financials (Based on Availability)
- 16.2.10 Haier Group
- 16.2.10.1. Overview
- 16.2.10.2. Products
- 16.2.10.3. SWOT Analysis
- 16.2.10.4. Recent Developments
- 16.2.10.5. Financials (Based on Availability)
- 16.2.11 Vizio Inc
- 16.2.11.1. Overview
- 16.2.11.2. Products
- 16.2.11.3. SWOT Analysis
- 16.2.11.4. Recent Developments
- 16.2.11.5. Financials (Based on Availability)
- 16.2.12 Roku (streaming media player - Roku)
- 16.2.12.1. Overview
- 16.2.12.2. Products
- 16.2.12.3. SWOT Analysis
- 16.2.12.4. Recent Developments
- 16.2.12.5. Financials (Based on Availability)
- 16.2.13 Samsung Corporation
- 16.2.13.1. Overview
- 16.2.13.2. Products
- 16.2.13.3. SWOT Analysis
- 16.2.13.4. Recent Developments
- 16.2.13.5. Financials (Based on Availability)
- 16.2.14 LG Electronics
- 16.2.14.1. Overview
- 16.2.14.2. Products
- 16.2.14.3. SWOT Analysis
- 16.2.14.4. Recent Developments
- 16.2.14.5. Financials (Based on Availability)
- 16.2.15 Sony Corporation
- 16.2.15.1. Overview
- 16.2.15.2. Products
- 16.2.15.3. SWOT Analysis
- 16.2.15.4. Recent Developments
- 16.2.15.5. Financials (Based on Availability)
- 16.2.1 Panasonic
List of Figures
- Figure 1: Global Connected TV Market Revenue Breakdown (Million, %) by Region 2024 & 2032
- Figure 2: North America Connected TV Market Revenue (Million), by Country 2024 & 2032
- Figure 3: North America Connected TV Market Revenue Share (%), by Country 2024 & 2032
- Figure 4: Europe Connected TV Market Revenue (Million), by Country 2024 & 2032
- Figure 5: Europe Connected TV Market Revenue Share (%), by Country 2024 & 2032
- Figure 6: Asia Pacific Connected TV Market Revenue (Million), by Country 2024 & 2032
- Figure 7: Asia Pacific Connected TV Market Revenue Share (%), by Country 2024 & 2032
- Figure 8: Latin America Connected TV Market Revenue (Million), by Country 2024 & 2032
- Figure 9: Latin America Connected TV Market Revenue Share (%), by Country 2024 & 2032
- Figure 10: Middle East and Africa Connected TV Market Revenue (Million), by Country 2024 & 2032
- Figure 11: Middle East and Africa Connected TV Market Revenue Share (%), by Country 2024 & 2032
- Figure 12: North America Connected TV Market Revenue (Million), by Device 2024 & 2032
- Figure 13: North America Connected TV Market Revenue Share (%), by Device 2024 & 2032
- Figure 14: North America Connected TV Market Revenue (Million), by Country 2024 & 2032
- Figure 15: North America Connected TV Market Revenue Share (%), by Country 2024 & 2032
- Figure 16: Europe Connected TV Market Revenue (Million), by Device 2024 & 2032
- Figure 17: Europe Connected TV Market Revenue Share (%), by Device 2024 & 2032
- Figure 18: Europe Connected TV Market Revenue (Million), by Country 2024 & 2032
- Figure 19: Europe Connected TV Market Revenue Share (%), by Country 2024 & 2032
- Figure 20: Asia Connected TV Market Revenue (Million), by Device 2024 & 2032
- Figure 21: Asia Connected TV Market Revenue Share (%), by Device 2024 & 2032
- Figure 22: Asia Connected TV Market Revenue (Million), by Country 2024 & 2032
- Figure 23: Asia Connected TV Market Revenue Share (%), by Country 2024 & 2032
- Figure 24: Latin America Connected TV Market Revenue (Million), by Device 2024 & 2032
- Figure 25: Latin America Connected TV Market Revenue Share (%), by Device 2024 & 2032
- Figure 26: Latin America Connected TV Market Revenue (Million), by Country 2024 & 2032
- Figure 27: Latin America Connected TV Market Revenue Share (%), by Country 2024 & 2032
- Figure 28: Middle East and Africa Connected TV Market Revenue (Million), by Device 2024 & 2032
- Figure 29: Middle East and Africa Connected TV Market Revenue Share (%), by Device 2024 & 2032
- Figure 30: Middle East and Africa Connected TV Market Revenue (Million), by Country 2024 & 2032
- Figure 31: Middle East and Africa Connected TV Market Revenue Share (%), by Country 2024 & 2032
List of Tables
- Table 1: Global Connected TV Market Revenue Million Forecast, by Region 2019 & 2032
- Table 2: Global Connected TV Market Revenue Million Forecast, by Device 2019 & 2032
- Table 3: Global Connected TV Market Revenue Million Forecast, by Region 2019 & 2032
- Table 4: Global Connected TV Market Revenue Million Forecast, by Country 2019 & 2032
- Table 5: United States Connected TV Market Revenue (Million) Forecast, by Application 2019 & 2032
- Table 6: Canada Connected TV Market Revenue (Million) Forecast, by Application 2019 & 2032
- Table 7: Global Connected TV Market Revenue Million Forecast, by Country 2019 & 2032
- Table 8: United Kingdom Connected TV Market Revenue (Million) Forecast, by Application 2019 & 2032
- Table 9: Germany Connected TV Market Revenue (Million) Forecast, by Application 2019 & 2032
- Table 10: France Connected TV Market Revenue (Million) Forecast, by Application 2019 & 2032
- Table 11: Rest of Europe Connected TV Market Revenue (Million) Forecast, by Application 2019 & 2032
- Table 12: Global Connected TV Market Revenue Million Forecast, by Country 2019 & 2032
- Table 13: China Connected TV Market Revenue (Million) Forecast, by Application 2019 & 2032
- Table 14: India Connected TV Market Revenue (Million) Forecast, by Application 2019 & 2032
- Table 15: Japan Connected TV Market Revenue (Million) Forecast, by Application 2019 & 2032
- Table 16: Rest of Asia Pacific Connected TV Market Revenue (Million) Forecast, by Application 2019 & 2032
- Table 17: Global Connected TV Market Revenue Million Forecast, by Country 2019 & 2032
- Table 18: Connected TV Market Revenue (Million) Forecast, by Application 2019 & 2032
- Table 19: Global Connected TV Market Revenue Million Forecast, by Country 2019 & 2032
- Table 20: Connected TV Market Revenue (Million) Forecast, by Application 2019 & 2032
- Table 21: Global Connected TV Market Revenue Million Forecast, by Device 2019 & 2032
- Table 22: Global Connected TV Market Revenue Million Forecast, by Country 2019 & 2032
- Table 23: United States Connected TV Market Revenue (Million) Forecast, by Application 2019 & 2032
- Table 24: Canada Connected TV Market Revenue (Million) Forecast, by Application 2019 & 2032
- Table 25: Global Connected TV Market Revenue Million Forecast, by Device 2019 & 2032
- Table 26: Global Connected TV Market Revenue Million Forecast, by Country 2019 & 2032
- Table 27: United Kingdom Connected TV Market Revenue (Million) Forecast, by Application 2019 & 2032
- Table 28: Germany Connected TV Market Revenue (Million) Forecast, by Application 2019 & 2032
- Table 29: France Connected TV Market Revenue (Million) Forecast, by Application 2019 & 2032
- Table 30: Global Connected TV Market Revenue Million Forecast, by Device 2019 & 2032
- Table 31: Global Connected TV Market Revenue Million Forecast, by Country 2019 & 2032
- Table 32: China Connected TV Market Revenue (Million) Forecast, by Application 2019 & 2032
- Table 33: India Connected TV Market Revenue (Million) Forecast, by Application 2019 & 2032
- Table 34: Japan Connected TV Market Revenue (Million) Forecast, by Application 2019 & 2032
- Table 35: Australia and New Zealand Connected TV Market Revenue (Million) Forecast, by Application 2019 & 2032
- Table 36: Global Connected TV Market Revenue Million Forecast, by Device 2019 & 2032
- Table 37: Global Connected TV Market Revenue Million Forecast, by Country 2019 & 2032
- Table 38: Global Connected TV Market Revenue Million Forecast, by Device 2019 & 2032
- Table 39: Global Connected TV Market Revenue Million Forecast, by Country 2019 & 2032
Frequently Asked Questions
1. What is the projected Compound Annual Growth Rate (CAGR) of the Connected TV Market?
The projected CAGR is approximately 13.20%.
2. Which companies are prominent players in the Connected TV Market?
Key companies in the market include Panasonic, Amazon (streaming media player - Fire TV), Hisense, Apple (streaming media player - Apple TV), Skyworth, Google (Chromecast)*List Not Exhaustive, Sharp Electronics, Xiaomi Corporation, TCL, Haier Group, Vizio Inc, Roku (streaming media player - Roku), Samsung Corporation, LG Electronics, Sony Corporation.
3. What are the main segments of the Connected TV Market?
The market segments include Device.
4. Can you provide details about the market size?
The market size is estimated to be USD 9.28 Million as of 2022.
5. What are some drivers contributing to market growth?
Growing internet penetration and anticipated shift from conventional TVs; Industry collaborations and favorable market conditions (shift from internet TV to smart TV).
6. What are the notable trends driving market growth?
Smart TV Accounts for the Largest Market Share.
7. Are there any restraints impacting market growth?
The Need for High Investment in Content Creation and Broadcasting; Bandwidth Allocation for 4K Resolution.
8. Can you provide examples of recent developments in the market?
May 2023: Blaupunkt and Flipkart announced a partnership to launch the 40-inch Android TV Sigma series. The new Blaupunkt Sigma Series Android TV has a bezel-less design, 512 MB RAM, 4 GB ROM, two bottom-firing built-in speakers with surround sound technology, and 3 HDMI and 2 USB ports.
9. What pricing options are available for accessing the report?
Pricing options include single-user, multi-user, and enterprise licenses priced at USD 4750, USD 5250, and USD 8750 respectively.
10. Is the market size provided in terms of value or volume?
The market size is provided in terms of value, measured in Million.
11. Are there any specific market keywords associated with the report?
Yes, the market keyword associated with the report is "Connected TV Market," which aids in identifying and referencing the specific market segment covered.
12. How do I determine which pricing option suits my needs best?
The pricing options vary based on user requirements and access needs. Individual users may opt for single-user licenses, while businesses requiring broader access may choose multi-user or enterprise licenses for cost-effective access to the report.
13. Are there any additional resources or data provided in the Connected TV Market report?
While the report offers comprehensive insights, it's advisable to review the specific contents or supplementary materials provided to ascertain if additional resources or data are available.
14. How can I stay updated on further developments or reports in the Connected TV Market?
To stay informed about further developments, trends, and reports in the Connected TV Market, consider subscribing to industry newsletters, following relevant companies and organizations, or regularly checking reputable industry news sources and publications.
Methodology
Step 1 - Identification of Relevant Samples Size from Population Database


Step 2 - Approaches for Defining Global Market Size (Value, Volume* & Price*)

Note*: In applicable scenarios
Step 3 - Data Sources
Primary Research
- Web Analytics
- Survey Reports
- Research Institute
- Latest Research Reports
- Opinion Leaders
Secondary Research
- Annual Reports
- White Paper
- Latest Press Release
- Industry Association
- Paid Database
- Investor Presentations

Step 4 - Data Triangulation
Involves using different sources of information in order to increase the validity of a study
These sources are likely to be stakeholders in a program - participants, other researchers, program staff, other community members, and so on.
Then we put all data in single framework & apply various statistical tools to find out the dynamic on the market.
During the analysis stage, feedback from the stakeholder groups would be compared to determine areas of agreement as well as areas of divergence


