
Key Insights
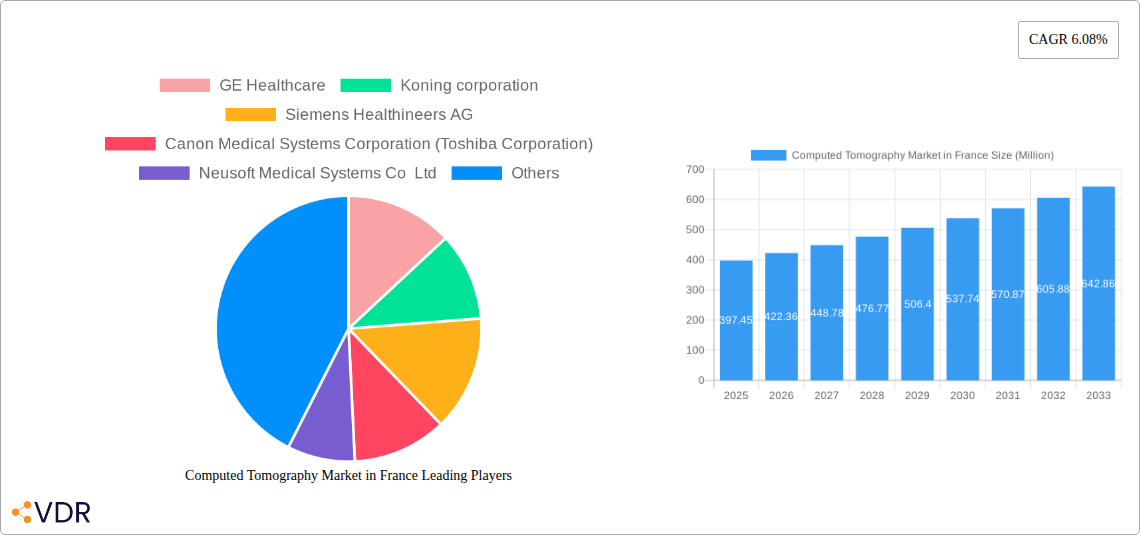
The French Computed Tomography (CT) market, valued at €397.45 million in 2025, is poised for substantial growth, exhibiting a Compound Annual Growth Rate (CAGR) of 6.08% from 2025 to 2033. This expansion is driven by several key factors. The increasing prevalence of chronic diseases like cardiovascular conditions, cancer, and neurological disorders necessitates advanced diagnostic imaging techniques, boosting CT scan demand. Technological advancements, including the introduction of multi-slice CT scanners with improved image quality and faster scan times, are further fueling market growth. Additionally, rising healthcare expenditure and government initiatives promoting advanced medical infrastructure contribute to the market's positive trajectory. The market is segmented by slice type (low, medium, high), application (oncology, neurology, cardiovascular, musculoskeletal, other), and end-user (hospitals, diagnostic centers, others). Hospitals currently dominate the end-user segment, owing to their extensive diagnostic capabilities and patient volume. However, the growth of private diagnostic centers is expected to increase market competition and expand access to CT scans. While the market faces restraints such as high equipment costs and the need for skilled technicians, the overall positive growth outlook remains strong due to the aforementioned drivers.
The competitive landscape is characterized by a mix of established global players like GE Healthcare, Siemens Healthineers, and Philips, alongside regional players. These companies are constantly innovating to offer advanced CT solutions, including AI-powered image analysis tools and improved radiation dose reduction techniques. Strategic partnerships and mergers and acquisitions are expected to reshape the market dynamics in the coming years. The French market’s growth will also be influenced by factors such as the national healthcare policies, reimbursement rates for CT scans, and the adoption of telehealth technologies. The forecast period of 2025-2033 anticipates a continued upward trajectory, fueled by the aforementioned market dynamics and the increasing importance of early and accurate diagnosis across various medical specialties.
Computed Tomography (CT) Market in France: A Comprehensive Market Report (2019-2033)
This in-depth report provides a comprehensive analysis of the Computed Tomography (CT) market in France, covering market dynamics, growth trends, regional segmentation, product landscape, key players, and future outlook. The report utilizes data from 2019-2024 (historical period), with the base year being 2025 and forecasts extending to 2033. The French CT market is segmented by type (Low Slice, Medium Slice, High Slice), application (Oncology, Neurology, Cardiovascular, Musculoskeletal, Other Applications), and end-user (Hospitals, Diagnostic Centers, Other End Users). The total market value in 2025 is estimated at xx Million.
Computed Tomography Market in France Market Dynamics & Structure
The French CT market is characterized by a moderately concentrated structure, with key players like GE Healthcare, Siemens Healthineers AG, and Philips holding significant market share. Technological innovation, particularly in areas like photon-counting detectors and AI-powered image analysis, is a primary growth driver. Stringent regulatory frameworks and reimbursement policies influence market access and adoption. The market also faces competition from alternative imaging modalities like MRI and ultrasound. M&A activity has been relatively modest in recent years, with a recorded xx number of deals between 2019 and 2024. The average deal value was xx Million.
- Market Concentration: Moderately concentrated, with top 3 players holding approximately xx% market share in 2025.
- Technological Innovation: Key drivers include photon-counting CT, AI-driven image analysis, and improved image resolution.
- Regulatory Framework: Stringent regulations impact market access and pricing.
- Competitive Substitutes: MRI and ultrasound pose competitive pressure.
- End-User Demographics: Aging population and increasing prevalence of chronic diseases drive demand.
- M&A Trends: Moderate M&A activity with xx deals between 2019-2024, averaging xx Million per deal.
Computed Tomography Market in France Growth Trends & Insights
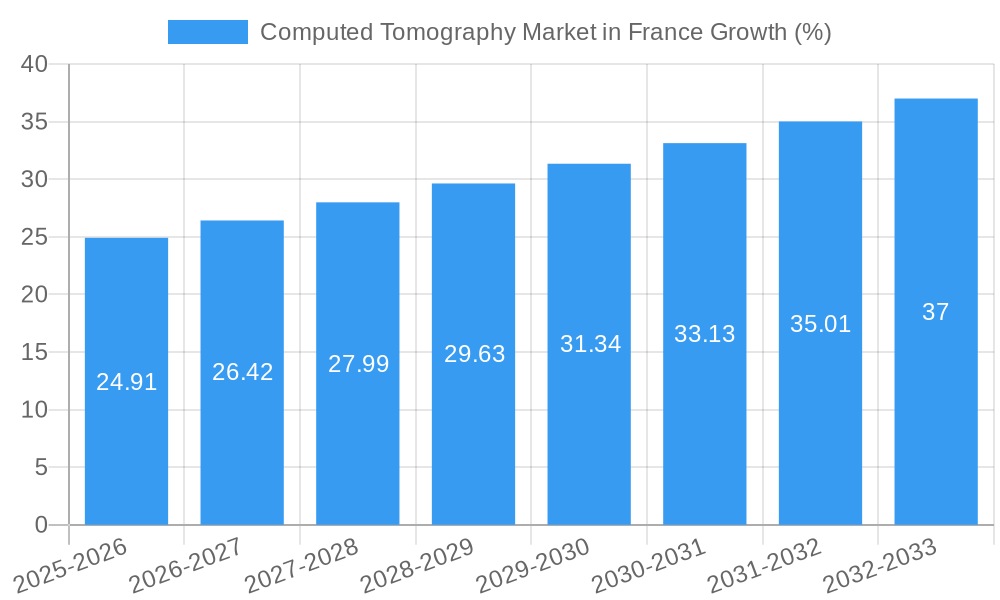
The French CT market experienced a CAGR of xx% during the historical period (2019-2024), reaching an estimated xx Million in 2025. This growth is attributed to factors such as increasing prevalence of chronic diseases, rising healthcare expenditure, technological advancements, and government initiatives to improve healthcare infrastructure. Adoption rates are higher in urban areas compared to rural regions. The market is witnessing a shift towards advanced CT technologies, particularly high-slice CT scanners, driven by demand for improved diagnostic accuracy and speed. Consumer behavior shows a preference for high-quality, faster, and more comfortable imaging procedures. The forecast period (2025-2033) projects a CAGR of xx%, reaching xx Million by 2033. Market penetration in rural areas is expected to gradually increase due to better infrastructure and improved healthcare accessibility.
Dominant Regions, Countries, or Segments in Computed Tomography Market in France
The Ile-de-France region dominates the French CT market, accounting for approximately xx% of total market value in 2025. This dominance stems from high healthcare infrastructure concentration and a large patient population. Within applications, Oncology and Cardiovascular imaging constitute the largest segments, with Oncology holding xx% and Cardiovascular holding xx% of the market. High-slice CT scanners are experiencing the fastest growth due to their advanced capabilities.
- Key Drivers (Ile-de-France): High concentration of hospitals, specialized diagnostic centers, and medical professionals.
- Key Drivers (Oncology): Rising cancer incidence rates and increasing demand for advanced diagnostic tools.
- Key Drivers (Cardiovascular): Growing prevalence of cardiovascular diseases and demand for faster, more accurate diagnosis.
- Key Drivers (High-Slice CT): Superior image quality and faster scan times.
Computed Tomography Market in France Product Landscape
The French CT market offers a range of scanners, from low-slice to high-slice systems, each catering to specific clinical needs. Recent innovations include photon-counting detectors, which enable improved image quality and reduced radiation dose, and AI-powered image reconstruction algorithms that enhance diagnostic accuracy and efficiency. Manufacturers focus on enhanced user experience, integrated workflow solutions, and reduced operational costs as unique selling propositions.
Key Drivers, Barriers & Challenges in Computed Tomography Market in France
Key Drivers: Technological advancements (e.g., photon-counting CT), rising prevalence of chronic diseases, increasing healthcare spending, and government initiatives promoting healthcare infrastructure development.
Key Challenges: High initial investment costs for advanced CT systems, limited reimbursement coverage in certain regions, competition from alternative imaging modalities, and potential supply chain disruptions. The impact of these challenges on market growth is estimated to be approximately xx% by 2033.
Emerging Opportunities in Computed Tomography Market in France
Emerging opportunities include the growing adoption of AI-powered image analysis tools, expansion into underserved rural areas, development of specialized CT applications for specific diseases (e.g., lung cancer screening), and increasing use of telehealth to integrate CT scans into remote patient care.
Growth Accelerators in the Computed Tomography Market in France Industry
Long-term growth will be driven by continued technological innovations, strategic partnerships between manufacturers and healthcare providers, expansion into new clinical applications, and increasing focus on preventive healthcare and early disease detection.
Key Players Shaping the Computed Tomography Market in France Market
- GE Healthcare
- Koning corporation
- Siemens Healthineers AG
- Canon Medical Systems Corporation (Toshiba Corporation)
- Neusoft Medical Systems Co Ltd
- Carestream Health
- Koninklijke Philips NV
- J Morita Corporation
- Planmeca Group (Planmed OY)
- SAMSUNG ELECTRONICS CO LTD (SAMSUNG MEDISON)
- Fujifilm Holdings Corporation
Notable Milestones in Computed Tomography Market in France Sector
- November 2021: Siemens Healthineers launched the NAEOTOM Alpha, the world's first photon-counting CT scanner, in Europe. This significantly advanced image quality and reduced radiation dose.
- December 2020: Philips launched its next-generation Azurion platform with SmartCT in France, enhancing 3D imaging capabilities.
In-Depth Computed Tomography Market in France Market Outlook
The French CT market is poised for strong growth in the coming years, driven by technological advancements, increasing healthcare expenditure, and a growing need for advanced diagnostic imaging. Strategic partnerships, expansion into new applications, and a focus on improving healthcare accessibility will further accelerate market growth. The market is expected to see continued adoption of advanced CT technologies, such as photon-counting CT and AI-powered image analysis, leading to improved diagnostic capabilities and patient outcomes. The focus on preventive healthcare will also drive the demand for CT scans for early disease detection.
Computed Tomography Market in France Segmentation
-
1. Type
- 1.1. Low Slice
- 1.2. Medium Slice
- 1.3. High Slice
-
2. Application
- 2.1. Oncology
- 2.2. Neurology
- 2.3. Cardiovascular
- 2.4. Musculoskeletal
- 2.5. Other Applications
-
3. End User
- 3.1. Hospitals
- 3.2. Diagnostic Centers
- 3.3. Other End Users
Computed Tomography Market in France Segmentation By Geography
-
1. North America
- 1.1. United States
- 1.2. Canada
- 1.3. Mexico
-
2. South America
- 2.1. Brazil
- 2.2. Argentina
- 2.3. Rest of South America
-
3. Europe
- 3.1. United Kingdom
- 3.2. Germany
- 3.3. France
- 3.4. Italy
- 3.5. Spain
- 3.6. Russia
- 3.7. Benelux
- 3.8. Nordics
- 3.9. Rest of Europe
-
4. Middle East & Africa
- 4.1. Turkey
- 4.2. Israel
- 4.3. GCC
- 4.4. North Africa
- 4.5. South Africa
- 4.6. Rest of Middle East & Africa
-
5. Asia Pacific
- 5.1. China
- 5.2. India
- 5.3. Japan
- 5.4. South Korea
- 5.5. ASEAN
- 5.6. Oceania
- 5.7. Rest of Asia Pacific
Computed Tomography Market in France REPORT HIGHLIGHTS
| Aspects | Details |
|---|---|
| Study Period | 2019-2033 |
| Base Year | 2024 |
| Estimated Year | 2025 |
| Forecast Period | 2025-2033 |
| Historical Period | 2019-2024 |
| Growth Rate | CAGR of 6.08% from 2019-2033 |
| Segmentation |
|
Table of Contents
- 1. Introduction
- 1.1. Research Scope
- 1.2. Market Segmentation
- 1.3. Research Methodology
- 1.4. Definitions and Assumptions
- 2. Executive Summary
- 2.1. Introduction
- 3. Market Dynamics
- 3.1. Introduction
- 3.2. Market Drivers
- 3.2.1. Increasing Prevalence of Chronic Diseases; Rising Geriatric Population; Increasing Technological Advancements
- 3.3. Market Restrains
- 3.3.1. Lack Of Proper Reimbursement And Stringent Regulatory Approval Procedures; High Cost of Equipment
- 3.4. Market Trends
- 3.4.1. Oncology Segment is Expected to Hold a Significant Market Share Over the Forecast Period
- 4. Market Factor Analysis
- 4.1. Porters Five Forces
- 4.2. Supply/Value Chain
- 4.3. PESTEL analysis
- 4.4. Market Entropy
- 4.5. Patent/Trademark Analysis
- 5. Global Computed Tomography Market in France Analysis, Insights and Forecast, 2019-2031
- 5.1. Market Analysis, Insights and Forecast - by Type
- 5.1.1. Low Slice
- 5.1.2. Medium Slice
- 5.1.3. High Slice
- 5.2. Market Analysis, Insights and Forecast - by Application
- 5.2.1. Oncology
- 5.2.2. Neurology
- 5.2.3. Cardiovascular
- 5.2.4. Musculoskeletal
- 5.2.5. Other Applications
- 5.3. Market Analysis, Insights and Forecast - by End User
- 5.3.1. Hospitals
- 5.3.2. Diagnostic Centers
- 5.3.3. Other End Users
- 5.4. Market Analysis, Insights and Forecast - by Region
- 5.4.1. North America
- 5.4.2. South America
- 5.4.3. Europe
- 5.4.4. Middle East & Africa
- 5.4.5. Asia Pacific
- 5.1. Market Analysis, Insights and Forecast - by Type
- 6. North America Computed Tomography Market in France Analysis, Insights and Forecast, 2019-2031
- 6.1. Market Analysis, Insights and Forecast - by Type
- 6.1.1. Low Slice
- 6.1.2. Medium Slice
- 6.1.3. High Slice
- 6.2. Market Analysis, Insights and Forecast - by Application
- 6.2.1. Oncology
- 6.2.2. Neurology
- 6.2.3. Cardiovascular
- 6.2.4. Musculoskeletal
- 6.2.5. Other Applications
- 6.3. Market Analysis, Insights and Forecast - by End User
- 6.3.1. Hospitals
- 6.3.2. Diagnostic Centers
- 6.3.3. Other End Users
- 6.1. Market Analysis, Insights and Forecast - by Type
- 7. South America Computed Tomography Market in France Analysis, Insights and Forecast, 2019-2031
- 7.1. Market Analysis, Insights and Forecast - by Type
- 7.1.1. Low Slice
- 7.1.2. Medium Slice
- 7.1.3. High Slice
- 7.2. Market Analysis, Insights and Forecast - by Application
- 7.2.1. Oncology
- 7.2.2. Neurology
- 7.2.3. Cardiovascular
- 7.2.4. Musculoskeletal
- 7.2.5. Other Applications
- 7.3. Market Analysis, Insights and Forecast - by End User
- 7.3.1. Hospitals
- 7.3.2. Diagnostic Centers
- 7.3.3. Other End Users
- 7.1. Market Analysis, Insights and Forecast - by Type
- 8. Europe Computed Tomography Market in France Analysis, Insights and Forecast, 2019-2031
- 8.1. Market Analysis, Insights and Forecast - by Type
- 8.1.1. Low Slice
- 8.1.2. Medium Slice
- 8.1.3. High Slice
- 8.2. Market Analysis, Insights and Forecast - by Application
- 8.2.1. Oncology
- 8.2.2. Neurology
- 8.2.3. Cardiovascular
- 8.2.4. Musculoskeletal
- 8.2.5. Other Applications
- 8.3. Market Analysis, Insights and Forecast - by End User
- 8.3.1. Hospitals
- 8.3.2. Diagnostic Centers
- 8.3.3. Other End Users
- 8.1. Market Analysis, Insights and Forecast - by Type
- 9. Middle East & Africa Computed Tomography Market in France Analysis, Insights and Forecast, 2019-2031
- 9.1. Market Analysis, Insights and Forecast - by Type
- 9.1.1. Low Slice
- 9.1.2. Medium Slice
- 9.1.3. High Slice
- 9.2. Market Analysis, Insights and Forecast - by Application
- 9.2.1. Oncology
- 9.2.2. Neurology
- 9.2.3. Cardiovascular
- 9.2.4. Musculoskeletal
- 9.2.5. Other Applications
- 9.3. Market Analysis, Insights and Forecast - by End User
- 9.3.1. Hospitals
- 9.3.2. Diagnostic Centers
- 9.3.3. Other End Users
- 9.1. Market Analysis, Insights and Forecast - by Type
- 10. Asia Pacific Computed Tomography Market in France Analysis, Insights and Forecast, 2019-2031
- 10.1. Market Analysis, Insights and Forecast - by Type
- 10.1.1. Low Slice
- 10.1.2. Medium Slice
- 10.1.3. High Slice
- 10.2. Market Analysis, Insights and Forecast - by Application
- 10.2.1. Oncology
- 10.2.2. Neurology
- 10.2.3. Cardiovascular
- 10.2.4. Musculoskeletal
- 10.2.5. Other Applications
- 10.3. Market Analysis, Insights and Forecast - by End User
- 10.3.1. Hospitals
- 10.3.2. Diagnostic Centers
- 10.3.3. Other End Users
- 10.1. Market Analysis, Insights and Forecast - by Type
- 11. Competitive Analysis
- 11.1. Global Market Share Analysis 2024
- 11.2. Company Profiles
- 11.2.1 GE Healthcare
- 11.2.1.1. Overview
- 11.2.1.2. Products
- 11.2.1.3. SWOT Analysis
- 11.2.1.4. Recent Developments
- 11.2.1.5. Financials (Based on Availability)
- 11.2.2 Koning corporation
- 11.2.2.1. Overview
- 11.2.2.2. Products
- 11.2.2.3. SWOT Analysis
- 11.2.2.4. Recent Developments
- 11.2.2.5. Financials (Based on Availability)
- 11.2.3 Siemens Healthineers AG
- 11.2.3.1. Overview
- 11.2.3.2. Products
- 11.2.3.3. SWOT Analysis
- 11.2.3.4. Recent Developments
- 11.2.3.5. Financials (Based on Availability)
- 11.2.4 Canon Medical Systems Corporation (Toshiba Corporation)
- 11.2.4.1. Overview
- 11.2.4.2. Products
- 11.2.4.3. SWOT Analysis
- 11.2.4.4. Recent Developments
- 11.2.4.5. Financials (Based on Availability)
- 11.2.5 Neusoft Medical Systems Co Ltd
- 11.2.5.1. Overview
- 11.2.5.2. Products
- 11.2.5.3. SWOT Analysis
- 11.2.5.4. Recent Developments
- 11.2.5.5. Financials (Based on Availability)
- 11.2.6 Carestream Health
- 11.2.6.1. Overview
- 11.2.6.2. Products
- 11.2.6.3. SWOT Analysis
- 11.2.6.4. Recent Developments
- 11.2.6.5. Financials (Based on Availability)
- 11.2.7 Koninklijke Philips NV
- 11.2.7.1. Overview
- 11.2.7.2. Products
- 11.2.7.3. SWOT Analysis
- 11.2.7.4. Recent Developments
- 11.2.7.5. Financials (Based on Availability)
- 11.2.8 J Morita Corporation
- 11.2.8.1. Overview
- 11.2.8.2. Products
- 11.2.8.3. SWOT Analysis
- 11.2.8.4. Recent Developments
- 11.2.8.5. Financials (Based on Availability)
- 11.2.9 Planmeca Group (Planmed OY)
- 11.2.9.1. Overview
- 11.2.9.2. Products
- 11.2.9.3. SWOT Analysis
- 11.2.9.4. Recent Developments
- 11.2.9.5. Financials (Based on Availability)
- 11.2.10 SAMSUNG ELECTRONICS CO LTD (SAMSUNG MEDISON)
- 11.2.10.1. Overview
- 11.2.10.2. Products
- 11.2.10.3. SWOT Analysis
- 11.2.10.4. Recent Developments
- 11.2.10.5. Financials (Based on Availability)
- 11.2.11 Fujifilm Holdings Corporation
- 11.2.11.1. Overview
- 11.2.11.2. Products
- 11.2.11.3. SWOT Analysis
- 11.2.11.4. Recent Developments
- 11.2.11.5. Financials (Based on Availability)
- 11.2.1 GE Healthcare
List of Figures
- Figure 1: Global Computed Tomography Market in France Revenue Breakdown (Million, %) by Region 2024 & 2032
- Figure 2: France Computed Tomography Market in France Revenue (Million), by Country 2024 & 2032
- Figure 3: France Computed Tomography Market in France Revenue Share (%), by Country 2024 & 2032
- Figure 4: North America Computed Tomography Market in France Revenue (Million), by Type 2024 & 2032
- Figure 5: North America Computed Tomography Market in France Revenue Share (%), by Type 2024 & 2032
- Figure 6: North America Computed Tomography Market in France Revenue (Million), by Application 2024 & 2032
- Figure 7: North America Computed Tomography Market in France Revenue Share (%), by Application 2024 & 2032
- Figure 8: North America Computed Tomography Market in France Revenue (Million), by End User 2024 & 2032
- Figure 9: North America Computed Tomography Market in France Revenue Share (%), by End User 2024 & 2032
- Figure 10: North America Computed Tomography Market in France Revenue (Million), by Country 2024 & 2032
- Figure 11: North America Computed Tomography Market in France Revenue Share (%), by Country 2024 & 2032
- Figure 12: South America Computed Tomography Market in France Revenue (Million), by Type 2024 & 2032
- Figure 13: South America Computed Tomography Market in France Revenue Share (%), by Type 2024 & 2032
- Figure 14: South America Computed Tomography Market in France Revenue (Million), by Application 2024 & 2032
- Figure 15: South America Computed Tomography Market in France Revenue Share (%), by Application 2024 & 2032
- Figure 16: South America Computed Tomography Market in France Revenue (Million), by End User 2024 & 2032
- Figure 17: South America Computed Tomography Market in France Revenue Share (%), by End User 2024 & 2032
- Figure 18: South America Computed Tomography Market in France Revenue (Million), by Country 2024 & 2032
- Figure 19: South America Computed Tomography Market in France Revenue Share (%), by Country 2024 & 2032
- Figure 20: Europe Computed Tomography Market in France Revenue (Million), by Type 2024 & 2032
- Figure 21: Europe Computed Tomography Market in France Revenue Share (%), by Type 2024 & 2032
- Figure 22: Europe Computed Tomography Market in France Revenue (Million), by Application 2024 & 2032
- Figure 23: Europe Computed Tomography Market in France Revenue Share (%), by Application 2024 & 2032
- Figure 24: Europe Computed Tomography Market in France Revenue (Million), by End User 2024 & 2032
- Figure 25: Europe Computed Tomography Market in France Revenue Share (%), by End User 2024 & 2032
- Figure 26: Europe Computed Tomography Market in France Revenue (Million), by Country 2024 & 2032
- Figure 27: Europe Computed Tomography Market in France Revenue Share (%), by Country 2024 & 2032
- Figure 28: Middle East & Africa Computed Tomography Market in France Revenue (Million), by Type 2024 & 2032
- Figure 29: Middle East & Africa Computed Tomography Market in France Revenue Share (%), by Type 2024 & 2032
- Figure 30: Middle East & Africa Computed Tomography Market in France Revenue (Million), by Application 2024 & 2032
- Figure 31: Middle East & Africa Computed Tomography Market in France Revenue Share (%), by Application 2024 & 2032
- Figure 32: Middle East & Africa Computed Tomography Market in France Revenue (Million), by End User 2024 & 2032
- Figure 33: Middle East & Africa Computed Tomography Market in France Revenue Share (%), by End User 2024 & 2032
- Figure 34: Middle East & Africa Computed Tomography Market in France Revenue (Million), by Country 2024 & 2032
- Figure 35: Middle East & Africa Computed Tomography Market in France Revenue Share (%), by Country 2024 & 2032
- Figure 36: Asia Pacific Computed Tomography Market in France Revenue (Million), by Type 2024 & 2032
- Figure 37: Asia Pacific Computed Tomography Market in France Revenue Share (%), by Type 2024 & 2032
- Figure 38: Asia Pacific Computed Tomography Market in France Revenue (Million), by Application 2024 & 2032
- Figure 39: Asia Pacific Computed Tomography Market in France Revenue Share (%), by Application 2024 & 2032
- Figure 40: Asia Pacific Computed Tomography Market in France Revenue (Million), by End User 2024 & 2032
- Figure 41: Asia Pacific Computed Tomography Market in France Revenue Share (%), by End User 2024 & 2032
- Figure 42: Asia Pacific Computed Tomography Market in France Revenue (Million), by Country 2024 & 2032
- Figure 43: Asia Pacific Computed Tomography Market in France Revenue Share (%), by Country 2024 & 2032
List of Tables
- Table 1: Global Computed Tomography Market in France Revenue Million Forecast, by Region 2019 & 2032
- Table 2: Global Computed Tomography Market in France Revenue Million Forecast, by Type 2019 & 2032
- Table 3: Global Computed Tomography Market in France Revenue Million Forecast, by Application 2019 & 2032
- Table 4: Global Computed Tomography Market in France Revenue Million Forecast, by End User 2019 & 2032
- Table 5: Global Computed Tomography Market in France Revenue Million Forecast, by Region 2019 & 2032
- Table 6: Global Computed Tomography Market in France Revenue Million Forecast, by Country 2019 & 2032
- Table 7: Global Computed Tomography Market in France Revenue Million Forecast, by Type 2019 & 2032
- Table 8: Global Computed Tomography Market in France Revenue Million Forecast, by Application 2019 & 2032
- Table 9: Global Computed Tomography Market in France Revenue Million Forecast, by End User 2019 & 2032
- Table 10: Global Computed Tomography Market in France Revenue Million Forecast, by Country 2019 & 2032
- Table 11: United States Computed Tomography Market in France Revenue (Million) Forecast, by Application 2019 & 2032
- Table 12: Canada Computed Tomography Market in France Revenue (Million) Forecast, by Application 2019 & 2032
- Table 13: Mexico Computed Tomography Market in France Revenue (Million) Forecast, by Application 2019 & 2032
- Table 14: Global Computed Tomography Market in France Revenue Million Forecast, by Type 2019 & 2032
- Table 15: Global Computed Tomography Market in France Revenue Million Forecast, by Application 2019 & 2032
- Table 16: Global Computed Tomography Market in France Revenue Million Forecast, by End User 2019 & 2032
- Table 17: Global Computed Tomography Market in France Revenue Million Forecast, by Country 2019 & 2032
- Table 18: Brazil Computed Tomography Market in France Revenue (Million) Forecast, by Application 2019 & 2032
- Table 19: Argentina Computed Tomography Market in France Revenue (Million) Forecast, by Application 2019 & 2032
- Table 20: Rest of South America Computed Tomography Market in France Revenue (Million) Forecast, by Application 2019 & 2032
- Table 21: Global Computed Tomography Market in France Revenue Million Forecast, by Type 2019 & 2032
- Table 22: Global Computed Tomography Market in France Revenue Million Forecast, by Application 2019 & 2032
- Table 23: Global Computed Tomography Market in France Revenue Million Forecast, by End User 2019 & 2032
- Table 24: Global Computed Tomography Market in France Revenue Million Forecast, by Country 2019 & 2032
- Table 25: United Kingdom Computed Tomography Market in France Revenue (Million) Forecast, by Application 2019 & 2032
- Table 26: Germany Computed Tomography Market in France Revenue (Million) Forecast, by Application 2019 & 2032
- Table 27: France Computed Tomography Market in France Revenue (Million) Forecast, by Application 2019 & 2032
- Table 28: Italy Computed Tomography Market in France Revenue (Million) Forecast, by Application 2019 & 2032
- Table 29: Spain Computed Tomography Market in France Revenue (Million) Forecast, by Application 2019 & 2032
- Table 30: Russia Computed Tomography Market in France Revenue (Million) Forecast, by Application 2019 & 2032
- Table 31: Benelux Computed Tomography Market in France Revenue (Million) Forecast, by Application 2019 & 2032
- Table 32: Nordics Computed Tomography Market in France Revenue (Million) Forecast, by Application 2019 & 2032
- Table 33: Rest of Europe Computed Tomography Market in France Revenue (Million) Forecast, by Application 2019 & 2032
- Table 34: Global Computed Tomography Market in France Revenue Million Forecast, by Type 2019 & 2032
- Table 35: Global Computed Tomography Market in France Revenue Million Forecast, by Application 2019 & 2032
- Table 36: Global Computed Tomography Market in France Revenue Million Forecast, by End User 2019 & 2032
- Table 37: Global Computed Tomography Market in France Revenue Million Forecast, by Country 2019 & 2032
- Table 38: Turkey Computed Tomography Market in France Revenue (Million) Forecast, by Application 2019 & 2032
- Table 39: Israel Computed Tomography Market in France Revenue (Million) Forecast, by Application 2019 & 2032
- Table 40: GCC Computed Tomography Market in France Revenue (Million) Forecast, by Application 2019 & 2032
- Table 41: North Africa Computed Tomography Market in France Revenue (Million) Forecast, by Application 2019 & 2032
- Table 42: South Africa Computed Tomography Market in France Revenue (Million) Forecast, by Application 2019 & 2032
- Table 43: Rest of Middle East & Africa Computed Tomography Market in France Revenue (Million) Forecast, by Application 2019 & 2032
- Table 44: Global Computed Tomography Market in France Revenue Million Forecast, by Type 2019 & 2032
- Table 45: Global Computed Tomography Market in France Revenue Million Forecast, by Application 2019 & 2032
- Table 46: Global Computed Tomography Market in France Revenue Million Forecast, by End User 2019 & 2032
- Table 47: Global Computed Tomography Market in France Revenue Million Forecast, by Country 2019 & 2032
- Table 48: China Computed Tomography Market in France Revenue (Million) Forecast, by Application 2019 & 2032
- Table 49: India Computed Tomography Market in France Revenue (Million) Forecast, by Application 2019 & 2032
- Table 50: Japan Computed Tomography Market in France Revenue (Million) Forecast, by Application 2019 & 2032
- Table 51: South Korea Computed Tomography Market in France Revenue (Million) Forecast, by Application 2019 & 2032
- Table 52: ASEAN Computed Tomography Market in France Revenue (Million) Forecast, by Application 2019 & 2032
- Table 53: Oceania Computed Tomography Market in France Revenue (Million) Forecast, by Application 2019 & 2032
- Table 54: Rest of Asia Pacific Computed Tomography Market in France Revenue (Million) Forecast, by Application 2019 & 2032
Frequently Asked Questions
1. What is the projected Compound Annual Growth Rate (CAGR) of the Computed Tomography Market in France?
The projected CAGR is approximately 6.08%.
2. Which companies are prominent players in the Computed Tomography Market in France?
Key companies in the market include GE Healthcare, Koning corporation, Siemens Healthineers AG, Canon Medical Systems Corporation (Toshiba Corporation), Neusoft Medical Systems Co Ltd, Carestream Health, Koninklijke Philips NV, J Morita Corporation, Planmeca Group (Planmed OY), SAMSUNG ELECTRONICS CO LTD (SAMSUNG MEDISON), Fujifilm Holdings Corporation.
3. What are the main segments of the Computed Tomography Market in France?
The market segments include Type, Application, End User.
4. Can you provide details about the market size?
The market size is estimated to be USD 397.45 Million as of 2022.
5. What are some drivers contributing to market growth?
Increasing Prevalence of Chronic Diseases; Rising Geriatric Population; Increasing Technological Advancements.
6. What are the notable trends driving market growth?
Oncology Segment is Expected to Hold a Significant Market Share Over the Forecast Period.
7. Are there any restraints impacting market growth?
Lack Of Proper Reimbursement And Stringent Regulatory Approval Procedures; High Cost of Equipment.
8. Can you provide examples of recent developments in the market?
In November 2021, Siemens Healthineers launched the NAEOTOM Alpha, the world's first photon-counting CT scanner, and the device was made available across Europe.
9. What pricing options are available for accessing the report?
Pricing options include single-user, multi-user, and enterprise licenses priced at USD 3800, USD 4500, and USD 5800 respectively.
10. Is the market size provided in terms of value or volume?
The market size is provided in terms of value, measured in Million.
11. Are there any specific market keywords associated with the report?
Yes, the market keyword associated with the report is "Computed Tomography Market in France," which aids in identifying and referencing the specific market segment covered.
12. How do I determine which pricing option suits my needs best?
The pricing options vary based on user requirements and access needs. Individual users may opt for single-user licenses, while businesses requiring broader access may choose multi-user or enterprise licenses for cost-effective access to the report.
13. Are there any additional resources or data provided in the Computed Tomography Market in France report?
While the report offers comprehensive insights, it's advisable to review the specific contents or supplementary materials provided to ascertain if additional resources or data are available.
14. How can I stay updated on further developments or reports in the Computed Tomography Market in France?
To stay informed about further developments, trends, and reports in the Computed Tomography Market in France, consider subscribing to industry newsletters, following relevant companies and organizations, or regularly checking reputable industry news sources and publications.
Methodology
Step 1 - Identification of Relevant Samples Size from Population Database


Step 2 - Approaches for Defining Global Market Size (Value, Volume* & Price*)

Note*: In applicable scenarios
Step 3 - Data Sources
Primary Research
- Web Analytics
- Survey Reports
- Research Institute
- Latest Research Reports
- Opinion Leaders
Secondary Research
- Annual Reports
- White Paper
- Latest Press Release
- Industry Association
- Paid Database
- Investor Presentations

Step 4 - Data Triangulation
Involves using different sources of information in order to increase the validity of a study
These sources are likely to be stakeholders in a program - participants, other researchers, program staff, other community members, and so on.
Then we put all data in single framework & apply various statistical tools to find out the dynamic on the market.
During the analysis stage, feedback from the stakeholder groups would be compared to determine areas of agreement as well as areas of divergence


