
Key Insights
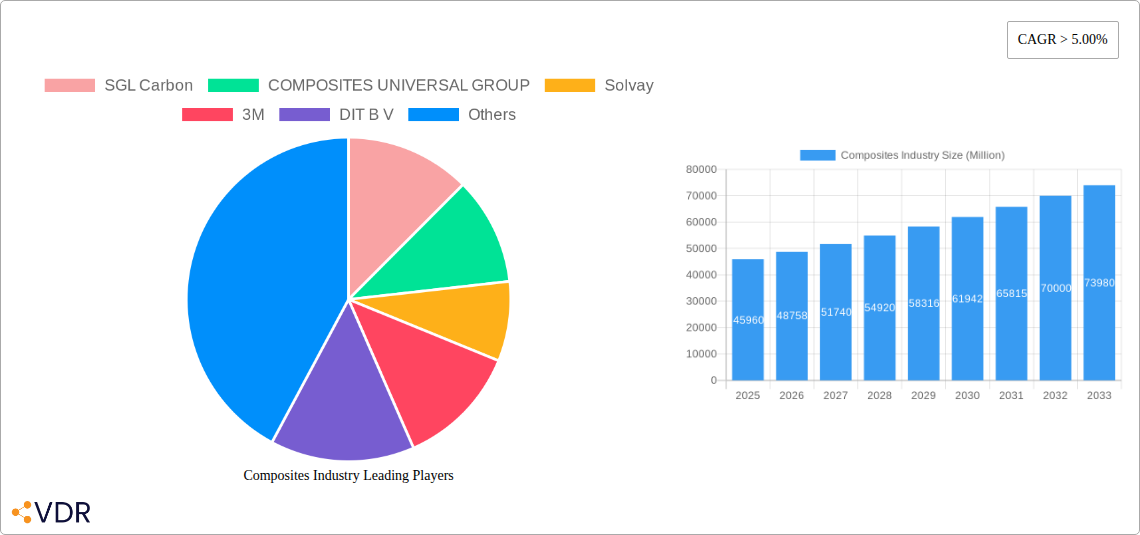
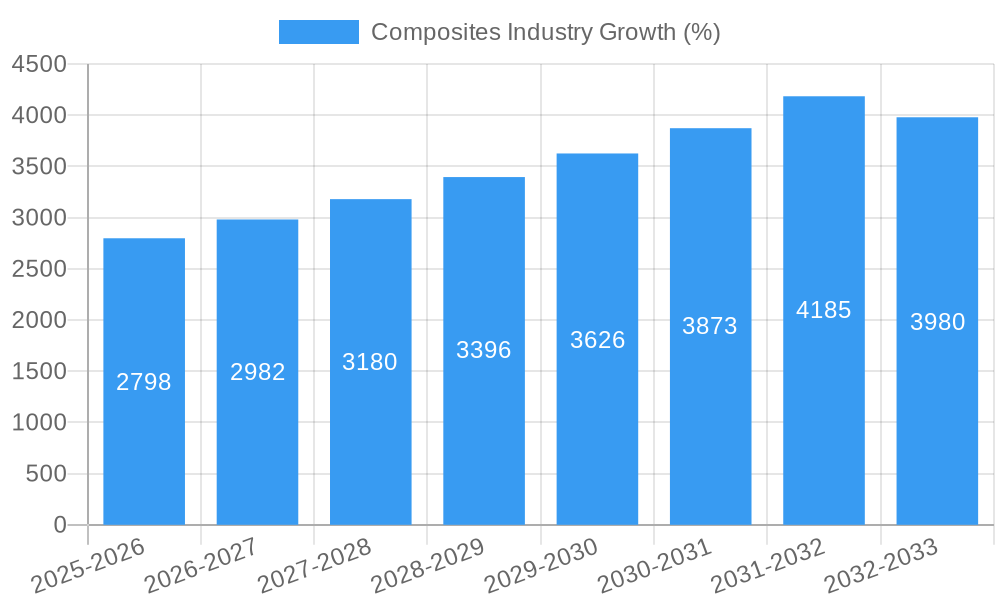
The global composites market, valued at $45.96 billion in 2025, is projected to experience robust growth, exhibiting a Compound Annual Growth Rate (CAGR) exceeding 5% from 2025 to 2033. This expansion is fueled by several key drivers. The increasing demand for lightweight yet high-strength materials in the automotive and transportation sectors is a significant factor, particularly as manufacturers strive to improve fuel efficiency and reduce emissions. Furthermore, the burgeoning renewable energy sector, especially wind energy, relies heavily on composite materials for turbine blades and other components, contributing significantly to market growth. Advancements in material science, leading to the development of stronger, more durable, and cost-effective composites, also play a crucial role. Growth is further spurred by the expanding aerospace and defense industries, which utilize composites for their superior performance characteristics in demanding applications. Finally, the construction industry's adoption of composites for infrastructure projects, like bridges and buildings, represents a growing market segment.
However, certain restraints hinder market expansion. The high initial cost of composite materials compared to traditional alternatives can limit adoption, particularly in price-sensitive markets. Moreover, the complex manufacturing processes involved in producing composite components can increase production costs and lead times. Concerns regarding the recyclability and environmental impact of some composite materials also pose challenges. Despite these constraints, the long-term growth outlook remains positive, driven by ongoing technological advancements, increasing demand in key end-use sectors, and the development of more sustainable composite materials. The market segmentation, encompassing various matrix materials (polymer, ceramic/carbon, metal), reinforcement fibers (glass, carbon, aramid), and diverse end-use applications, offers a wealth of opportunities for manufacturers and investors alike. Leading players like SGL Carbon, Solvay, 3M, and Toray Industries are strategically positioning themselves to capitalize on this expansive and dynamic market.
Composites Industry Market Report: 2019-2033
This comprehensive report provides an in-depth analysis of the global composites industry, encompassing market dynamics, growth trends, regional performance, key players, and future outlook. The study covers the period 2019-2033, with a focus on the forecast period 2025-2033 and a base year of 2025. The report segments the market by matrix material (Polymer Matrix Composites (PMC), Thermoplastic Resins, Ceramic/Carbon Matrix Composites (CMCs), Other Matrices (Metal Matrix Composites)), reinforcement fiber (Glass Fiber, Carbon Fiber, Aramid Fiber, Other Fibers), and end-use application (Automotive and Transportation, Wind Energy, Aerospace and Defense, Pipes and Tanks, Construction, Electrical and Electronics, Sports and Recreation, Other End-use Applications). Key players analyzed include SGL Carbon, COMPOSITES UNIVERSAL GROUP, Solvay, 3M, DIT B V, Owens Corning, DuPont, TORAY INDUSTRIES INC, Mitsubishi Chemical Group Corporation, Hexcel Corporation, TEIJIN LIMITED, and Materion Corporation. This report is crucial for industry professionals, investors, and researchers seeking a comprehensive understanding of this dynamic market.
Composites Industry Market Dynamics & Structure
The global composites market is characterized by moderate concentration, with several large players holding significant market share, but also a large number of smaller niche players. Technological innovation is a key driver, with ongoing advancements in materials science, manufacturing processes, and design techniques leading to lighter, stronger, and more cost-effective composite materials. Regulatory frameworks, particularly concerning environmental impact and safety, are increasingly influencing market dynamics. Competitive product substitutes, such as traditional metals and plastics, exert pressure, particularly in price-sensitive applications. The end-user demographics are diverse, spanning numerous industries, and the market is influenced by fluctuations in these sectors. M&A activity is significant, with strategic acquisitions driving consolidation and expansion into new market segments.
- Market Concentration: Moderately concentrated, with top 10 players holding approximately xx% of the market share in 2024.
- Technological Innovation: Continuous improvements in fiber strength, resin formulations, and manufacturing processes drive growth.
- Regulatory Landscape: Increasingly stringent environmental regulations and safety standards influence material selection and manufacturing practices.
- Competitive Substitutes: Traditional materials like steel and aluminum pose competition, particularly in cost-sensitive applications.
- End-User Demographics: Diverse, with significant demand from automotive, aerospace, wind energy, and construction sectors.
- M&A Trends: A significant number of mergers and acquisitions (xx deals in 2024), driven by expansion into new markets and technologies.
Composites Industry Growth Trends & Insights
The global composites market is experiencing robust growth, driven by increasing demand across various end-use sectors. The market size is projected to reach xx Million USD by 2033, exhibiting a CAGR of xx% during the forecast period (2025-2033). This growth is fueled by the adoption of lightweight materials in the automotive and aerospace industries, the expansion of the wind energy sector, and the rising demand for durable and high-performance materials in infrastructure applications. Technological advancements, particularly in the development of high-strength carbon fiber and advanced resin systems, are further accelerating market expansion. Shifting consumer preferences toward sustainable and eco-friendly materials are also influencing industry trends. The market penetration rate is expected to rise from xx% in 2025 to xx% in 2033.
Dominant Regions, Countries, or Segments in Composites Industry
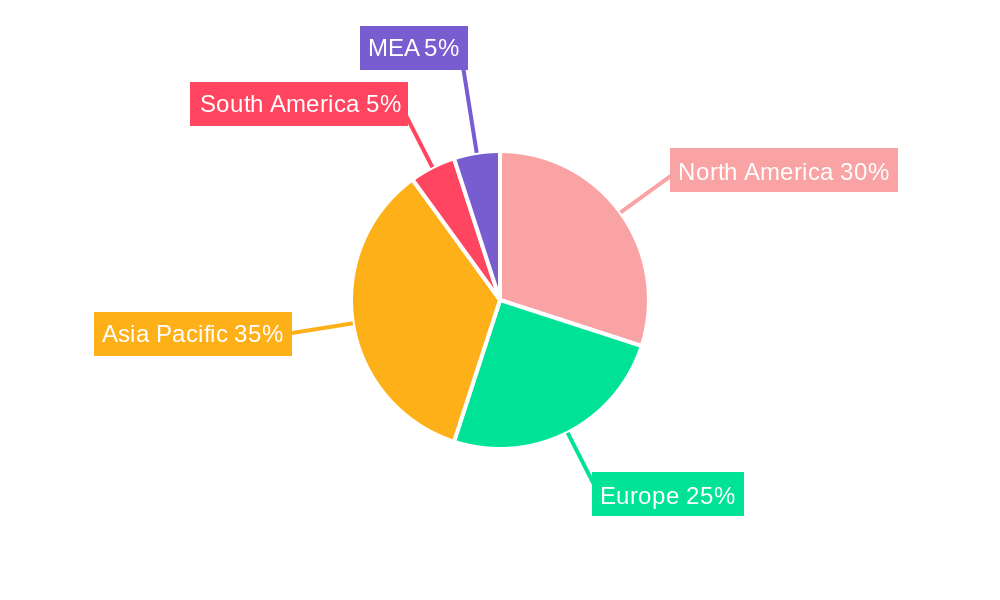
North America and Europe currently dominate the global composites market, driven by robust demand from the aerospace and automotive industries, as well as well-established manufacturing infrastructure. However, Asia-Pacific is expected to exhibit the highest growth rate over the forecast period due to rapid industrialization and increasing investments in renewable energy infrastructure. Within material segments, Polymer Matrix Composites (PMC) hold the largest market share, owing to their versatility and cost-effectiveness. The carbon fiber reinforcement segment displays significant growth potential due to its superior strength and lightweight properties. In terms of end-use applications, the automotive and transportation sector shows highest demand.
- Key Growth Drivers: Strong industrial growth in Asia-Pacific; increasing demand for lightweight materials in automotive and aerospace sectors; expanding wind energy sector.
- Dominant Regions: North America and Europe (currently); Asia-Pacific (highest growth potential).
- Leading Segments: Polymer Matrix Composites (PMC) by matrix material, Carbon Fiber by reinforcement fiber, and Automotive and Transportation by end-use application.
Composites Industry Product Landscape
The composites industry showcases a wide array of products with diverse applications. Recent innovations focus on enhancing material properties like strength-to-weight ratio, durability, and resistance to environmental factors. Manufacturers continuously introduce advanced materials with tailored properties to meet specific application needs, and many emphasize sustainable and recyclable solutions. Unique selling propositions often center on superior performance characteristics, cost-effectiveness, and reduced environmental impact compared to traditional materials.
Key Drivers, Barriers & Challenges in Composites Industry
Key Drivers:
- Technological advancements leading to improved material properties and manufacturing processes.
- Increasing demand from the automotive, aerospace, and wind energy sectors.
- Government initiatives promoting the use of lightweight and sustainable materials.
Key Challenges:
- High raw material costs, especially for high-performance fibers.
- Complexity and cost of manufacturing processes.
- Concerns regarding the recyclability and environmental impact of certain composite materials. The global supply chain disruptions caused a xx% increase in raw material costs in 2022.
Emerging Opportunities in Composites Industry
- Growing demand for sustainable and recyclable composite materials.
- Expansion into new and emerging applications, such as in medical devices, 3D printing, and construction.
- Development of advanced composite structures for electric vehicles and other energy-efficient transportation systems.
Growth Accelerators in the Composites Industry
The long-term growth of the composites industry is fueled by the continuous development of novel materials, strategic collaborations among industry players, and the expanding adoption of composites across diverse sectors. Breakthroughs in nanotechnology, smart materials, and additive manufacturing are expected to drive further innovation, while partnerships will facilitate the development and deployment of advanced composite solutions. The strategic expansion into new markets and diversification of applications further ensures sustainable long-term growth.
Key Players Shaping the Composites Industry Market
- SGL Carbon
- COMPOSITES UNIVERSAL GROUP
- Solvay
- 3M
- DIT B V
- Owens Corning
- DuPont
- TORAY INDUSTRIES INC
- Mitsubishi Chemical Group Corporation
- Hexcel Corporation
- TEIJIN LIMITED
- Materion Corporation
Notable Milestones in Composites Industry Sector
- June 2023: Solvay collaborates with Spirit AeroSystems on composite development for sustainable aircraft technologies.
- February 2024: Owens Corning acquires Masonite for USD 3.9 billion, strengthening its position in building and construction materials and glass reinforcement.
In-Depth Composites Industry Market Outlook
The composites industry is poised for sustained growth, driven by technological advancements, strategic partnerships, and the expanding adoption of lightweight and high-performance materials across diverse sectors. The increasing demand from renewable energy, automotive, and aerospace sectors, coupled with ongoing innovation in materials science and manufacturing techniques, presents significant opportunities for market expansion and diversification. Strategic investments in research and development, along with strategic partnerships, will further enhance market growth and competitiveness.
Composites Industry Segmentation
-
1. Matrix Material
-
1.1. Polymer Matrix Composites (PMC)
- 1.1.1. Thermoset Resins
- 1.1.2. Thermoplastic Resins
- 1.2. Ceramic/Carbon Matrix Composites (CMCs)
- 1.3. Other Matrices (Metal Matrix Composites)
-
1.1. Polymer Matrix Composites (PMC)
-
2. Reinforcement Fiber
- 2.1. Glass Fiber
- 2.2. Carbon Fiber
- 2.3. Aramid Fiber
- 2.4. Other Fibers
-
3. End-use Application
- 3.1. Automotive and Transportation
- 3.2. Wind Energy
- 3.3. Aerospace and Defense
- 3.4. Pipes and Tanks
- 3.5. Construction
- 3.6. Electrical and Electronics
- 3.7. Sports and Recreation
- 3.8. Other End-use Applications
Composites Industry Segmentation By Geography
-
1. Asia Pacific
- 1.1. China
- 1.2. India
- 1.3. Japan
- 1.4. South Korea
- 1.5. Thailand
- 1.6. Malaysia
- 1.7. Indonesia
- 1.8. Vietnam
- 1.9. Rest of Asia Pacific
-
2. North America
- 2.1. United States
- 2.2. Canada
- 2.3. Mexico
-
3. Europe
- 3.1. Germany
- 3.2. United Kingdom
- 3.3. France
- 3.4. Italy
- 3.5. Spain
- 3.6. Russia
- 3.7. NORDIC Countries
- 3.8. Turkey
- 3.9. Rest of Europe
-
4. South America
- 4.1. Brazil
- 4.2. Argentina
- 4.3. Colombia
- 4.4. Rest of South America
-
5. Middle East and Africa
- 5.1. Saudi Arabia
- 5.2. South Africa
- 5.3. Nigeria
- 5.4. Qatar
- 5.5. Egypt
- 5.6. United Arab Emirates
- 5.7. Rest of Middle East and Africa
Composites Industry REPORT HIGHLIGHTS
| Aspects | Details |
|---|---|
| Study Period | 2019-2033 |
| Base Year | 2024 |
| Estimated Year | 2025 |
| Forecast Period | 2025-2033 |
| Historical Period | 2019-2024 |
| Growth Rate | CAGR of > 5.00% from 2019-2033 |
| Segmentation |
|
Table of Contents
- 1. Introduction
- 1.1. Research Scope
- 1.2. Market Segmentation
- 1.3. Research Methodology
- 1.4. Definitions and Assumptions
- 2. Executive Summary
- 2.1. Introduction
- 3. Market Dynamics
- 3.1. Introduction
- 3.2. Market Drivers
- 3.2.1. Technological Advancement in the Field of Material Science; Increasing Use of Composites in the Aerospace and Defense Industry; Other Drivers
- 3.3. Market Restrains
- 3.3.1. High Cost of Composite Materials
- 3.4. Market Trends
- 3.4.1. Rising Demand from Transportation sector
- 4. Market Factor Analysis
- 4.1. Porters Five Forces
- 4.2. Supply/Value Chain
- 4.3. PESTEL analysis
- 4.4. Market Entropy
- 4.5. Patent/Trademark Analysis
- 5. Global Composites Industry Analysis, Insights and Forecast, 2019-2031
- 5.1. Market Analysis, Insights and Forecast - by Matrix Material
- 5.1.1. Polymer Matrix Composites (PMC)
- 5.1.1.1. Thermoset Resins
- 5.1.1.2. Thermoplastic Resins
- 5.1.2. Ceramic/Carbon Matrix Composites (CMCs)
- 5.1.3. Other Matrices (Metal Matrix Composites)
- 5.1.1. Polymer Matrix Composites (PMC)
- 5.2. Market Analysis, Insights and Forecast - by Reinforcement Fiber
- 5.2.1. Glass Fiber
- 5.2.2. Carbon Fiber
- 5.2.3. Aramid Fiber
- 5.2.4. Other Fibers
- 5.3. Market Analysis, Insights and Forecast - by End-use Application
- 5.3.1. Automotive and Transportation
- 5.3.2. Wind Energy
- 5.3.3. Aerospace and Defense
- 5.3.4. Pipes and Tanks
- 5.3.5. Construction
- 5.3.6. Electrical and Electronics
- 5.3.7. Sports and Recreation
- 5.3.8. Other End-use Applications
- 5.4. Market Analysis, Insights and Forecast - by Region
- 5.4.1. Asia Pacific
- 5.4.2. North America
- 5.4.3. Europe
- 5.4.4. South America
- 5.4.5. Middle East and Africa
- 5.1. Market Analysis, Insights and Forecast - by Matrix Material
- 6. Asia Pacific Composites Industry Analysis, Insights and Forecast, 2019-2031
- 6.1. Market Analysis, Insights and Forecast - by Matrix Material
- 6.1.1. Polymer Matrix Composites (PMC)
- 6.1.1.1. Thermoset Resins
- 6.1.1.2. Thermoplastic Resins
- 6.1.2. Ceramic/Carbon Matrix Composites (CMCs)
- 6.1.3. Other Matrices (Metal Matrix Composites)
- 6.1.1. Polymer Matrix Composites (PMC)
- 6.2. Market Analysis, Insights and Forecast - by Reinforcement Fiber
- 6.2.1. Glass Fiber
- 6.2.2. Carbon Fiber
- 6.2.3. Aramid Fiber
- 6.2.4. Other Fibers
- 6.3. Market Analysis, Insights and Forecast - by End-use Application
- 6.3.1. Automotive and Transportation
- 6.3.2. Wind Energy
- 6.3.3. Aerospace and Defense
- 6.3.4. Pipes and Tanks
- 6.3.5. Construction
- 6.3.6. Electrical and Electronics
- 6.3.7. Sports and Recreation
- 6.3.8. Other End-use Applications
- 6.1. Market Analysis, Insights and Forecast - by Matrix Material
- 7. North America Composites Industry Analysis, Insights and Forecast, 2019-2031
- 7.1. Market Analysis, Insights and Forecast - by Matrix Material
- 7.1.1. Polymer Matrix Composites (PMC)
- 7.1.1.1. Thermoset Resins
- 7.1.1.2. Thermoplastic Resins
- 7.1.2. Ceramic/Carbon Matrix Composites (CMCs)
- 7.1.3. Other Matrices (Metal Matrix Composites)
- 7.1.1. Polymer Matrix Composites (PMC)
- 7.2. Market Analysis, Insights and Forecast - by Reinforcement Fiber
- 7.2.1. Glass Fiber
- 7.2.2. Carbon Fiber
- 7.2.3. Aramid Fiber
- 7.2.4. Other Fibers
- 7.3. Market Analysis, Insights and Forecast - by End-use Application
- 7.3.1. Automotive and Transportation
- 7.3.2. Wind Energy
- 7.3.3. Aerospace and Defense
- 7.3.4. Pipes and Tanks
- 7.3.5. Construction
- 7.3.6. Electrical and Electronics
- 7.3.7. Sports and Recreation
- 7.3.8. Other End-use Applications
- 7.1. Market Analysis, Insights and Forecast - by Matrix Material
- 8. Europe Composites Industry Analysis, Insights and Forecast, 2019-2031
- 8.1. Market Analysis, Insights and Forecast - by Matrix Material
- 8.1.1. Polymer Matrix Composites (PMC)
- 8.1.1.1. Thermoset Resins
- 8.1.1.2. Thermoplastic Resins
- 8.1.2. Ceramic/Carbon Matrix Composites (CMCs)
- 8.1.3. Other Matrices (Metal Matrix Composites)
- 8.1.1. Polymer Matrix Composites (PMC)
- 8.2. Market Analysis, Insights and Forecast - by Reinforcement Fiber
- 8.2.1. Glass Fiber
- 8.2.2. Carbon Fiber
- 8.2.3. Aramid Fiber
- 8.2.4. Other Fibers
- 8.3. Market Analysis, Insights and Forecast - by End-use Application
- 8.3.1. Automotive and Transportation
- 8.3.2. Wind Energy
- 8.3.3. Aerospace and Defense
- 8.3.4. Pipes and Tanks
- 8.3.5. Construction
- 8.3.6. Electrical and Electronics
- 8.3.7. Sports and Recreation
- 8.3.8. Other End-use Applications
- 8.1. Market Analysis, Insights and Forecast - by Matrix Material
- 9. South America Composites Industry Analysis, Insights and Forecast, 2019-2031
- 9.1. Market Analysis, Insights and Forecast - by Matrix Material
- 9.1.1. Polymer Matrix Composites (PMC)
- 9.1.1.1. Thermoset Resins
- 9.1.1.2. Thermoplastic Resins
- 9.1.2. Ceramic/Carbon Matrix Composites (CMCs)
- 9.1.3. Other Matrices (Metal Matrix Composites)
- 9.1.1. Polymer Matrix Composites (PMC)
- 9.2. Market Analysis, Insights and Forecast - by Reinforcement Fiber
- 9.2.1. Glass Fiber
- 9.2.2. Carbon Fiber
- 9.2.3. Aramid Fiber
- 9.2.4. Other Fibers
- 9.3. Market Analysis, Insights and Forecast - by End-use Application
- 9.3.1. Automotive and Transportation
- 9.3.2. Wind Energy
- 9.3.3. Aerospace and Defense
- 9.3.4. Pipes and Tanks
- 9.3.5. Construction
- 9.3.6. Electrical and Electronics
- 9.3.7. Sports and Recreation
- 9.3.8. Other End-use Applications
- 9.1. Market Analysis, Insights and Forecast - by Matrix Material
- 10. Middle East and Africa Composites Industry Analysis, Insights and Forecast, 2019-2031
- 10.1. Market Analysis, Insights and Forecast - by Matrix Material
- 10.1.1. Polymer Matrix Composites (PMC)
- 10.1.1.1. Thermoset Resins
- 10.1.1.2. Thermoplastic Resins
- 10.1.2. Ceramic/Carbon Matrix Composites (CMCs)
- 10.1.3. Other Matrices (Metal Matrix Composites)
- 10.1.1. Polymer Matrix Composites (PMC)
- 10.2. Market Analysis, Insights and Forecast - by Reinforcement Fiber
- 10.2.1. Glass Fiber
- 10.2.2. Carbon Fiber
- 10.2.3. Aramid Fiber
- 10.2.4. Other Fibers
- 10.3. Market Analysis, Insights and Forecast - by End-use Application
- 10.3.1. Automotive and Transportation
- 10.3.2. Wind Energy
- 10.3.3. Aerospace and Defense
- 10.3.4. Pipes and Tanks
- 10.3.5. Construction
- 10.3.6. Electrical and Electronics
- 10.3.7. Sports and Recreation
- 10.3.8. Other End-use Applications
- 10.1. Market Analysis, Insights and Forecast - by Matrix Material
- 11. North America Composites Industry Analysis, Insights and Forecast, 2019-2031
- 11.1. Market Analysis, Insights and Forecast - By Country/Sub-region
- 11.1.1 United States
- 11.1.2 Canada
- 11.1.3 Mexico
- 12. Europe Composites Industry Analysis, Insights and Forecast, 2019-2031
- 12.1. Market Analysis, Insights and Forecast - By Country/Sub-region
- 12.1.1 Germany
- 12.1.2 United Kingdom
- 12.1.3 France
- 12.1.4 Spain
- 12.1.5 Italy
- 12.1.6 Spain
- 12.1.7 Belgium
- 12.1.8 Netherland
- 12.1.9 Nordics
- 12.1.10 Rest of Europe
- 13. Asia Pacific Composites Industry Analysis, Insights and Forecast, 2019-2031
- 13.1. Market Analysis, Insights and Forecast - By Country/Sub-region
- 13.1.1 China
- 13.1.2 Japan
- 13.1.3 India
- 13.1.4 South Korea
- 13.1.5 Southeast Asia
- 13.1.6 Australia
- 13.1.7 Indonesia
- 13.1.8 Phillipes
- 13.1.9 Singapore
- 13.1.10 Thailandc
- 13.1.11 Rest of Asia Pacific
- 14. South America Composites Industry Analysis, Insights and Forecast, 2019-2031
- 14.1. Market Analysis, Insights and Forecast - By Country/Sub-region
- 14.1.1 Brazil
- 14.1.2 Argentina
- 14.1.3 Peru
- 14.1.4 Chile
- 14.1.5 Colombia
- 14.1.6 Ecuador
- 14.1.7 Venezuela
- 14.1.8 Rest of South America
- 15. North America Composites Industry Analysis, Insights and Forecast, 2019-2031
- 15.1. Market Analysis, Insights and Forecast - By Country/Sub-region
- 15.1.1 United States
- 15.1.2 Canada
- 15.1.3 Mexico
- 16. MEA Composites Industry Analysis, Insights and Forecast, 2019-2031
- 16.1. Market Analysis, Insights and Forecast - By Country/Sub-region
- 16.1.1 United Arab Emirates
- 16.1.2 Saudi Arabia
- 16.1.3 South Africa
- 16.1.4 Rest of Middle East and Africa
- 17. Competitive Analysis
- 17.1. Global Market Share Analysis 2024
- 17.2. Company Profiles
- 17.2.1 SGL Carbon
- 17.2.1.1. Overview
- 17.2.1.2. Products
- 17.2.1.3. SWOT Analysis
- 17.2.1.4. Recent Developments
- 17.2.1.5. Financials (Based on Availability)
- 17.2.2 COMPOSITES UNIVERSAL GROUP
- 17.2.2.1. Overview
- 17.2.2.2. Products
- 17.2.2.3. SWOT Analysis
- 17.2.2.4. Recent Developments
- 17.2.2.5. Financials (Based on Availability)
- 17.2.3 Solvay
- 17.2.3.1. Overview
- 17.2.3.2. Products
- 17.2.3.3. SWOT Analysis
- 17.2.3.4. Recent Developments
- 17.2.3.5. Financials (Based on Availability)
- 17.2.4 3M
- 17.2.4.1. Overview
- 17.2.4.2. Products
- 17.2.4.3. SWOT Analysis
- 17.2.4.4. Recent Developments
- 17.2.4.5. Financials (Based on Availability)
- 17.2.5 DIT B V
- 17.2.5.1. Overview
- 17.2.5.2. Products
- 17.2.5.3. SWOT Analysis
- 17.2.5.4. Recent Developments
- 17.2.5.5. Financials (Based on Availability)
- 17.2.6 Owens Corning
- 17.2.6.1. Overview
- 17.2.6.2. Products
- 17.2.6.3. SWOT Analysis
- 17.2.6.4. Recent Developments
- 17.2.6.5. Financials (Based on Availability)
- 17.2.7 DuPont
- 17.2.7.1. Overview
- 17.2.7.2. Products
- 17.2.7.3. SWOT Analysis
- 17.2.7.4. Recent Developments
- 17.2.7.5. Financials (Based on Availability)
- 17.2.8 TORAY INDUSTRIES INC *List Not Exhaustive
- 17.2.8.1. Overview
- 17.2.8.2. Products
- 17.2.8.3. SWOT Analysis
- 17.2.8.4. Recent Developments
- 17.2.8.5. Financials (Based on Availability)
- 17.2.9 Mitsubishi Chemical Group Corporation
- 17.2.9.1. Overview
- 17.2.9.2. Products
- 17.2.9.3. SWOT Analysis
- 17.2.9.4. Recent Developments
- 17.2.9.5. Financials (Based on Availability)
- 17.2.10 Hexcel Corporation
- 17.2.10.1. Overview
- 17.2.10.2. Products
- 17.2.10.3. SWOT Analysis
- 17.2.10.4. Recent Developments
- 17.2.10.5. Financials (Based on Availability)
- 17.2.11 TEIJIN LIMITED
- 17.2.11.1. Overview
- 17.2.11.2. Products
- 17.2.11.3. SWOT Analysis
- 17.2.11.4. Recent Developments
- 17.2.11.5. Financials (Based on Availability)
- 17.2.12 Materion Corporation
- 17.2.12.1. Overview
- 17.2.12.2. Products
- 17.2.12.3. SWOT Analysis
- 17.2.12.4. Recent Developments
- 17.2.12.5. Financials (Based on Availability)
- 17.2.1 SGL Carbon
List of Figures
- Figure 1: Global Composites Industry Revenue Breakdown (Million, %) by Region 2024 & 2032
- Figure 2: North America Composites Industry Revenue (Million), by Country 2024 & 2032
- Figure 3: North America Composites Industry Revenue Share (%), by Country 2024 & 2032
- Figure 4: Europe Composites Industry Revenue (Million), by Country 2024 & 2032
- Figure 5: Europe Composites Industry Revenue Share (%), by Country 2024 & 2032
- Figure 6: Asia Pacific Composites Industry Revenue (Million), by Country 2024 & 2032
- Figure 7: Asia Pacific Composites Industry Revenue Share (%), by Country 2024 & 2032
- Figure 8: South America Composites Industry Revenue (Million), by Country 2024 & 2032
- Figure 9: South America Composites Industry Revenue Share (%), by Country 2024 & 2032
- Figure 10: North America Composites Industry Revenue (Million), by Country 2024 & 2032
- Figure 11: North America Composites Industry Revenue Share (%), by Country 2024 & 2032
- Figure 12: MEA Composites Industry Revenue (Million), by Country 2024 & 2032
- Figure 13: MEA Composites Industry Revenue Share (%), by Country 2024 & 2032
- Figure 14: Asia Pacific Composites Industry Revenue (Million), by Matrix Material 2024 & 2032
- Figure 15: Asia Pacific Composites Industry Revenue Share (%), by Matrix Material 2024 & 2032
- Figure 16: Asia Pacific Composites Industry Revenue (Million), by Reinforcement Fiber 2024 & 2032
- Figure 17: Asia Pacific Composites Industry Revenue Share (%), by Reinforcement Fiber 2024 & 2032
- Figure 18: Asia Pacific Composites Industry Revenue (Million), by End-use Application 2024 & 2032
- Figure 19: Asia Pacific Composites Industry Revenue Share (%), by End-use Application 2024 & 2032
- Figure 20: Asia Pacific Composites Industry Revenue (Million), by Country 2024 & 2032
- Figure 21: Asia Pacific Composites Industry Revenue Share (%), by Country 2024 & 2032
- Figure 22: North America Composites Industry Revenue (Million), by Matrix Material 2024 & 2032
- Figure 23: North America Composites Industry Revenue Share (%), by Matrix Material 2024 & 2032
- Figure 24: North America Composites Industry Revenue (Million), by Reinforcement Fiber 2024 & 2032
- Figure 25: North America Composites Industry Revenue Share (%), by Reinforcement Fiber 2024 & 2032
- Figure 26: North America Composites Industry Revenue (Million), by End-use Application 2024 & 2032
- Figure 27: North America Composites Industry Revenue Share (%), by End-use Application 2024 & 2032
- Figure 28: North America Composites Industry Revenue (Million), by Country 2024 & 2032
- Figure 29: North America Composites Industry Revenue Share (%), by Country 2024 & 2032
- Figure 30: Europe Composites Industry Revenue (Million), by Matrix Material 2024 & 2032
- Figure 31: Europe Composites Industry Revenue Share (%), by Matrix Material 2024 & 2032
- Figure 32: Europe Composites Industry Revenue (Million), by Reinforcement Fiber 2024 & 2032
- Figure 33: Europe Composites Industry Revenue Share (%), by Reinforcement Fiber 2024 & 2032
- Figure 34: Europe Composites Industry Revenue (Million), by End-use Application 2024 & 2032
- Figure 35: Europe Composites Industry Revenue Share (%), by End-use Application 2024 & 2032
- Figure 36: Europe Composites Industry Revenue (Million), by Country 2024 & 2032
- Figure 37: Europe Composites Industry Revenue Share (%), by Country 2024 & 2032
- Figure 38: South America Composites Industry Revenue (Million), by Matrix Material 2024 & 2032
- Figure 39: South America Composites Industry Revenue Share (%), by Matrix Material 2024 & 2032
- Figure 40: South America Composites Industry Revenue (Million), by Reinforcement Fiber 2024 & 2032
- Figure 41: South America Composites Industry Revenue Share (%), by Reinforcement Fiber 2024 & 2032
- Figure 42: South America Composites Industry Revenue (Million), by End-use Application 2024 & 2032
- Figure 43: South America Composites Industry Revenue Share (%), by End-use Application 2024 & 2032
- Figure 44: South America Composites Industry Revenue (Million), by Country 2024 & 2032
- Figure 45: South America Composites Industry Revenue Share (%), by Country 2024 & 2032
- Figure 46: Middle East and Africa Composites Industry Revenue (Million), by Matrix Material 2024 & 2032
- Figure 47: Middle East and Africa Composites Industry Revenue Share (%), by Matrix Material 2024 & 2032
- Figure 48: Middle East and Africa Composites Industry Revenue (Million), by Reinforcement Fiber 2024 & 2032
- Figure 49: Middle East and Africa Composites Industry Revenue Share (%), by Reinforcement Fiber 2024 & 2032
- Figure 50: Middle East and Africa Composites Industry Revenue (Million), by End-use Application 2024 & 2032
- Figure 51: Middle East and Africa Composites Industry Revenue Share (%), by End-use Application 2024 & 2032
- Figure 52: Middle East and Africa Composites Industry Revenue (Million), by Country 2024 & 2032
- Figure 53: Middle East and Africa Composites Industry Revenue Share (%), by Country 2024 & 2032
List of Tables
- Table 1: Global Composites Industry Revenue Million Forecast, by Region 2019 & 2032
- Table 2: Global Composites Industry Revenue Million Forecast, by Matrix Material 2019 & 2032
- Table 3: Global Composites Industry Revenue Million Forecast, by Reinforcement Fiber 2019 & 2032
- Table 4: Global Composites Industry Revenue Million Forecast, by End-use Application 2019 & 2032
- Table 5: Global Composites Industry Revenue Million Forecast, by Region 2019 & 2032
- Table 6: Global Composites Industry Revenue Million Forecast, by Country 2019 & 2032
- Table 7: United States Composites Industry Revenue (Million) Forecast, by Application 2019 & 2032
- Table 8: Canada Composites Industry Revenue (Million) Forecast, by Application 2019 & 2032
- Table 9: Mexico Composites Industry Revenue (Million) Forecast, by Application 2019 & 2032
- Table 10: Global Composites Industry Revenue Million Forecast, by Country 2019 & 2032
- Table 11: Germany Composites Industry Revenue (Million) Forecast, by Application 2019 & 2032
- Table 12: United Kingdom Composites Industry Revenue (Million) Forecast, by Application 2019 & 2032
- Table 13: France Composites Industry Revenue (Million) Forecast, by Application 2019 & 2032
- Table 14: Spain Composites Industry Revenue (Million) Forecast, by Application 2019 & 2032
- Table 15: Italy Composites Industry Revenue (Million) Forecast, by Application 2019 & 2032
- Table 16: Spain Composites Industry Revenue (Million) Forecast, by Application 2019 & 2032
- Table 17: Belgium Composites Industry Revenue (Million) Forecast, by Application 2019 & 2032
- Table 18: Netherland Composites Industry Revenue (Million) Forecast, by Application 2019 & 2032
- Table 19: Nordics Composites Industry Revenue (Million) Forecast, by Application 2019 & 2032
- Table 20: Rest of Europe Composites Industry Revenue (Million) Forecast, by Application 2019 & 2032
- Table 21: Global Composites Industry Revenue Million Forecast, by Country 2019 & 2032
- Table 22: China Composites Industry Revenue (Million) Forecast, by Application 2019 & 2032
- Table 23: Japan Composites Industry Revenue (Million) Forecast, by Application 2019 & 2032
- Table 24: India Composites Industry Revenue (Million) Forecast, by Application 2019 & 2032
- Table 25: South Korea Composites Industry Revenue (Million) Forecast, by Application 2019 & 2032
- Table 26: Southeast Asia Composites Industry Revenue (Million) Forecast, by Application 2019 & 2032
- Table 27: Australia Composites Industry Revenue (Million) Forecast, by Application 2019 & 2032
- Table 28: Indonesia Composites Industry Revenue (Million) Forecast, by Application 2019 & 2032
- Table 29: Phillipes Composites Industry Revenue (Million) Forecast, by Application 2019 & 2032
- Table 30: Singapore Composites Industry Revenue (Million) Forecast, by Application 2019 & 2032
- Table 31: Thailandc Composites Industry Revenue (Million) Forecast, by Application 2019 & 2032
- Table 32: Rest of Asia Pacific Composites Industry Revenue (Million) Forecast, by Application 2019 & 2032
- Table 33: Global Composites Industry Revenue Million Forecast, by Country 2019 & 2032
- Table 34: Brazil Composites Industry Revenue (Million) Forecast, by Application 2019 & 2032
- Table 35: Argentina Composites Industry Revenue (Million) Forecast, by Application 2019 & 2032
- Table 36: Peru Composites Industry Revenue (Million) Forecast, by Application 2019 & 2032
- Table 37: Chile Composites Industry Revenue (Million) Forecast, by Application 2019 & 2032
- Table 38: Colombia Composites Industry Revenue (Million) Forecast, by Application 2019 & 2032
- Table 39: Ecuador Composites Industry Revenue (Million) Forecast, by Application 2019 & 2032
- Table 40: Venezuela Composites Industry Revenue (Million) Forecast, by Application 2019 & 2032
- Table 41: Rest of South America Composites Industry Revenue (Million) Forecast, by Application 2019 & 2032
- Table 42: Global Composites Industry Revenue Million Forecast, by Country 2019 & 2032
- Table 43: United States Composites Industry Revenue (Million) Forecast, by Application 2019 & 2032
- Table 44: Canada Composites Industry Revenue (Million) Forecast, by Application 2019 & 2032
- Table 45: Mexico Composites Industry Revenue (Million) Forecast, by Application 2019 & 2032
- Table 46: Global Composites Industry Revenue Million Forecast, by Country 2019 & 2032
- Table 47: United Arab Emirates Composites Industry Revenue (Million) Forecast, by Application 2019 & 2032
- Table 48: Saudi Arabia Composites Industry Revenue (Million) Forecast, by Application 2019 & 2032
- Table 49: South Africa Composites Industry Revenue (Million) Forecast, by Application 2019 & 2032
- Table 50: Rest of Middle East and Africa Composites Industry Revenue (Million) Forecast, by Application 2019 & 2032
- Table 51: Global Composites Industry Revenue Million Forecast, by Matrix Material 2019 & 2032
- Table 52: Global Composites Industry Revenue Million Forecast, by Reinforcement Fiber 2019 & 2032
- Table 53: Global Composites Industry Revenue Million Forecast, by End-use Application 2019 & 2032
- Table 54: Global Composites Industry Revenue Million Forecast, by Country 2019 & 2032
- Table 55: China Composites Industry Revenue (Million) Forecast, by Application 2019 & 2032
- Table 56: India Composites Industry Revenue (Million) Forecast, by Application 2019 & 2032
- Table 57: Japan Composites Industry Revenue (Million) Forecast, by Application 2019 & 2032
- Table 58: South Korea Composites Industry Revenue (Million) Forecast, by Application 2019 & 2032
- Table 59: Thailand Composites Industry Revenue (Million) Forecast, by Application 2019 & 2032
- Table 60: Malaysia Composites Industry Revenue (Million) Forecast, by Application 2019 & 2032
- Table 61: Indonesia Composites Industry Revenue (Million) Forecast, by Application 2019 & 2032
- Table 62: Vietnam Composites Industry Revenue (Million) Forecast, by Application 2019 & 2032
- Table 63: Rest of Asia Pacific Composites Industry Revenue (Million) Forecast, by Application 2019 & 2032
- Table 64: Global Composites Industry Revenue Million Forecast, by Matrix Material 2019 & 2032
- Table 65: Global Composites Industry Revenue Million Forecast, by Reinforcement Fiber 2019 & 2032
- Table 66: Global Composites Industry Revenue Million Forecast, by End-use Application 2019 & 2032
- Table 67: Global Composites Industry Revenue Million Forecast, by Country 2019 & 2032
- Table 68: United States Composites Industry Revenue (Million) Forecast, by Application 2019 & 2032
- Table 69: Canada Composites Industry Revenue (Million) Forecast, by Application 2019 & 2032
- Table 70: Mexico Composites Industry Revenue (Million) Forecast, by Application 2019 & 2032
- Table 71: Global Composites Industry Revenue Million Forecast, by Matrix Material 2019 & 2032
- Table 72: Global Composites Industry Revenue Million Forecast, by Reinforcement Fiber 2019 & 2032
- Table 73: Global Composites Industry Revenue Million Forecast, by End-use Application 2019 & 2032
- Table 74: Global Composites Industry Revenue Million Forecast, by Country 2019 & 2032
- Table 75: Germany Composites Industry Revenue (Million) Forecast, by Application 2019 & 2032
- Table 76: United Kingdom Composites Industry Revenue (Million) Forecast, by Application 2019 & 2032
- Table 77: France Composites Industry Revenue (Million) Forecast, by Application 2019 & 2032
- Table 78: Italy Composites Industry Revenue (Million) Forecast, by Application 2019 & 2032
- Table 79: Spain Composites Industry Revenue (Million) Forecast, by Application 2019 & 2032
- Table 80: Russia Composites Industry Revenue (Million) Forecast, by Application 2019 & 2032
- Table 81: NORDIC Countries Composites Industry Revenue (Million) Forecast, by Application 2019 & 2032
- Table 82: Turkey Composites Industry Revenue (Million) Forecast, by Application 2019 & 2032
- Table 83: Rest of Europe Composites Industry Revenue (Million) Forecast, by Application 2019 & 2032
- Table 84: Global Composites Industry Revenue Million Forecast, by Matrix Material 2019 & 2032
- Table 85: Global Composites Industry Revenue Million Forecast, by Reinforcement Fiber 2019 & 2032
- Table 86: Global Composites Industry Revenue Million Forecast, by End-use Application 2019 & 2032
- Table 87: Global Composites Industry Revenue Million Forecast, by Country 2019 & 2032
- Table 88: Brazil Composites Industry Revenue (Million) Forecast, by Application 2019 & 2032
- Table 89: Argentina Composites Industry Revenue (Million) Forecast, by Application 2019 & 2032
- Table 90: Colombia Composites Industry Revenue (Million) Forecast, by Application 2019 & 2032
- Table 91: Rest of South America Composites Industry Revenue (Million) Forecast, by Application 2019 & 2032
- Table 92: Global Composites Industry Revenue Million Forecast, by Matrix Material 2019 & 2032
- Table 93: Global Composites Industry Revenue Million Forecast, by Reinforcement Fiber 2019 & 2032
- Table 94: Global Composites Industry Revenue Million Forecast, by End-use Application 2019 & 2032
- Table 95: Global Composites Industry Revenue Million Forecast, by Country 2019 & 2032
- Table 96: Saudi Arabia Composites Industry Revenue (Million) Forecast, by Application 2019 & 2032
- Table 97: South Africa Composites Industry Revenue (Million) Forecast, by Application 2019 & 2032
- Table 98: Nigeria Composites Industry Revenue (Million) Forecast, by Application 2019 & 2032
- Table 99: Qatar Composites Industry Revenue (Million) Forecast, by Application 2019 & 2032
- Table 100: Egypt Composites Industry Revenue (Million) Forecast, by Application 2019 & 2032
- Table 101: United Arab Emirates Composites Industry Revenue (Million) Forecast, by Application 2019 & 2032
- Table 102: Rest of Middle East and Africa Composites Industry Revenue (Million) Forecast, by Application 2019 & 2032
Frequently Asked Questions
1. What is the projected Compound Annual Growth Rate (CAGR) of the Composites Industry?
The projected CAGR is approximately > 5.00%.
2. Which companies are prominent players in the Composites Industry?
Key companies in the market include SGL Carbon, COMPOSITES UNIVERSAL GROUP, Solvay, 3M, DIT B V, Owens Corning, DuPont, TORAY INDUSTRIES INC *List Not Exhaustive, Mitsubishi Chemical Group Corporation, Hexcel Corporation, TEIJIN LIMITED, Materion Corporation.
3. What are the main segments of the Composites Industry?
The market segments include Matrix Material, Reinforcement Fiber, End-use Application.
4. Can you provide details about the market size?
The market size is estimated to be USD 45.96 Million as of 2022.
5. What are some drivers contributing to market growth?
Technological Advancement in the Field of Material Science; Increasing Use of Composites in the Aerospace and Defense Industry; Other Drivers.
6. What are the notable trends driving market growth?
Rising Demand from Transportation sector.
7. Are there any restraints impacting market growth?
High Cost of Composite Materials.
8. Can you provide examples of recent developments in the market?
February 2024 - Owens Corning acquired USD 3.9 billion of Masonite. This acquisition would strengthen the company's position in building and construction materials and the glass reinforcement business within its Composites segment.
9. What pricing options are available for accessing the report?
Pricing options include single-user, multi-user, and enterprise licenses priced at USD 4750, USD 5250, and USD 8750 respectively.
10. Is the market size provided in terms of value or volume?
The market size is provided in terms of value, measured in Million.
11. Are there any specific market keywords associated with the report?
Yes, the market keyword associated with the report is "Composites Industry," which aids in identifying and referencing the specific market segment covered.
12. How do I determine which pricing option suits my needs best?
The pricing options vary based on user requirements and access needs. Individual users may opt for single-user licenses, while businesses requiring broader access may choose multi-user or enterprise licenses for cost-effective access to the report.
13. Are there any additional resources or data provided in the Composites Industry report?
While the report offers comprehensive insights, it's advisable to review the specific contents or supplementary materials provided to ascertain if additional resources or data are available.
14. How can I stay updated on further developments or reports in the Composites Industry?
To stay informed about further developments, trends, and reports in the Composites Industry, consider subscribing to industry newsletters, following relevant companies and organizations, or regularly checking reputable industry news sources and publications.
Methodology
Step 1 - Identification of Relevant Samples Size from Population Database


Step 2 - Approaches for Defining Global Market Size (Value, Volume* & Price*)

Note*: In applicable scenarios
Step 3 - Data Sources
Primary Research
- Web Analytics
- Survey Reports
- Research Institute
- Latest Research Reports
- Opinion Leaders
Secondary Research
- Annual Reports
- White Paper
- Latest Press Release
- Industry Association
- Paid Database
- Investor Presentations

Step 4 - Data Triangulation
Involves using different sources of information in order to increase the validity of a study
These sources are likely to be stakeholders in a program - participants, other researchers, program staff, other community members, and so on.
Then we put all data in single framework & apply various statistical tools to find out the dynamic on the market.
During the analysis stage, feedback from the stakeholder groups would be compared to determine areas of agreement as well as areas of divergence


