
Key Insights
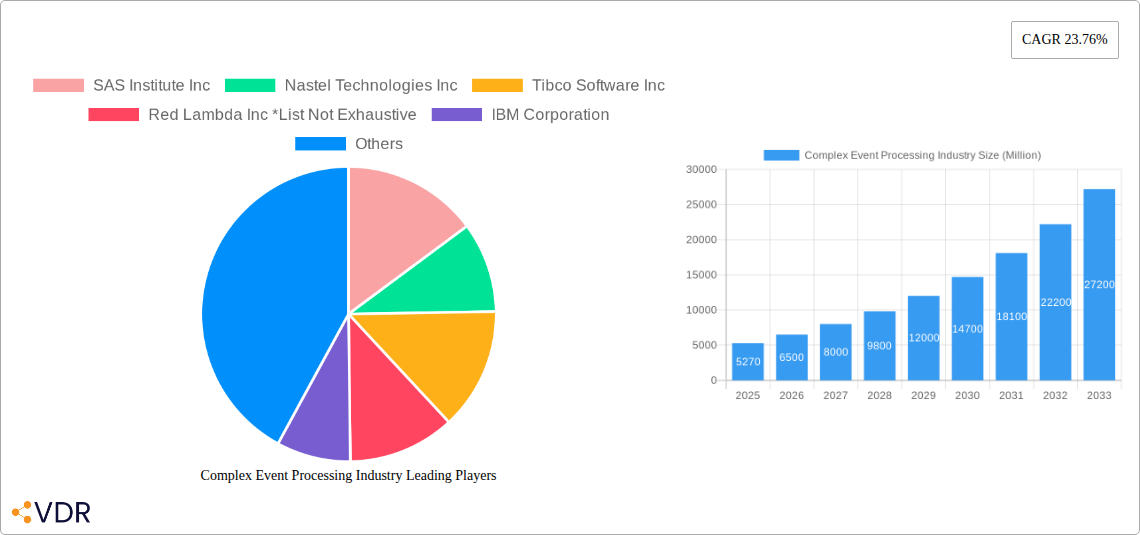
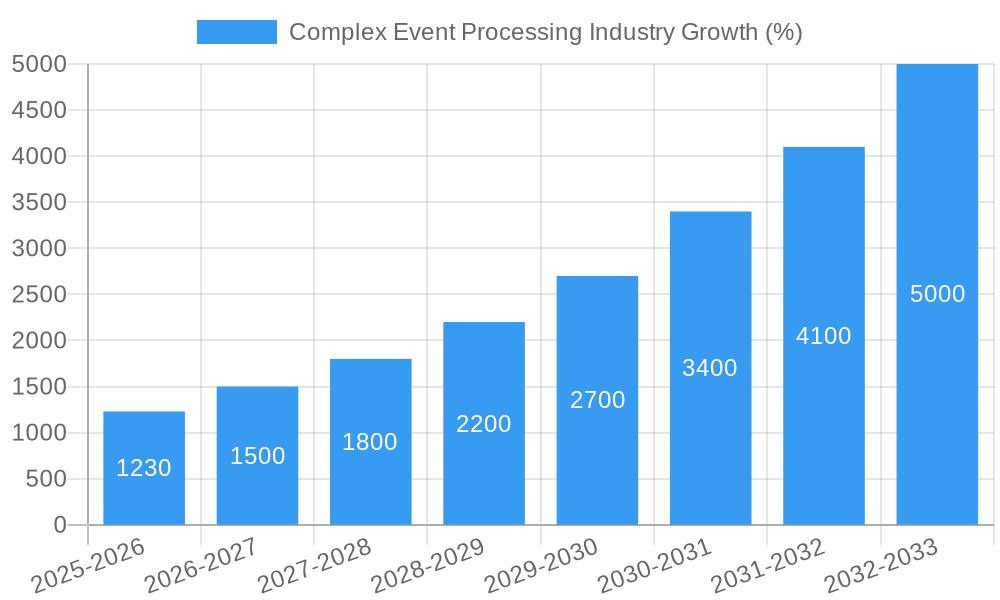
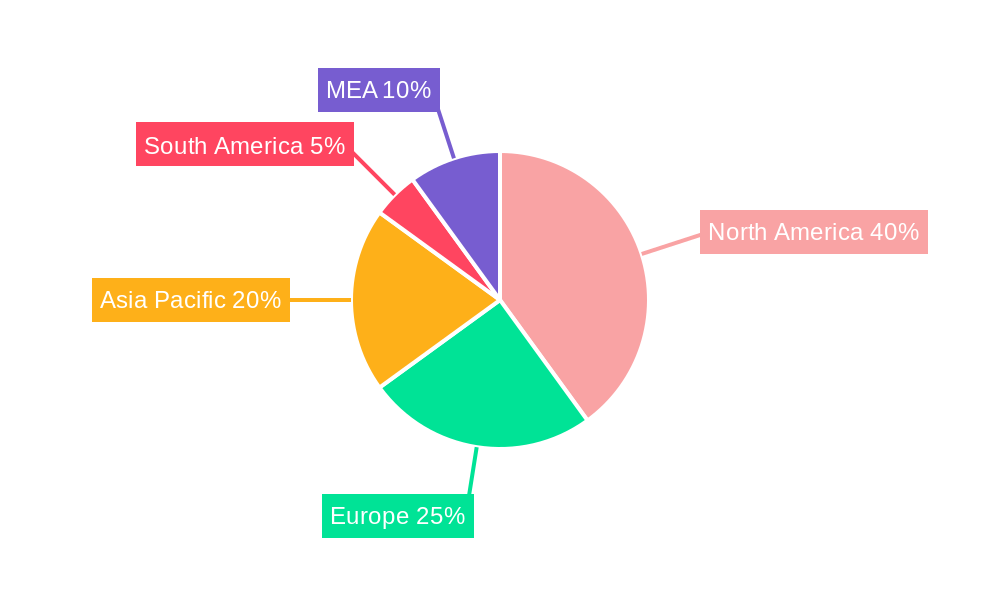
The Complex Event Processing (CEP) market is experiencing robust growth, projected to reach \$5.27 billion in 2025 and expand significantly over the forecast period (2025-2033). A compound annual growth rate (CAGR) of 23.76% indicates a rapidly evolving landscape driven by several key factors. The increasing volume and velocity of data generated by various industries, coupled with the need for real-time insights and decision-making, are primary growth drivers. The rise of IoT, cloud computing, and big data analytics further fuels this demand, enabling organizations to process massive streams of data and extract actionable intelligence swiftly. The adoption of CEP solutions across diverse sectors like BFSI (Banking, Financial Services, and Insurance), healthcare, and manufacturing is accelerating, particularly among large enterprises seeking to optimize operations and gain a competitive edge. While data security concerns and the complexity of implementing CEP systems represent potential restraints, the ongoing technological advancements and the growing awareness of CEP's potential are mitigating these challenges. The market segmentation reveals a strong preference for software-based CEP solutions, reflecting the shift towards agile and scalable deployment models. Geographic expansion is also a notable trend, with North America maintaining a significant market share but other regions, especially Asia-Pacific, exhibiting rapid growth.
The competitive landscape is characterized by a mix of established players and emerging vendors. Major technology companies like IBM, SAP, and Oracle, alongside specialized CEP providers like Tibco and SAS, are vying for market share. The continuous innovation in CEP technologies, including advancements in machine learning and artificial intelligence integration, is likely to further shape the competitive dynamics. The forecast period will witness intensified competition, driven by the introduction of newer, more sophisticated solutions catering to the evolving needs of diverse industries. The focus will likely remain on enhancing real-time analytics capabilities, improving integration with existing systems, and delivering more user-friendly interfaces to broaden the adoption of CEP across various organizational levels. This dynamic market presents significant opportunities for both established and emerging players to capitalize on the increasing demand for real-time data processing and actionable insights.
Complex Event Processing (CEP) Industry Market Report: 2019-2033
This comprehensive report provides a detailed analysis of the Complex Event Processing (CEP) industry, encompassing market dynamics, growth trends, regional segmentation, product landscape, key players, and future outlook. The study period covers 2019-2033, with 2025 as the base and estimated year. This report is crucial for businesses, investors, and industry professionals seeking to understand and capitalize on the growth opportunities within this rapidly evolving market. The parent market is the broader data analytics and business intelligence market, while the child market is specifically CEP solutions for various end-user verticals. The total market size in 2025 is estimated at xx Million.
Complex Event Processing Industry Market Dynamics & Structure
The Complex Event Processing (CEP) market is characterized by a moderately consolidated structure, with key players like SAS Institute Inc, Oracle Corporation, IBM Corporation, Tibco Software Inc, and Software AG holding significant market share. However, the entry of smaller, specialized firms and technological advancements foster a dynamic competitive landscape. The market is driven by the increasing need for real-time insights and data-driven decision-making across various industries.
- Market Concentration: The top 5 players hold approximately xx% of the market share in 2025.
- Technological Innovation: Advances in AI, machine learning, and cloud computing are driving innovation in CEP technologies, enhancing capabilities and expanding applications.
- Regulatory Frameworks: Data privacy regulations (e.g., GDPR, CCPA) are influencing CEP technology development and adoption, emphasizing data security and compliance.
- Competitive Product Substitutes: Traditional Business Intelligence (BI) tools and other data analytics solutions pose some level of competition. However, CEP’s real-time capabilities create a distinct advantage.
- End-User Demographics: Large enterprises currently dominate CEP adoption; however, increasing adoption among SMEs is anticipated.
- M&A Trends: The number of M&A deals in the CEP sector averaged xx per year during 2019-2024, indicating significant consolidation.
Complex Event Processing Industry Growth Trends & Insights
The global Complex Event Processing market is experiencing robust growth, driven by the increasing volume of real-time data generated across various sectors. The market is projected to reach xx Million by 2033, exhibiting a CAGR of xx% during the forecast period (2025-2033). This growth is fueled by the rising adoption of IoT devices, the need for improved operational efficiency, and the expanding applications of real-time analytics across different industries. Consumer behavior shifts towards personalized experiences and instant gratification are also contributing factors. Technological disruptions, such as the emergence of edge computing and serverless architectures, are further enhancing the capabilities and scalability of CEP solutions. Market penetration is currently at xx% and expected to reach xx% by 2033.
Dominant Regions, Countries, or Segments in Complex Event Processing Industry
North America currently holds the largest market share in the CEP industry, driven by early adoption of advanced technologies and a large number of technology companies. Within this region, the United States dominates due to its robust technological infrastructure and high concentration of CEP solution providers. However, the Asia-Pacific region is expected to witness significant growth in the coming years, fueled by rapid digitalization and economic expansion. Within market segments, the Large Enterprise segment currently dominates, representing xx% of the market in 2025. However, the SME segment is showing rapid growth. In terms of end-user verticals, BFSI and Telecom & IT industries are leading adopters, reflecting the high volume of real-time data they handle.
- Key Drivers (North America): Strong technological infrastructure, high investment in R&D, presence of major CEP vendors.
- Key Drivers (Asia-Pacific): Rapid digitalization, growing adoption of IoT, expanding IT infrastructure.
- Large Enterprise Segment: High budgets, established IT infrastructure, and greater need for real-time insights.
- BFSI Vertical: High demand for fraud detection, risk management, and customer service improvement.
- Telecom & IT: Need for network optimization, real-time monitoring, and customer experience management.
Complex Event Processing Industry Product Landscape
The CEP product landscape encompasses both software and services, with a focus on real-time data processing, event correlation, pattern recognition, and complex event detection. Solutions range from cloud-based platforms to on-premise deployments, catering to diverse needs and scalability requirements. Key innovations include the integration of AI/ML algorithms for advanced analytics, enhanced visualization tools for improved decision-making, and streamlined deployment processes for quicker implementation. Unique selling propositions include superior real-time analytics capabilities, scalability, and integration with other enterprise systems.
Key Drivers, Barriers & Challenges in Complex Event Processing Industry
Key Drivers: The increasing volume of real-time data, the demand for improved operational efficiency, and the need for faster decision-making are key drivers propelling CEP market growth. The integration of AI and machine learning is also playing a pivotal role.
Challenges: The high cost of implementation, the complexity of integrating CEP solutions into existing IT infrastructure, and the scarcity of skilled professionals represent significant challenges. Moreover, data security and privacy concerns, coupled with stringent regulatory frameworks, can hinder market growth. Supply chain disruptions may also impact the availability and timely delivery of CEP solutions. The impact of these is estimated to be a xx% reduction in the overall growth rate.
Emerging Opportunities in Complex Event Processing Industry
Emerging opportunities lie in the untapped potential of specific end-user verticals, such as healthcare and manufacturing, where real-time data analysis can improve processes significantly. The integration of CEP with IoT and edge computing creates new possibilities for real-time data processing and analytics at the edge of the network, reducing latency and improving efficiency. The development of advanced analytics techniques, such as predictive modeling and machine learning, unlocks opportunities for more sophisticated insights and proactive decision-making.
Growth Accelerators in the Complex Event Processing Industry
Technological advancements, particularly in AI/ML and cloud computing, are expected to drive long-term growth. Strategic partnerships between CEP vendors and technology providers will expand market reach and facilitate faster adoption. The expansion of CEP applications to new industries and the development of user-friendly solutions will improve accessibility and spur market growth.
Key Players Shaping the Complex Event Processing Industry Market
- SAS Institute Inc
- Nastel Technologies Inc
- Tibco Software Inc
- Red Lambda Inc
- IBM Corporation
- Software AG
- Cisco Systems Inc
- Espertech Inc
- Oracle Corporation
- Informatica Corporation
- SAP SE
Notable Milestones in Complex Event Processing Industry Sector
- June 2023: Cisco announced its reimagining of AI interaction for improved workforce productivity and simplicity, leveraging language models across its portfolio. This signifies increased investment and innovation in integrating AI with CEP solutions.
- January 2023: Oracle introduced new logistics capabilities within Oracle Fusion Cloud Supply Chain Management, enhancing automation and improving supply chain efficiency. This strengthens Oracle's position in the CEP market by providing solutions for supply chain optimization.
In-Depth Complex Event Processing Industry Market Outlook
The future of the CEP industry looks bright, driven by several factors. The continued growth of data volume, the increasing adoption of cloud technologies, and the advancement of AI and ML capabilities will create a significant demand for sophisticated real-time analytics solutions. The successful integration of CEP technologies into various industries, coupled with a growing understanding of its benefits, promises sustained market expansion. Strategic partnerships and investments in R&D will be critical for driving innovation and growth in the CEP sector. The overall market will continue to grow and expand its applications into various industries and sectors, creating several opportunities for players in the market.
Complex Event Processing Industry Segmentation
-
1. Type
- 1.1. Software
- 1.2. Services
-
2. Enterprise Type
- 2.1. Small and Medium Enterprise
- 2.2. Large Enterprise
-
3. End-user Vertical
- 3.1. BFSI
- 3.2. Managed Mobility
- 3.3. Government and Defense
- 3.4. Retail
- 3.5. Healthcare
- 3.6. Telecom and IT Industry
- 3.7. Media and Entertainment
- 3.8. Manufacturing
- 3.9. Other End-user Verticals
Complex Event Processing Industry Segmentation By Geography
- 1. North America
- 2. Europe
- 3. Asia
- 4. Australia and New Zealand
- 5. Latin America
- 6. Middle East and Africa
Complex Event Processing Industry REPORT HIGHLIGHTS
| Aspects | Details |
|---|---|
| Study Period | 2019-2033 |
| Base Year | 2024 |
| Estimated Year | 2025 |
| Forecast Period | 2025-2033 |
| Historical Period | 2019-2024 |
| Growth Rate | CAGR of 23.76% from 2019-2033 |
| Segmentation |
|
Table of Contents
- 1. Introduction
- 1.1. Research Scope
- 1.2. Market Segmentation
- 1.3. Research Methodology
- 1.4. Definitions and Assumptions
- 2. Executive Summary
- 2.1. Introduction
- 3. Market Dynamics
- 3.1. Introduction
- 3.2. Market Drivers
- 3.2.1. Development in the Field of Machine Learning and Data Analytics; Growing Need for Real-time Analytics
- 3.3. Market Restrains
- 3.3.1. Lack of Consistency in Results
- 3.4. Market Trends
- 3.4.1. BFSI End-user Segment to Grow Significantly
- 4. Market Factor Analysis
- 4.1. Porters Five Forces
- 4.2. Supply/Value Chain
- 4.3. PESTEL analysis
- 4.4. Market Entropy
- 4.5. Patent/Trademark Analysis
- 5. Global Complex Event Processing Industry Analysis, Insights and Forecast, 2019-2031
- 5.1. Market Analysis, Insights and Forecast - by Type
- 5.1.1. Software
- 5.1.2. Services
- 5.2. Market Analysis, Insights and Forecast - by Enterprise Type
- 5.2.1. Small and Medium Enterprise
- 5.2.2. Large Enterprise
- 5.3. Market Analysis, Insights and Forecast - by End-user Vertical
- 5.3.1. BFSI
- 5.3.2. Managed Mobility
- 5.3.3. Government and Defense
- 5.3.4. Retail
- 5.3.5. Healthcare
- 5.3.6. Telecom and IT Industry
- 5.3.7. Media and Entertainment
- 5.3.8. Manufacturing
- 5.3.9. Other End-user Verticals
- 5.4. Market Analysis, Insights and Forecast - by Region
- 5.4.1. North America
- 5.4.2. Europe
- 5.4.3. Asia
- 5.4.4. Australia and New Zealand
- 5.4.5. Latin America
- 5.4.6. Middle East and Africa
- 5.1. Market Analysis, Insights and Forecast - by Type
- 6. North America Complex Event Processing Industry Analysis, Insights and Forecast, 2019-2031
- 6.1. Market Analysis, Insights and Forecast - by Type
- 6.1.1. Software
- 6.1.2. Services
- 6.2. Market Analysis, Insights and Forecast - by Enterprise Type
- 6.2.1. Small and Medium Enterprise
- 6.2.2. Large Enterprise
- 6.3. Market Analysis, Insights and Forecast - by End-user Vertical
- 6.3.1. BFSI
- 6.3.2. Managed Mobility
- 6.3.3. Government and Defense
- 6.3.4. Retail
- 6.3.5. Healthcare
- 6.3.6. Telecom and IT Industry
- 6.3.7. Media and Entertainment
- 6.3.8. Manufacturing
- 6.3.9. Other End-user Verticals
- 6.1. Market Analysis, Insights and Forecast - by Type
- 7. Europe Complex Event Processing Industry Analysis, Insights and Forecast, 2019-2031
- 7.1. Market Analysis, Insights and Forecast - by Type
- 7.1.1. Software
- 7.1.2. Services
- 7.2. Market Analysis, Insights and Forecast - by Enterprise Type
- 7.2.1. Small and Medium Enterprise
- 7.2.2. Large Enterprise
- 7.3. Market Analysis, Insights and Forecast - by End-user Vertical
- 7.3.1. BFSI
- 7.3.2. Managed Mobility
- 7.3.3. Government and Defense
- 7.3.4. Retail
- 7.3.5. Healthcare
- 7.3.6. Telecom and IT Industry
- 7.3.7. Media and Entertainment
- 7.3.8. Manufacturing
- 7.3.9. Other End-user Verticals
- 7.1. Market Analysis, Insights and Forecast - by Type
- 8. Asia Complex Event Processing Industry Analysis, Insights and Forecast, 2019-2031
- 8.1. Market Analysis, Insights and Forecast - by Type
- 8.1.1. Software
- 8.1.2. Services
- 8.2. Market Analysis, Insights and Forecast - by Enterprise Type
- 8.2.1. Small and Medium Enterprise
- 8.2.2. Large Enterprise
- 8.3. Market Analysis, Insights and Forecast - by End-user Vertical
- 8.3.1. BFSI
- 8.3.2. Managed Mobility
- 8.3.3. Government and Defense
- 8.3.4. Retail
- 8.3.5. Healthcare
- 8.3.6. Telecom and IT Industry
- 8.3.7. Media and Entertainment
- 8.3.8. Manufacturing
- 8.3.9. Other End-user Verticals
- 8.1. Market Analysis, Insights and Forecast - by Type
- 9. Australia and New Zealand Complex Event Processing Industry Analysis, Insights and Forecast, 2019-2031
- 9.1. Market Analysis, Insights and Forecast - by Type
- 9.1.1. Software
- 9.1.2. Services
- 9.2. Market Analysis, Insights and Forecast - by Enterprise Type
- 9.2.1. Small and Medium Enterprise
- 9.2.2. Large Enterprise
- 9.3. Market Analysis, Insights and Forecast - by End-user Vertical
- 9.3.1. BFSI
- 9.3.2. Managed Mobility
- 9.3.3. Government and Defense
- 9.3.4. Retail
- 9.3.5. Healthcare
- 9.3.6. Telecom and IT Industry
- 9.3.7. Media and Entertainment
- 9.3.8. Manufacturing
- 9.3.9. Other End-user Verticals
- 9.1. Market Analysis, Insights and Forecast - by Type
- 10. Latin America Complex Event Processing Industry Analysis, Insights and Forecast, 2019-2031
- 10.1. Market Analysis, Insights and Forecast - by Type
- 10.1.1. Software
- 10.1.2. Services
- 10.2. Market Analysis, Insights and Forecast - by Enterprise Type
- 10.2.1. Small and Medium Enterprise
- 10.2.2. Large Enterprise
- 10.3. Market Analysis, Insights and Forecast - by End-user Vertical
- 10.3.1. BFSI
- 10.3.2. Managed Mobility
- 10.3.3. Government and Defense
- 10.3.4. Retail
- 10.3.5. Healthcare
- 10.3.6. Telecom and IT Industry
- 10.3.7. Media and Entertainment
- 10.3.8. Manufacturing
- 10.3.9. Other End-user Verticals
- 10.1. Market Analysis, Insights and Forecast - by Type
- 11. Middle East and Africa Complex Event Processing Industry Analysis, Insights and Forecast, 2019-2031
- 11.1. Market Analysis, Insights and Forecast - by Type
- 11.1.1. Software
- 11.1.2. Services
- 11.2. Market Analysis, Insights and Forecast - by Enterprise Type
- 11.2.1. Small and Medium Enterprise
- 11.2.2. Large Enterprise
- 11.3. Market Analysis, Insights and Forecast - by End-user Vertical
- 11.3.1. BFSI
- 11.3.2. Managed Mobility
- 11.3.3. Government and Defense
- 11.3.4. Retail
- 11.3.5. Healthcare
- 11.3.6. Telecom and IT Industry
- 11.3.7. Media and Entertainment
- 11.3.8. Manufacturing
- 11.3.9. Other End-user Verticals
- 11.1. Market Analysis, Insights and Forecast - by Type
- 12. North America Complex Event Processing Industry Analysis, Insights and Forecast, 2019-2031
- 12.1. Market Analysis, Insights and Forecast - By Country/Sub-region
- 12.1.1 United States
- 12.1.2 Canada
- 12.1.3 Mexico
- 13. Europe Complex Event Processing Industry Analysis, Insights and Forecast, 2019-2031
- 13.1. Market Analysis, Insights and Forecast - By Country/Sub-region
- 13.1.1 Germany
- 13.1.2 United Kingdom
- 13.1.3 France
- 13.1.4 Spain
- 13.1.5 Italy
- 13.1.6 Spain
- 13.1.7 Belgium
- 13.1.8 Netherland
- 13.1.9 Nordics
- 13.1.10 Rest of Europe
- 14. Asia Pacific Complex Event Processing Industry Analysis, Insights and Forecast, 2019-2031
- 14.1. Market Analysis, Insights and Forecast - By Country/Sub-region
- 14.1.1 China
- 14.1.2 Japan
- 14.1.3 India
- 14.1.4 South Korea
- 14.1.5 Southeast Asia
- 14.1.6 Australia
- 14.1.7 Indonesia
- 14.1.8 Phillipes
- 14.1.9 Singapore
- 14.1.10 Thailandc
- 14.1.11 Rest of Asia Pacific
- 15. South America Complex Event Processing Industry Analysis, Insights and Forecast, 2019-2031
- 15.1. Market Analysis, Insights and Forecast - By Country/Sub-region
- 15.1.1 Brazil
- 15.1.2 Argentina
- 15.1.3 Peru
- 15.1.4 Chile
- 15.1.5 Colombia
- 15.1.6 Ecuador
- 15.1.7 Venezuela
- 15.1.8 Rest of South America
- 16. North America Complex Event Processing Industry Analysis, Insights and Forecast, 2019-2031
- 16.1. Market Analysis, Insights and Forecast - By Country/Sub-region
- 16.1.1 United States
- 16.1.2 Canada
- 16.1.3 Mexico
- 17. MEA Complex Event Processing Industry Analysis, Insights and Forecast, 2019-2031
- 17.1. Market Analysis, Insights and Forecast - By Country/Sub-region
- 17.1.1 United Arab Emirates
- 17.1.2 Saudi Arabia
- 17.1.3 South Africa
- 17.1.4 Rest of Middle East and Africa
- 18. Competitive Analysis
- 18.1. Global Market Share Analysis 2024
- 18.2. Company Profiles
- 18.2.1 SAS Institute Inc
- 18.2.1.1. Overview
- 18.2.1.2. Products
- 18.2.1.3. SWOT Analysis
- 18.2.1.4. Recent Developments
- 18.2.1.5. Financials (Based on Availability)
- 18.2.2 Nastel Technologies Inc
- 18.2.2.1. Overview
- 18.2.2.2. Products
- 18.2.2.3. SWOT Analysis
- 18.2.2.4. Recent Developments
- 18.2.2.5. Financials (Based on Availability)
- 18.2.3 Tibco Software Inc
- 18.2.3.1. Overview
- 18.2.3.2. Products
- 18.2.3.3. SWOT Analysis
- 18.2.3.4. Recent Developments
- 18.2.3.5. Financials (Based on Availability)
- 18.2.4 Red Lambda Inc *List Not Exhaustive
- 18.2.4.1. Overview
- 18.2.4.2. Products
- 18.2.4.3. SWOT Analysis
- 18.2.4.4. Recent Developments
- 18.2.4.5. Financials (Based on Availability)
- 18.2.5 IBM Corporation
- 18.2.5.1. Overview
- 18.2.5.2. Products
- 18.2.5.3. SWOT Analysis
- 18.2.5.4. Recent Developments
- 18.2.5.5. Financials (Based on Availability)
- 18.2.6 Software AG
- 18.2.6.1. Overview
- 18.2.6.2. Products
- 18.2.6.3. SWOT Analysis
- 18.2.6.4. Recent Developments
- 18.2.6.5. Financials (Based on Availability)
- 18.2.7 Cisco Systems Inc
- 18.2.7.1. Overview
- 18.2.7.2. Products
- 18.2.7.3. SWOT Analysis
- 18.2.7.4. Recent Developments
- 18.2.7.5. Financials (Based on Availability)
- 18.2.8 Espertech Inc
- 18.2.8.1. Overview
- 18.2.8.2. Products
- 18.2.8.3. SWOT Analysis
- 18.2.8.4. Recent Developments
- 18.2.8.5. Financials (Based on Availability)
- 18.2.9 Oracle Corporation
- 18.2.9.1. Overview
- 18.2.9.2. Products
- 18.2.9.3. SWOT Analysis
- 18.2.9.4. Recent Developments
- 18.2.9.5. Financials (Based on Availability)
- 18.2.10 Informatica Corporation
- 18.2.10.1. Overview
- 18.2.10.2. Products
- 18.2.10.3. SWOT Analysis
- 18.2.10.4. Recent Developments
- 18.2.10.5. Financials (Based on Availability)
- 18.2.11 SAP SE
- 18.2.11.1. Overview
- 18.2.11.2. Products
- 18.2.11.3. SWOT Analysis
- 18.2.11.4. Recent Developments
- 18.2.11.5. Financials (Based on Availability)
- 18.2.1 SAS Institute Inc
List of Figures
- Figure 1: Global Complex Event Processing Industry Revenue Breakdown (Million, %) by Region 2024 & 2032
- Figure 2: North America Complex Event Processing Industry Revenue (Million), by Country 2024 & 2032
- Figure 3: North America Complex Event Processing Industry Revenue Share (%), by Country 2024 & 2032
- Figure 4: Europe Complex Event Processing Industry Revenue (Million), by Country 2024 & 2032
- Figure 5: Europe Complex Event Processing Industry Revenue Share (%), by Country 2024 & 2032
- Figure 6: Asia Pacific Complex Event Processing Industry Revenue (Million), by Country 2024 & 2032
- Figure 7: Asia Pacific Complex Event Processing Industry Revenue Share (%), by Country 2024 & 2032
- Figure 8: South America Complex Event Processing Industry Revenue (Million), by Country 2024 & 2032
- Figure 9: South America Complex Event Processing Industry Revenue Share (%), by Country 2024 & 2032
- Figure 10: North America Complex Event Processing Industry Revenue (Million), by Country 2024 & 2032
- Figure 11: North America Complex Event Processing Industry Revenue Share (%), by Country 2024 & 2032
- Figure 12: MEA Complex Event Processing Industry Revenue (Million), by Country 2024 & 2032
- Figure 13: MEA Complex Event Processing Industry Revenue Share (%), by Country 2024 & 2032
- Figure 14: North America Complex Event Processing Industry Revenue (Million), by Type 2024 & 2032
- Figure 15: North America Complex Event Processing Industry Revenue Share (%), by Type 2024 & 2032
- Figure 16: North America Complex Event Processing Industry Revenue (Million), by Enterprise Type 2024 & 2032
- Figure 17: North America Complex Event Processing Industry Revenue Share (%), by Enterprise Type 2024 & 2032
- Figure 18: North America Complex Event Processing Industry Revenue (Million), by End-user Vertical 2024 & 2032
- Figure 19: North America Complex Event Processing Industry Revenue Share (%), by End-user Vertical 2024 & 2032
- Figure 20: North America Complex Event Processing Industry Revenue (Million), by Country 2024 & 2032
- Figure 21: North America Complex Event Processing Industry Revenue Share (%), by Country 2024 & 2032
- Figure 22: Europe Complex Event Processing Industry Revenue (Million), by Type 2024 & 2032
- Figure 23: Europe Complex Event Processing Industry Revenue Share (%), by Type 2024 & 2032
- Figure 24: Europe Complex Event Processing Industry Revenue (Million), by Enterprise Type 2024 & 2032
- Figure 25: Europe Complex Event Processing Industry Revenue Share (%), by Enterprise Type 2024 & 2032
- Figure 26: Europe Complex Event Processing Industry Revenue (Million), by End-user Vertical 2024 & 2032
- Figure 27: Europe Complex Event Processing Industry Revenue Share (%), by End-user Vertical 2024 & 2032
- Figure 28: Europe Complex Event Processing Industry Revenue (Million), by Country 2024 & 2032
- Figure 29: Europe Complex Event Processing Industry Revenue Share (%), by Country 2024 & 2032
- Figure 30: Asia Complex Event Processing Industry Revenue (Million), by Type 2024 & 2032
- Figure 31: Asia Complex Event Processing Industry Revenue Share (%), by Type 2024 & 2032
- Figure 32: Asia Complex Event Processing Industry Revenue (Million), by Enterprise Type 2024 & 2032
- Figure 33: Asia Complex Event Processing Industry Revenue Share (%), by Enterprise Type 2024 & 2032
- Figure 34: Asia Complex Event Processing Industry Revenue (Million), by End-user Vertical 2024 & 2032
- Figure 35: Asia Complex Event Processing Industry Revenue Share (%), by End-user Vertical 2024 & 2032
- Figure 36: Asia Complex Event Processing Industry Revenue (Million), by Country 2024 & 2032
- Figure 37: Asia Complex Event Processing Industry Revenue Share (%), by Country 2024 & 2032
- Figure 38: Australia and New Zealand Complex Event Processing Industry Revenue (Million), by Type 2024 & 2032
- Figure 39: Australia and New Zealand Complex Event Processing Industry Revenue Share (%), by Type 2024 & 2032
- Figure 40: Australia and New Zealand Complex Event Processing Industry Revenue (Million), by Enterprise Type 2024 & 2032
- Figure 41: Australia and New Zealand Complex Event Processing Industry Revenue Share (%), by Enterprise Type 2024 & 2032
- Figure 42: Australia and New Zealand Complex Event Processing Industry Revenue (Million), by End-user Vertical 2024 & 2032
- Figure 43: Australia and New Zealand Complex Event Processing Industry Revenue Share (%), by End-user Vertical 2024 & 2032
- Figure 44: Australia and New Zealand Complex Event Processing Industry Revenue (Million), by Country 2024 & 2032
- Figure 45: Australia and New Zealand Complex Event Processing Industry Revenue Share (%), by Country 2024 & 2032
- Figure 46: Latin America Complex Event Processing Industry Revenue (Million), by Type 2024 & 2032
- Figure 47: Latin America Complex Event Processing Industry Revenue Share (%), by Type 2024 & 2032
- Figure 48: Latin America Complex Event Processing Industry Revenue (Million), by Enterprise Type 2024 & 2032
- Figure 49: Latin America Complex Event Processing Industry Revenue Share (%), by Enterprise Type 2024 & 2032
- Figure 50: Latin America Complex Event Processing Industry Revenue (Million), by End-user Vertical 2024 & 2032
- Figure 51: Latin America Complex Event Processing Industry Revenue Share (%), by End-user Vertical 2024 & 2032
- Figure 52: Latin America Complex Event Processing Industry Revenue (Million), by Country 2024 & 2032
- Figure 53: Latin America Complex Event Processing Industry Revenue Share (%), by Country 2024 & 2032
- Figure 54: Middle East and Africa Complex Event Processing Industry Revenue (Million), by Type 2024 & 2032
- Figure 55: Middle East and Africa Complex Event Processing Industry Revenue Share (%), by Type 2024 & 2032
- Figure 56: Middle East and Africa Complex Event Processing Industry Revenue (Million), by Enterprise Type 2024 & 2032
- Figure 57: Middle East and Africa Complex Event Processing Industry Revenue Share (%), by Enterprise Type 2024 & 2032
- Figure 58: Middle East and Africa Complex Event Processing Industry Revenue (Million), by End-user Vertical 2024 & 2032
- Figure 59: Middle East and Africa Complex Event Processing Industry Revenue Share (%), by End-user Vertical 2024 & 2032
- Figure 60: Middle East and Africa Complex Event Processing Industry Revenue (Million), by Country 2024 & 2032
- Figure 61: Middle East and Africa Complex Event Processing Industry Revenue Share (%), by Country 2024 & 2032
List of Tables
- Table 1: Global Complex Event Processing Industry Revenue Million Forecast, by Region 2019 & 2032
- Table 2: Global Complex Event Processing Industry Revenue Million Forecast, by Type 2019 & 2032
- Table 3: Global Complex Event Processing Industry Revenue Million Forecast, by Enterprise Type 2019 & 2032
- Table 4: Global Complex Event Processing Industry Revenue Million Forecast, by End-user Vertical 2019 & 2032
- Table 5: Global Complex Event Processing Industry Revenue Million Forecast, by Region 2019 & 2032
- Table 6: Global Complex Event Processing Industry Revenue Million Forecast, by Country 2019 & 2032
- Table 7: United States Complex Event Processing Industry Revenue (Million) Forecast, by Application 2019 & 2032
- Table 8: Canada Complex Event Processing Industry Revenue (Million) Forecast, by Application 2019 & 2032
- Table 9: Mexico Complex Event Processing Industry Revenue (Million) Forecast, by Application 2019 & 2032
- Table 10: Global Complex Event Processing Industry Revenue Million Forecast, by Country 2019 & 2032
- Table 11: Germany Complex Event Processing Industry Revenue (Million) Forecast, by Application 2019 & 2032
- Table 12: United Kingdom Complex Event Processing Industry Revenue (Million) Forecast, by Application 2019 & 2032
- Table 13: France Complex Event Processing Industry Revenue (Million) Forecast, by Application 2019 & 2032
- Table 14: Spain Complex Event Processing Industry Revenue (Million) Forecast, by Application 2019 & 2032
- Table 15: Italy Complex Event Processing Industry Revenue (Million) Forecast, by Application 2019 & 2032
- Table 16: Spain Complex Event Processing Industry Revenue (Million) Forecast, by Application 2019 & 2032
- Table 17: Belgium Complex Event Processing Industry Revenue (Million) Forecast, by Application 2019 & 2032
- Table 18: Netherland Complex Event Processing Industry Revenue (Million) Forecast, by Application 2019 & 2032
- Table 19: Nordics Complex Event Processing Industry Revenue (Million) Forecast, by Application 2019 & 2032
- Table 20: Rest of Europe Complex Event Processing Industry Revenue (Million) Forecast, by Application 2019 & 2032
- Table 21: Global Complex Event Processing Industry Revenue Million Forecast, by Country 2019 & 2032
- Table 22: China Complex Event Processing Industry Revenue (Million) Forecast, by Application 2019 & 2032
- Table 23: Japan Complex Event Processing Industry Revenue (Million) Forecast, by Application 2019 & 2032
- Table 24: India Complex Event Processing Industry Revenue (Million) Forecast, by Application 2019 & 2032
- Table 25: South Korea Complex Event Processing Industry Revenue (Million) Forecast, by Application 2019 & 2032
- Table 26: Southeast Asia Complex Event Processing Industry Revenue (Million) Forecast, by Application 2019 & 2032
- Table 27: Australia Complex Event Processing Industry Revenue (Million) Forecast, by Application 2019 & 2032
- Table 28: Indonesia Complex Event Processing Industry Revenue (Million) Forecast, by Application 2019 & 2032
- Table 29: Phillipes Complex Event Processing Industry Revenue (Million) Forecast, by Application 2019 & 2032
- Table 30: Singapore Complex Event Processing Industry Revenue (Million) Forecast, by Application 2019 & 2032
- Table 31: Thailandc Complex Event Processing Industry Revenue (Million) Forecast, by Application 2019 & 2032
- Table 32: Rest of Asia Pacific Complex Event Processing Industry Revenue (Million) Forecast, by Application 2019 & 2032
- Table 33: Global Complex Event Processing Industry Revenue Million Forecast, by Country 2019 & 2032
- Table 34: Brazil Complex Event Processing Industry Revenue (Million) Forecast, by Application 2019 & 2032
- Table 35: Argentina Complex Event Processing Industry Revenue (Million) Forecast, by Application 2019 & 2032
- Table 36: Peru Complex Event Processing Industry Revenue (Million) Forecast, by Application 2019 & 2032
- Table 37: Chile Complex Event Processing Industry Revenue (Million) Forecast, by Application 2019 & 2032
- Table 38: Colombia Complex Event Processing Industry Revenue (Million) Forecast, by Application 2019 & 2032
- Table 39: Ecuador Complex Event Processing Industry Revenue (Million) Forecast, by Application 2019 & 2032
- Table 40: Venezuela Complex Event Processing Industry Revenue (Million) Forecast, by Application 2019 & 2032
- Table 41: Rest of South America Complex Event Processing Industry Revenue (Million) Forecast, by Application 2019 & 2032
- Table 42: Global Complex Event Processing Industry Revenue Million Forecast, by Country 2019 & 2032
- Table 43: United States Complex Event Processing Industry Revenue (Million) Forecast, by Application 2019 & 2032
- Table 44: Canada Complex Event Processing Industry Revenue (Million) Forecast, by Application 2019 & 2032
- Table 45: Mexico Complex Event Processing Industry Revenue (Million) Forecast, by Application 2019 & 2032
- Table 46: Global Complex Event Processing Industry Revenue Million Forecast, by Country 2019 & 2032
- Table 47: United Arab Emirates Complex Event Processing Industry Revenue (Million) Forecast, by Application 2019 & 2032
- Table 48: Saudi Arabia Complex Event Processing Industry Revenue (Million) Forecast, by Application 2019 & 2032
- Table 49: South Africa Complex Event Processing Industry Revenue (Million) Forecast, by Application 2019 & 2032
- Table 50: Rest of Middle East and Africa Complex Event Processing Industry Revenue (Million) Forecast, by Application 2019 & 2032
- Table 51: Global Complex Event Processing Industry Revenue Million Forecast, by Type 2019 & 2032
- Table 52: Global Complex Event Processing Industry Revenue Million Forecast, by Enterprise Type 2019 & 2032
- Table 53: Global Complex Event Processing Industry Revenue Million Forecast, by End-user Vertical 2019 & 2032
- Table 54: Global Complex Event Processing Industry Revenue Million Forecast, by Country 2019 & 2032
- Table 55: Global Complex Event Processing Industry Revenue Million Forecast, by Type 2019 & 2032
- Table 56: Global Complex Event Processing Industry Revenue Million Forecast, by Enterprise Type 2019 & 2032
- Table 57: Global Complex Event Processing Industry Revenue Million Forecast, by End-user Vertical 2019 & 2032
- Table 58: Global Complex Event Processing Industry Revenue Million Forecast, by Country 2019 & 2032
- Table 59: Global Complex Event Processing Industry Revenue Million Forecast, by Type 2019 & 2032
- Table 60: Global Complex Event Processing Industry Revenue Million Forecast, by Enterprise Type 2019 & 2032
- Table 61: Global Complex Event Processing Industry Revenue Million Forecast, by End-user Vertical 2019 & 2032
- Table 62: Global Complex Event Processing Industry Revenue Million Forecast, by Country 2019 & 2032
- Table 63: Global Complex Event Processing Industry Revenue Million Forecast, by Type 2019 & 2032
- Table 64: Global Complex Event Processing Industry Revenue Million Forecast, by Enterprise Type 2019 & 2032
- Table 65: Global Complex Event Processing Industry Revenue Million Forecast, by End-user Vertical 2019 & 2032
- Table 66: Global Complex Event Processing Industry Revenue Million Forecast, by Country 2019 & 2032
- Table 67: Global Complex Event Processing Industry Revenue Million Forecast, by Type 2019 & 2032
- Table 68: Global Complex Event Processing Industry Revenue Million Forecast, by Enterprise Type 2019 & 2032
- Table 69: Global Complex Event Processing Industry Revenue Million Forecast, by End-user Vertical 2019 & 2032
- Table 70: Global Complex Event Processing Industry Revenue Million Forecast, by Country 2019 & 2032
- Table 71: Global Complex Event Processing Industry Revenue Million Forecast, by Type 2019 & 2032
- Table 72: Global Complex Event Processing Industry Revenue Million Forecast, by Enterprise Type 2019 & 2032
- Table 73: Global Complex Event Processing Industry Revenue Million Forecast, by End-user Vertical 2019 & 2032
- Table 74: Global Complex Event Processing Industry Revenue Million Forecast, by Country 2019 & 2032
Frequently Asked Questions
1. What is the projected Compound Annual Growth Rate (CAGR) of the Complex Event Processing Industry?
The projected CAGR is approximately 23.76%.
2. Which companies are prominent players in the Complex Event Processing Industry?
Key companies in the market include SAS Institute Inc, Nastel Technologies Inc, Tibco Software Inc, Red Lambda Inc *List Not Exhaustive, IBM Corporation, Software AG, Cisco Systems Inc, Espertech Inc, Oracle Corporation, Informatica Corporation, SAP SE.
3. What are the main segments of the Complex Event Processing Industry?
The market segments include Type, Enterprise Type, End-user Vertical.
4. Can you provide details about the market size?
The market size is estimated to be USD 5.27 Million as of 2022.
5. What are some drivers contributing to market growth?
Development in the Field of Machine Learning and Data Analytics; Growing Need for Real-time Analytics.
6. What are the notable trends driving market growth?
BFSI End-user Segment to Grow Significantly.
7. Are there any restraints impacting market growth?
Lack of Consistency in Results.
8. Can you provide examples of recent developments in the market?
June 2023 - Cisco said it is reimagining how people interact with the new, advanced artificial intelligence technologies. In order to help organizations achieve productivity and simplicity in their workforce, Cisco will take advantage of major language models for Collaboration and Security across its portfolio.
9. What pricing options are available for accessing the report?
Pricing options include single-user, multi-user, and enterprise licenses priced at USD 4750, USD 5250, and USD 8750 respectively.
10. Is the market size provided in terms of value or volume?
The market size is provided in terms of value, measured in Million.
11. Are there any specific market keywords associated with the report?
Yes, the market keyword associated with the report is "Complex Event Processing Industry," which aids in identifying and referencing the specific market segment covered.
12. How do I determine which pricing option suits my needs best?
The pricing options vary based on user requirements and access needs. Individual users may opt for single-user licenses, while businesses requiring broader access may choose multi-user or enterprise licenses for cost-effective access to the report.
13. Are there any additional resources or data provided in the Complex Event Processing Industry report?
While the report offers comprehensive insights, it's advisable to review the specific contents or supplementary materials provided to ascertain if additional resources or data are available.
14. How can I stay updated on further developments or reports in the Complex Event Processing Industry?
To stay informed about further developments, trends, and reports in the Complex Event Processing Industry, consider subscribing to industry newsletters, following relevant companies and organizations, or regularly checking reputable industry news sources and publications.
Methodology
Step 1 - Identification of Relevant Samples Size from Population Database


Step 2 - Approaches for Defining Global Market Size (Value, Volume* & Price*)

Note*: In applicable scenarios
Step 3 - Data Sources
Primary Research
- Web Analytics
- Survey Reports
- Research Institute
- Latest Research Reports
- Opinion Leaders
Secondary Research
- Annual Reports
- White Paper
- Latest Press Release
- Industry Association
- Paid Database
- Investor Presentations

Step 4 - Data Triangulation
Involves using different sources of information in order to increase the validity of a study
These sources are likely to be stakeholders in a program - participants, other researchers, program staff, other community members, and so on.
Then we put all data in single framework & apply various statistical tools to find out the dynamic on the market.
During the analysis stage, feedback from the stakeholder groups would be compared to determine areas of agreement as well as areas of divergence


