
Key Insights
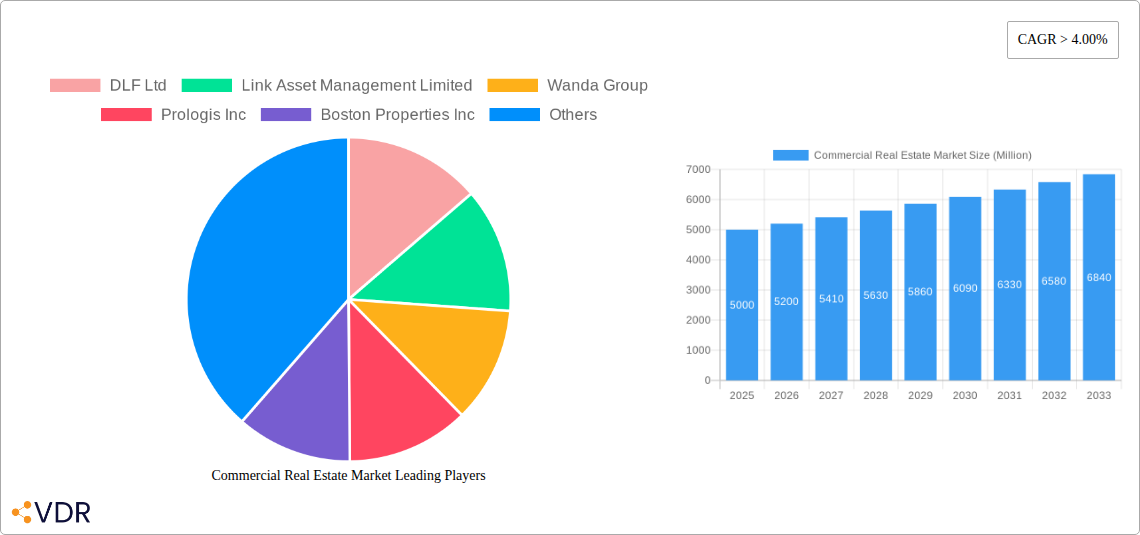
The global commercial real estate (CRE) market is experiencing robust growth, projected to maintain a Compound Annual Growth Rate (CAGR) exceeding 4.00% from 2025 to 2033. This expansion is fueled by several key drivers. The ongoing urbanization trend globally continues to increase demand for office spaces, particularly in rapidly developing economies within Asia-Pacific and other emerging markets. The rise of e-commerce is significantly impacting the logistics and industrial sectors, leading to a surge in demand for warehouse and distribution centers. Furthermore, the recovery of the hospitality sector post-pandemic, coupled with sustained growth in tourism, contributes to increased investment in hotel and leisure properties. The increasing adoption of sustainable building practices and technological advancements in building management systems further enhances the appeal of CRE investments.
However, the market also faces challenges. Economic uncertainty, rising interest rates, and fluctuating inflation rates can impact investment decisions and rental yields. Geopolitical instability in certain regions may also cause delays or disruptions to projects. Moreover, the evolving nature of work and the increasing adoption of hybrid work models could alter future demand for traditional office spaces, demanding adaptive strategies from CRE developers and owners. The segmentation of the market – encompassing offices, retail, industrial/logistics, multi-family residential, and hospitality – presents both opportunities and challenges, with each segment demonstrating unique growth trajectories and susceptibility to specific market forces. The major players, including DLF Ltd, Link Asset Management Limited, Wanda Group, Prologis Inc, and others, are actively shaping the market through strategic acquisitions, developments, and innovative solutions to navigate these complexities. Successful navigation of these factors will determine the continued robust growth and future trajectory of the CRE market.
Commercial Real Estate Market Report: 2019-2033 Forecast
This comprehensive report delivers an in-depth analysis of the global Commercial Real Estate Market, encompassing historical data (2019-2024), current estimates (2025), and future projections (2025-2033). It provides a granular view of market dynamics, growth trends, key players, and emerging opportunities across various segments (Offices, Retail, Industrial/Logistics, Multi-family, Hospitality) and geographical regions. The report is invaluable for investors, developers, real estate professionals, and anyone seeking a detailed understanding of this dynamic sector. Market size is presented in Million units.
Commercial Real Estate Market Market Dynamics & Structure
The global commercial real estate market is characterized by a moderately concentrated structure, with a few large players like Prologis Inc, Brookfield Asset Management Inc, and Simon Property Group LP holding significant market share (xx%). However, numerous smaller firms and regional players contribute significantly to the overall market volume. Technological innovation, particularly in property management software, data analytics, and sustainable building practices, is driving market evolution. Regulatory frameworks, including zoning laws and environmental regulations, heavily influence investment decisions and development projects. The market faces competition from alternative investment options, like government bonds or private equity, influencing investor allocation. End-user demographics, especially shifts in workforce composition and consumer preferences, directly shape demand across different property types. M&A activity remains robust, with deal volumes averaging xx million USD annually over the past five years, driven by portfolio diversification and market consolidation.
- Market Concentration: Moderately concentrated, top 5 players hold xx% market share (2024).
- Technological Drivers: PropTech innovations (e.g., smart building technology, VR showrooms) are transforming operations and investment decisions.
- Regulatory Landscape: Zoning regulations, environmental standards, and tax incentives significantly impact development and investment.
- Competitive Substitutes: Alternative investment assets (e.g., bonds, equities) compete for investor capital.
- End-User Demographics: Shifting workforce trends (remote work, co-working spaces) alter office space demand; evolving consumer behavior impacts retail and hospitality.
- M&A Trends: Annual deal volume averaged xx million USD (2019-2024), driven by consolidation and portfolio expansion.
Commercial Real Estate Market Growth Trends & Insights
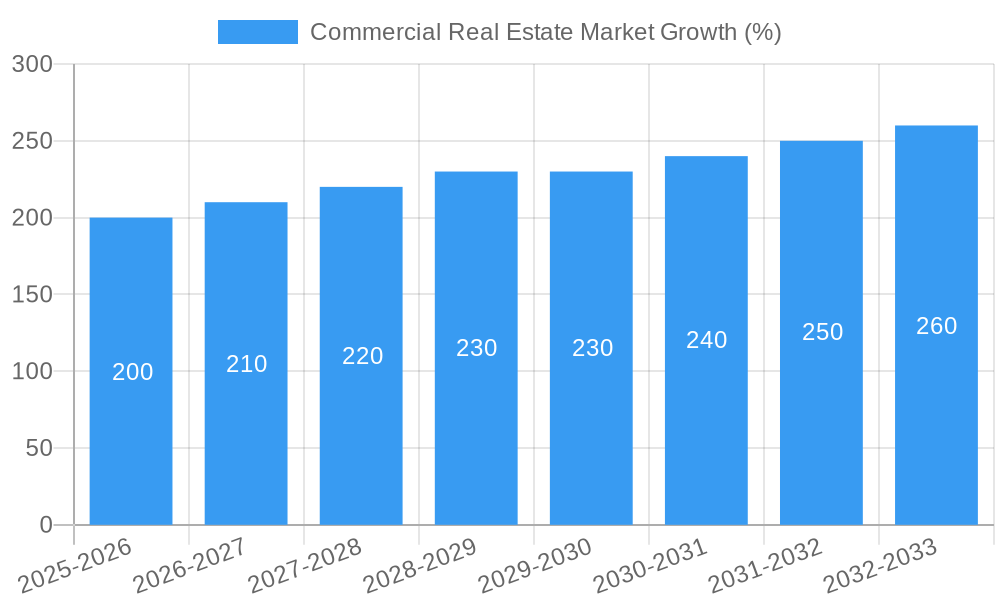
The commercial real estate market experienced a CAGR of xx% during the historical period (2019-2024), primarily driven by increasing urbanization, robust economic growth in several regions, and low interest rates. The estimated market size in 2025 is xx million units. However, the COVID-19 pandemic caused a temporary slowdown in certain segments, notably hospitality and retail. The recovery has been uneven, with strong growth in industrial/logistics driven by e-commerce expansion. Technological disruptions, like the rise of co-working spaces and remote work, significantly impacted office demand. Consumer behavior shifts towards experiences and online retail are reshaping retail spaces. The adoption of sustainable building practices is steadily increasing, driven by environmental concerns and regulatory pressures. Market penetration of green building certifications is projected to reach xx% by 2033. The forecast period (2025-2033) anticipates a CAGR of xx%, fueled by infrastructure development in emerging markets and continued technological advancements.
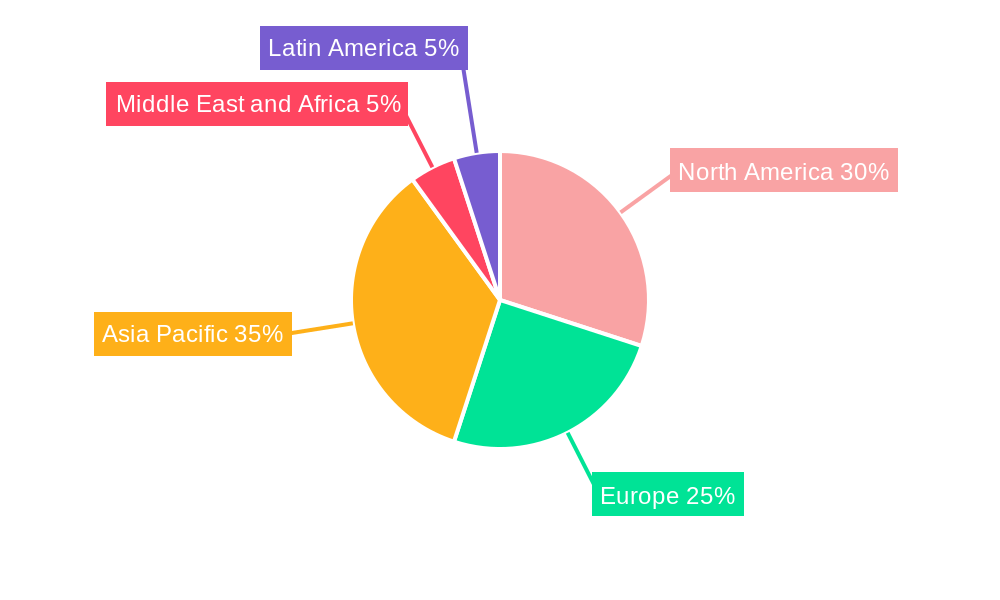
Dominant Regions, Countries, or Segments in Commercial Real Estate Market
The Industrial/Logistics segment is currently the dominant sector, driven by the explosive growth of e-commerce and supply chain optimization initiatives. Its market share in 2025 is estimated at xx%. North America and Asia-Pacific are the leading regions, contributing xx% and xx% to global market value respectively. The dominance of these regions is fueled by strong economic growth, robust infrastructure development, and a high concentration of major players. Within countries, major metropolitan areas with diverse economies and robust population growth experience higher demand.
- Key Drivers for Industrial/Logistics: E-commerce expansion, global supply chain restructuring, and increasing demand for warehousing and distribution facilities.
- North America Dominance: Strong economic performance, well-developed infrastructure, and a large pool of capital.
- Asia-Pacific Growth: Rapid urbanization, expanding middle class, and robust infrastructure investment.
Commercial Real Estate Market Product Landscape
The commercial real estate product landscape is evolving rapidly with a focus on sustainable and smart buildings. Innovations include smart building technologies (e.g., energy-efficient HVAC systems, IoT-enabled sensors) and the incorporation of sustainable materials. These advancements offer improved energy efficiency, reduced operational costs, and enhanced tenant appeal, making them highly sought-after attributes. The performance of commercial real estate assets is now increasingly measured by metrics such as energy consumption, carbon footprint, and tenant satisfaction, along with traditional measures like occupancy rates and rental income. Unique selling propositions include green building certifications, state-of-the-art amenities, and flexible lease terms.
Key Drivers, Barriers & Challenges in Commercial Real Estate Market
Key Drivers: Increased urbanization, economic growth in emerging markets, expansion of e-commerce, and technological advancements are driving market growth. Government incentives and infrastructure investment projects also stimulate development.
Key Challenges: Supply chain disruptions, fluctuating interest rates, regulatory uncertainty (zoning laws, environmental regulations), and intense competition among developers and investors are key restraints. The impact of these challenges varies across segments and geographical regions. For example, supply chain issues significantly impact the construction timeline and project costs.
Emerging Opportunities in Commercial Real Estate Market
Emerging opportunities include the growth of co-living spaces, demand for flexible workspaces, the rise of sustainable building technologies (e.g., green buildings, net-zero carbon buildings), and the increasing adoption of PropTech solutions. Untapped markets in developing economies also present significant potential. Evolving consumer preferences, including the desire for amenity-rich properties and experiences, are reshaping the design and features of commercial properties.
Growth Accelerators in the Commercial Real Estate Market Industry
Long-term growth will be driven by technological breakthroughs (e.g., AI-powered property management, virtual reality for property viewings), strategic partnerships between developers and technology companies, and successful market expansion into emerging economies. Sustainable development practices will be crucial for attracting investors and tenants, while data-driven decision-making will optimize investment strategies and asset management.
Key Players Shaping the Commercial Real Estate Market Market
- DLF Ltd
- Link Asset Management Limited
- Wanda Group
- Prologis Inc
- Boston Properties Inc
- Brookfield Asset Management Inc
- Segro
- Nakheel PJSC
- MaxWell Realty
- Onni Contracting Ltd
- Simon Property Group LP
- Shannon waltchack LLC
- ATC IP LLC
- RAK Properties
List Not Exhaustive
Notable Milestones in Commercial Real Estate Market Sector
- November 2022: Colliers CAAC acquired a Costa Rican real estate consultancy, expanding its reach in Central America, the Caribbean, and Andean countries.
- October 2022: M&G Plc's real estate division acquired a prime office building in Yokohama, Japan, for over USD 700 million, signifying significant investment in the Asian market.
In-Depth Commercial Real Estate Market Market Outlook
The future of the commercial real estate market looks promising, driven by the factors previously discussed. Strategic opportunities lie in leveraging technology to improve efficiency, embracing sustainable building practices, targeting underserved markets, and adapting to evolving consumer preferences. The market's potential for growth is substantial, particularly in emerging economies and segments like industrial/logistics and co-working spaces. Continued innovation and strategic partnerships will be key to success in this dynamic and evolving sector.
Commercial Real Estate Market Segmentation
-
1. Type
- 1.1. Offices
- 1.2. Retail
- 1.3. Industrial/Logistics
- 1.4. Multi-family
- 1.5. Hospitality
Commercial Real Estate Market Segmentation By Geography
-
1. Asia Pacific
- 1.1. China
- 1.2. Japan
- 1.3. India
- 1.4. South Korea
- 1.5. Rest of Asia Pacific
-
2. North America
- 2.1. United States
- 2.2. Canada
-
3. Europe
- 3.1. United Kingdom
- 3.2. Germany
- 3.3. France
- 3.4. Russia
- 3.5. Rest of Europe
-
4. Middle East and Africa
- 4.1. Saudi Arabia
- 4.2. United Arab Emirates
- 4.3. Qatar
- 4.4. South Africa
- 4.5. Rest of Middle East and Africa
-
5. Latin America
- 5.1. Brazil
- 5.2. Mexico
- 5.3. Argentina
- 5.4. Colombia
- 5.5. Rest of Latin America
Commercial Real Estate Market REPORT HIGHLIGHTS
| Aspects | Details |
|---|---|
| Study Period | 2019-2033 |
| Base Year | 2024 |
| Estimated Year | 2025 |
| Forecast Period | 2025-2033 |
| Historical Period | 2019-2024 |
| Growth Rate | CAGR of > 4.00% from 2019-2033 |
| Segmentation |
|
Table of Contents
- 1. Introduction
- 1.1. Research Scope
- 1.2. Market Segmentation
- 1.3. Research Methodology
- 1.4. Definitions and Assumptions
- 2. Executive Summary
- 2.1. Introduction
- 3. Market Dynamics
- 3.1. Introduction
- 3.2. Market Drivers
- 3.2.1. 4.; Increase in Aging Population Driving the Market4.; Healthcare and Long-term Care Needs Driving the Market
- 3.3. Market Restrains
- 3.3.1. 4.; High Affordability and Cost of Care Affecting the Market4.; Staffing and Workforce Challenges Affecting the Market
- 3.4. Market Trends
- 3.4.1. Office Markets to Witness Increased Growth
- 4. Market Factor Analysis
- 4.1. Porters Five Forces
- 4.2. Supply/Value Chain
- 4.3. PESTEL analysis
- 4.4. Market Entropy
- 4.5. Patent/Trademark Analysis
- 5. Global Commercial Real Estate Market Analysis, Insights and Forecast, 2019-2031
- 5.1. Market Analysis, Insights and Forecast - by Type
- 5.1.1. Offices
- 5.1.2. Retail
- 5.1.3. Industrial/Logistics
- 5.1.4. Multi-family
- 5.1.5. Hospitality
- 5.2. Market Analysis, Insights and Forecast - by Region
- 5.2.1. Asia Pacific
- 5.2.2. North America
- 5.2.3. Europe
- 5.2.4. Middle East and Africa
- 5.2.5. Latin America
- 5.1. Market Analysis, Insights and Forecast - by Type
- 6. Asia Pacific Commercial Real Estate Market Analysis, Insights and Forecast, 2019-2031
- 6.1. Market Analysis, Insights and Forecast - by Type
- 6.1.1. Offices
- 6.1.2. Retail
- 6.1.3. Industrial/Logistics
- 6.1.4. Multi-family
- 6.1.5. Hospitality
- 6.1. Market Analysis, Insights and Forecast - by Type
- 7. North America Commercial Real Estate Market Analysis, Insights and Forecast, 2019-2031
- 7.1. Market Analysis, Insights and Forecast - by Type
- 7.1.1. Offices
- 7.1.2. Retail
- 7.1.3. Industrial/Logistics
- 7.1.4. Multi-family
- 7.1.5. Hospitality
- 7.1. Market Analysis, Insights and Forecast - by Type
- 8. Europe Commercial Real Estate Market Analysis, Insights and Forecast, 2019-2031
- 8.1. Market Analysis, Insights and Forecast - by Type
- 8.1.1. Offices
- 8.1.2. Retail
- 8.1.3. Industrial/Logistics
- 8.1.4. Multi-family
- 8.1.5. Hospitality
- 8.1. Market Analysis, Insights and Forecast - by Type
- 9. Middle East and Africa Commercial Real Estate Market Analysis, Insights and Forecast, 2019-2031
- 9.1. Market Analysis, Insights and Forecast - by Type
- 9.1.1. Offices
- 9.1.2. Retail
- 9.1.3. Industrial/Logistics
- 9.1.4. Multi-family
- 9.1.5. Hospitality
- 9.1. Market Analysis, Insights and Forecast - by Type
- 10. Latin America Commercial Real Estate Market Analysis, Insights and Forecast, 2019-2031
- 10.1. Market Analysis, Insights and Forecast - by Type
- 10.1.1. Offices
- 10.1.2. Retail
- 10.1.3. Industrial/Logistics
- 10.1.4. Multi-family
- 10.1.5. Hospitality
- 10.1. Market Analysis, Insights and Forecast - by Type
- 11. Asia Pacific Commercial Real Estate Market Analysis, Insights and Forecast, 2019-2031
- 11.1. Market Analysis, Insights and Forecast - By Country/Sub-region
- 11.1.1 China
- 11.1.2 Japan
- 11.1.3 India
- 11.1.4 South Korea
- 11.1.5 Rest of Asia Pacific
- 12. North America Commercial Real Estate Market Analysis, Insights and Forecast, 2019-2031
- 12.1. Market Analysis, Insights and Forecast - By Country/Sub-region
- 12.1.1 United States
- 12.1.2 Canada
- 13. Europe Commercial Real Estate Market Analysis, Insights and Forecast, 2019-2031
- 13.1. Market Analysis, Insights and Forecast - By Country/Sub-region
- 13.1.1 United Kingdom
- 13.1.2 Germany
- 13.1.3 France
- 13.1.4 Russia
- 13.1.5 Rest of Europe
- 14. Middle East and Africa Commercial Real Estate Market Analysis, Insights and Forecast, 2019-2031
- 14.1. Market Analysis, Insights and Forecast - By Country/Sub-region
- 14.1.1 Saudi Arabia
- 14.1.2 United Arab Emirates
- 14.1.3 Qatar
- 14.1.4 South Africa
- 14.1.5 Rest of Middle East and Africa
- 15. Latin America Commercial Real Estate Market Analysis, Insights and Forecast, 2019-2031
- 15.1. Market Analysis, Insights and Forecast - By Country/Sub-region
- 15.1.1 Brazil
- 15.1.2 Mexico
- 15.1.3 Argentina
- 15.1.4 Colombia
- 15.1.5 Rest of Latin America
- 16. Competitive Analysis
- 16.1. Global Market Share Analysis 2024
- 16.2. Company Profiles
- 16.2.1 DLF Ltd
- 16.2.1.1. Overview
- 16.2.1.2. Products
- 16.2.1.3. SWOT Analysis
- 16.2.1.4. Recent Developments
- 16.2.1.5. Financials (Based on Availability)
- 16.2.2 Link Asset Management Limited
- 16.2.2.1. Overview
- 16.2.2.2. Products
- 16.2.2.3. SWOT Analysis
- 16.2.2.4. Recent Developments
- 16.2.2.5. Financials (Based on Availability)
- 16.2.3 Wanda Group
- 16.2.3.1. Overview
- 16.2.3.2. Products
- 16.2.3.3. SWOT Analysis
- 16.2.3.4. Recent Developments
- 16.2.3.5. Financials (Based on Availability)
- 16.2.4 Prologis Inc
- 16.2.4.1. Overview
- 16.2.4.2. Products
- 16.2.4.3. SWOT Analysis
- 16.2.4.4. Recent Developments
- 16.2.4.5. Financials (Based on Availability)
- 16.2.5 Boston Properties Inc
- 16.2.5.1. Overview
- 16.2.5.2. Products
- 16.2.5.3. SWOT Analysis
- 16.2.5.4. Recent Developments
- 16.2.5.5. Financials (Based on Availability)
- 16.2.6 Brookfield Asset Management Inc
- 16.2.6.1. Overview
- 16.2.6.2. Products
- 16.2.6.3. SWOT Analysis
- 16.2.6.4. Recent Developments
- 16.2.6.5. Financials (Based on Availability)
- 16.2.7 Segro
- 16.2.7.1. Overview
- 16.2.7.2. Products
- 16.2.7.3. SWOT Analysis
- 16.2.7.4. Recent Developments
- 16.2.7.5. Financials (Based on Availability)
- 16.2.8 Nakheel PJSC
- 16.2.8.1. Overview
- 16.2.8.2. Products
- 16.2.8.3. SWOT Analysis
- 16.2.8.4. Recent Developments
- 16.2.8.5. Financials (Based on Availability)
- 16.2.9 MaxWell Realty
- 16.2.9.1. Overview
- 16.2.9.2. Products
- 16.2.9.3. SWOT Analysis
- 16.2.9.4. Recent Developments
- 16.2.9.5. Financials (Based on Availability)
- 16.2.10 Onni Contracting Ltd
- 16.2.10.1. Overview
- 16.2.10.2. Products
- 16.2.10.3. SWOT Analysis
- 16.2.10.4. Recent Developments
- 16.2.10.5. Financials (Based on Availability)
- 16.2.11 Simon Property Group LP
- 16.2.11.1. Overview
- 16.2.11.2. Products
- 16.2.11.3. SWOT Analysis
- 16.2.11.4. Recent Developments
- 16.2.11.5. Financials (Based on Availability)
- 16.2.12 Shannon waltchack LLC
- 16.2.12.1. Overview
- 16.2.12.2. Products
- 16.2.12.3. SWOT Analysis
- 16.2.12.4. Recent Developments
- 16.2.12.5. Financials (Based on Availability)
- 16.2.13 ATC IP LLC
- 16.2.13.1. Overview
- 16.2.13.2. Products
- 16.2.13.3. SWOT Analysis
- 16.2.13.4. Recent Developments
- 16.2.13.5. Financials (Based on Availability)
- 16.2.14 RAK Properties**List Not Exhaustive
- 16.2.14.1. Overview
- 16.2.14.2. Products
- 16.2.14.3. SWOT Analysis
- 16.2.14.4. Recent Developments
- 16.2.14.5. Financials (Based on Availability)
- 16.2.1 DLF Ltd
List of Figures
- Figure 1: Global Commercial Real Estate Market Revenue Breakdown (Million, %) by Region 2024 & 2032
- Figure 2: Asia Pacific Commercial Real Estate Market Revenue (Million), by Country 2024 & 2032
- Figure 3: Asia Pacific Commercial Real Estate Market Revenue Share (%), by Country 2024 & 2032
- Figure 4: North America Commercial Real Estate Market Revenue (Million), by Country 2024 & 2032
- Figure 5: North America Commercial Real Estate Market Revenue Share (%), by Country 2024 & 2032
- Figure 6: Europe Commercial Real Estate Market Revenue (Million), by Country 2024 & 2032
- Figure 7: Europe Commercial Real Estate Market Revenue Share (%), by Country 2024 & 2032
- Figure 8: Middle East and Africa Commercial Real Estate Market Revenue (Million), by Country 2024 & 2032
- Figure 9: Middle East and Africa Commercial Real Estate Market Revenue Share (%), by Country 2024 & 2032
- Figure 10: Latin America Commercial Real Estate Market Revenue (Million), by Country 2024 & 2032
- Figure 11: Latin America Commercial Real Estate Market Revenue Share (%), by Country 2024 & 2032
- Figure 12: Asia Pacific Commercial Real Estate Market Revenue (Million), by Type 2024 & 2032
- Figure 13: Asia Pacific Commercial Real Estate Market Revenue Share (%), by Type 2024 & 2032
- Figure 14: Asia Pacific Commercial Real Estate Market Revenue (Million), by Country 2024 & 2032
- Figure 15: Asia Pacific Commercial Real Estate Market Revenue Share (%), by Country 2024 & 2032
- Figure 16: North America Commercial Real Estate Market Revenue (Million), by Type 2024 & 2032
- Figure 17: North America Commercial Real Estate Market Revenue Share (%), by Type 2024 & 2032
- Figure 18: North America Commercial Real Estate Market Revenue (Million), by Country 2024 & 2032
- Figure 19: North America Commercial Real Estate Market Revenue Share (%), by Country 2024 & 2032
- Figure 20: Europe Commercial Real Estate Market Revenue (Million), by Type 2024 & 2032
- Figure 21: Europe Commercial Real Estate Market Revenue Share (%), by Type 2024 & 2032
- Figure 22: Europe Commercial Real Estate Market Revenue (Million), by Country 2024 & 2032
- Figure 23: Europe Commercial Real Estate Market Revenue Share (%), by Country 2024 & 2032
- Figure 24: Middle East and Africa Commercial Real Estate Market Revenue (Million), by Type 2024 & 2032
- Figure 25: Middle East and Africa Commercial Real Estate Market Revenue Share (%), by Type 2024 & 2032
- Figure 26: Middle East and Africa Commercial Real Estate Market Revenue (Million), by Country 2024 & 2032
- Figure 27: Middle East and Africa Commercial Real Estate Market Revenue Share (%), by Country 2024 & 2032
- Figure 28: Latin America Commercial Real Estate Market Revenue (Million), by Type 2024 & 2032
- Figure 29: Latin America Commercial Real Estate Market Revenue Share (%), by Type 2024 & 2032
- Figure 30: Latin America Commercial Real Estate Market Revenue (Million), by Country 2024 & 2032
- Figure 31: Latin America Commercial Real Estate Market Revenue Share (%), by Country 2024 & 2032
List of Tables
- Table 1: Global Commercial Real Estate Market Revenue Million Forecast, by Region 2019 & 2032
- Table 2: Global Commercial Real Estate Market Revenue Million Forecast, by Type 2019 & 2032
- Table 3: Global Commercial Real Estate Market Revenue Million Forecast, by Region 2019 & 2032
- Table 4: Global Commercial Real Estate Market Revenue Million Forecast, by Country 2019 & 2032
- Table 5: China Commercial Real Estate Market Revenue (Million) Forecast, by Application 2019 & 2032
- Table 6: Japan Commercial Real Estate Market Revenue (Million) Forecast, by Application 2019 & 2032
- Table 7: India Commercial Real Estate Market Revenue (Million) Forecast, by Application 2019 & 2032
- Table 8: South Korea Commercial Real Estate Market Revenue (Million) Forecast, by Application 2019 & 2032
- Table 9: Rest of Asia Pacific Commercial Real Estate Market Revenue (Million) Forecast, by Application 2019 & 2032
- Table 10: Global Commercial Real Estate Market Revenue Million Forecast, by Country 2019 & 2032
- Table 11: United States Commercial Real Estate Market Revenue (Million) Forecast, by Application 2019 & 2032
- Table 12: Canada Commercial Real Estate Market Revenue (Million) Forecast, by Application 2019 & 2032
- Table 13: Global Commercial Real Estate Market Revenue Million Forecast, by Country 2019 & 2032
- Table 14: United Kingdom Commercial Real Estate Market Revenue (Million) Forecast, by Application 2019 & 2032
- Table 15: Germany Commercial Real Estate Market Revenue (Million) Forecast, by Application 2019 & 2032
- Table 16: France Commercial Real Estate Market Revenue (Million) Forecast, by Application 2019 & 2032
- Table 17: Russia Commercial Real Estate Market Revenue (Million) Forecast, by Application 2019 & 2032
- Table 18: Rest of Europe Commercial Real Estate Market Revenue (Million) Forecast, by Application 2019 & 2032
- Table 19: Global Commercial Real Estate Market Revenue Million Forecast, by Country 2019 & 2032
- Table 20: Saudi Arabia Commercial Real Estate Market Revenue (Million) Forecast, by Application 2019 & 2032
- Table 21: United Arab Emirates Commercial Real Estate Market Revenue (Million) Forecast, by Application 2019 & 2032
- Table 22: Qatar Commercial Real Estate Market Revenue (Million) Forecast, by Application 2019 & 2032
- Table 23: South Africa Commercial Real Estate Market Revenue (Million) Forecast, by Application 2019 & 2032
- Table 24: Rest of Middle East and Africa Commercial Real Estate Market Revenue (Million) Forecast, by Application 2019 & 2032
- Table 25: Global Commercial Real Estate Market Revenue Million Forecast, by Country 2019 & 2032
- Table 26: Brazil Commercial Real Estate Market Revenue (Million) Forecast, by Application 2019 & 2032
- Table 27: Mexico Commercial Real Estate Market Revenue (Million) Forecast, by Application 2019 & 2032
- Table 28: Argentina Commercial Real Estate Market Revenue (Million) Forecast, by Application 2019 & 2032
- Table 29: Colombia Commercial Real Estate Market Revenue (Million) Forecast, by Application 2019 & 2032
- Table 30: Rest of Latin America Commercial Real Estate Market Revenue (Million) Forecast, by Application 2019 & 2032
- Table 31: Global Commercial Real Estate Market Revenue Million Forecast, by Type 2019 & 2032
- Table 32: Global Commercial Real Estate Market Revenue Million Forecast, by Country 2019 & 2032
- Table 33: China Commercial Real Estate Market Revenue (Million) Forecast, by Application 2019 & 2032
- Table 34: Japan Commercial Real Estate Market Revenue (Million) Forecast, by Application 2019 & 2032
- Table 35: India Commercial Real Estate Market Revenue (Million) Forecast, by Application 2019 & 2032
- Table 36: South Korea Commercial Real Estate Market Revenue (Million) Forecast, by Application 2019 & 2032
- Table 37: Rest of Asia Pacific Commercial Real Estate Market Revenue (Million) Forecast, by Application 2019 & 2032
- Table 38: Global Commercial Real Estate Market Revenue Million Forecast, by Type 2019 & 2032
- Table 39: Global Commercial Real Estate Market Revenue Million Forecast, by Country 2019 & 2032
- Table 40: United States Commercial Real Estate Market Revenue (Million) Forecast, by Application 2019 & 2032
- Table 41: Canada Commercial Real Estate Market Revenue (Million) Forecast, by Application 2019 & 2032
- Table 42: Global Commercial Real Estate Market Revenue Million Forecast, by Type 2019 & 2032
- Table 43: Global Commercial Real Estate Market Revenue Million Forecast, by Country 2019 & 2032
- Table 44: United Kingdom Commercial Real Estate Market Revenue (Million) Forecast, by Application 2019 & 2032
- Table 45: Germany Commercial Real Estate Market Revenue (Million) Forecast, by Application 2019 & 2032
- Table 46: France Commercial Real Estate Market Revenue (Million) Forecast, by Application 2019 & 2032
- Table 47: Russia Commercial Real Estate Market Revenue (Million) Forecast, by Application 2019 & 2032
- Table 48: Rest of Europe Commercial Real Estate Market Revenue (Million) Forecast, by Application 2019 & 2032
- Table 49: Global Commercial Real Estate Market Revenue Million Forecast, by Type 2019 & 2032
- Table 50: Global Commercial Real Estate Market Revenue Million Forecast, by Country 2019 & 2032
- Table 51: Saudi Arabia Commercial Real Estate Market Revenue (Million) Forecast, by Application 2019 & 2032
- Table 52: United Arab Emirates Commercial Real Estate Market Revenue (Million) Forecast, by Application 2019 & 2032
- Table 53: Qatar Commercial Real Estate Market Revenue (Million) Forecast, by Application 2019 & 2032
- Table 54: South Africa Commercial Real Estate Market Revenue (Million) Forecast, by Application 2019 & 2032
- Table 55: Rest of Middle East and Africa Commercial Real Estate Market Revenue (Million) Forecast, by Application 2019 & 2032
- Table 56: Global Commercial Real Estate Market Revenue Million Forecast, by Type 2019 & 2032
- Table 57: Global Commercial Real Estate Market Revenue Million Forecast, by Country 2019 & 2032
- Table 58: Brazil Commercial Real Estate Market Revenue (Million) Forecast, by Application 2019 & 2032
- Table 59: Mexico Commercial Real Estate Market Revenue (Million) Forecast, by Application 2019 & 2032
- Table 60: Argentina Commercial Real Estate Market Revenue (Million) Forecast, by Application 2019 & 2032
- Table 61: Colombia Commercial Real Estate Market Revenue (Million) Forecast, by Application 2019 & 2032
- Table 62: Rest of Latin America Commercial Real Estate Market Revenue (Million) Forecast, by Application 2019 & 2032
Frequently Asked Questions
1. What is the projected Compound Annual Growth Rate (CAGR) of the Commercial Real Estate Market?
The projected CAGR is approximately > 4.00%.
2. Which companies are prominent players in the Commercial Real Estate Market?
Key companies in the market include DLF Ltd, Link Asset Management Limited, Wanda Group, Prologis Inc, Boston Properties Inc, Brookfield Asset Management Inc, Segro, Nakheel PJSC, MaxWell Realty, Onni Contracting Ltd, Simon Property Group LP, Shannon waltchack LLC, ATC IP LLC, RAK Properties**List Not Exhaustive.
3. What are the main segments of the Commercial Real Estate Market?
The market segments include Type.
4. Can you provide details about the market size?
The market size is estimated to be USD XX Million as of 2022.
5. What are some drivers contributing to market growth?
4.; Increase in Aging Population Driving the Market4.; Healthcare and Long-term Care Needs Driving the Market.
6. What are the notable trends driving market growth?
Office Markets to Witness Increased Growth.
7. Are there any restraints impacting market growth?
4.; High Affordability and Cost of Care Affecting the Market4.; Staffing and Workforce Challenges Affecting the Market.
8. Can you provide examples of recent developments in the market?
November 2022 - Colliers CAAC, a regional holding company, currently holding exclusive sublicenses for Central America, the Caribbean, and certain Andean countries from Colliers International announced the acquisition of a Costa Rican real estate consultancy.
9. What pricing options are available for accessing the report?
Pricing options include single-user, multi-user, and enterprise licenses priced at USD 4750, USD 5250, and USD 8750 respectively.
10. Is the market size provided in terms of value or volume?
The market size is provided in terms of value, measured in Million.
11. Are there any specific market keywords associated with the report?
Yes, the market keyword associated with the report is "Commercial Real Estate Market," which aids in identifying and referencing the specific market segment covered.
12. How do I determine which pricing option suits my needs best?
The pricing options vary based on user requirements and access needs. Individual users may opt for single-user licenses, while businesses requiring broader access may choose multi-user or enterprise licenses for cost-effective access to the report.
13. Are there any additional resources or data provided in the Commercial Real Estate Market report?
While the report offers comprehensive insights, it's advisable to review the specific contents or supplementary materials provided to ascertain if additional resources or data are available.
14. How can I stay updated on further developments or reports in the Commercial Real Estate Market?
To stay informed about further developments, trends, and reports in the Commercial Real Estate Market, consider subscribing to industry newsletters, following relevant companies and organizations, or regularly checking reputable industry news sources and publications.
Methodology
Step 1 - Identification of Relevant Samples Size from Population Database


Step 2 - Approaches for Defining Global Market Size (Value, Volume* & Price*)

Note*: In applicable scenarios
Step 3 - Data Sources
Primary Research
- Web Analytics
- Survey Reports
- Research Institute
- Latest Research Reports
- Opinion Leaders
Secondary Research
- Annual Reports
- White Paper
- Latest Press Release
- Industry Association
- Paid Database
- Investor Presentations

Step 4 - Data Triangulation
Involves using different sources of information in order to increase the validity of a study
These sources are likely to be stakeholders in a program - participants, other researchers, program staff, other community members, and so on.
Then we put all data in single framework & apply various statistical tools to find out the dynamic on the market.
During the analysis stage, feedback from the stakeholder groups would be compared to determine areas of agreement as well as areas of divergence


