
Key Insights
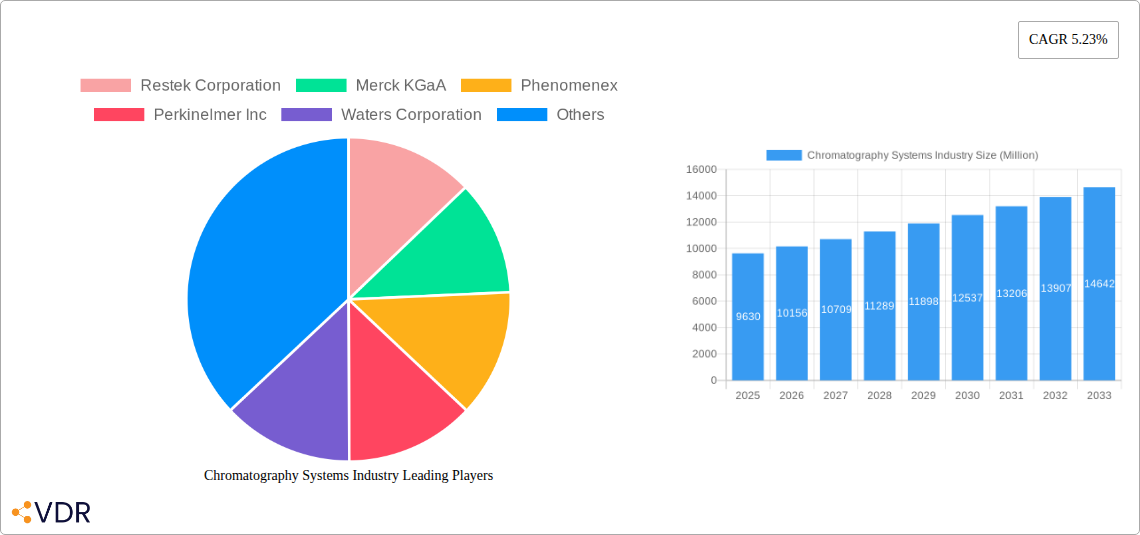
The global chromatography systems market, valued at $9.63 billion in 2025, is projected to experience robust growth, driven by a compound annual growth rate (CAGR) of 5.23% from 2025 to 2033. This expansion is fueled by several key factors. The burgeoning pharmaceutical and biotechnology industries are heavily reliant on chromatography for drug discovery, development, and quality control, creating substantial demand. Furthermore, increasing government funding for research and development in areas like environmental monitoring and clinical diagnostics is boosting adoption across diverse sectors. Advances in chromatography techniques, such as the development of more sensitive and efficient systems, coupled with miniaturization and automation, are further enhancing market growth. The growing prevalence of chronic diseases also contributes to the increased demand for sophisticated analytical techniques employed in clinical research, thus driving market expansion. Competition within the industry is intense, with established players like Thermo Fisher Scientific, Agilent Technologies, and Waters Corporation vying for market share alongside emerging innovative companies.
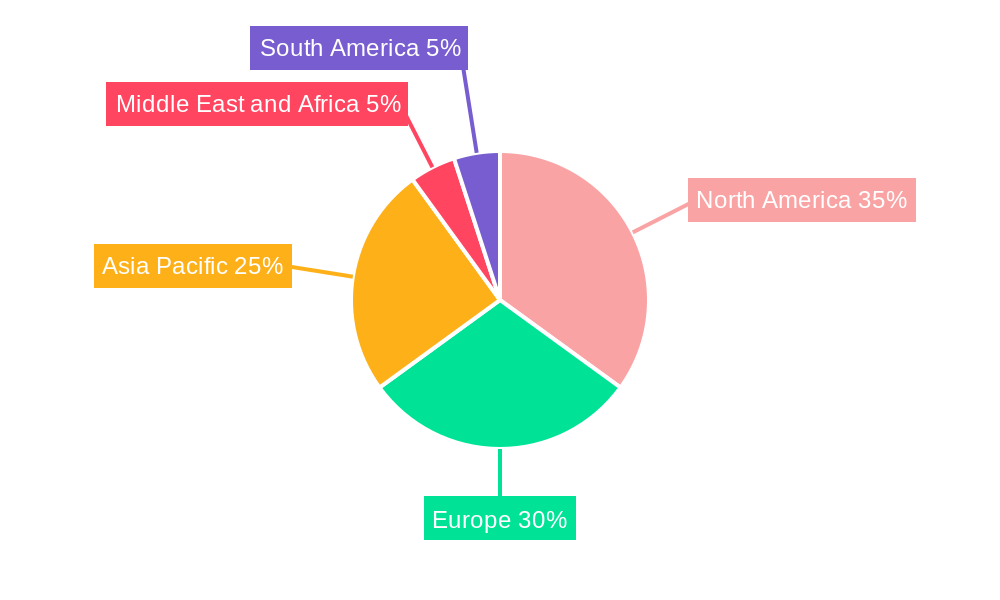
The market segmentation reveals significant opportunities within specific application areas. The pharmaceutical sector constitutes a substantial portion of the market, followed by clinical research organizations and environmental testing. Within the devices segment, chromatography systems are the dominant revenue generators, with consumables and accessories contributing significantly. Geographically, North America and Europe currently hold a substantial market share, owing to the presence of well-established research institutions and pharmaceutical companies. However, the Asia-Pacific region is expected to witness the fastest growth over the forecast period, driven by increasing healthcare spending and rising awareness of advanced analytical techniques. While regulatory hurdles and the high initial investment costs associated with advanced chromatography systems could pose challenges, the overall market outlook remains positive, with considerable growth potential in both established and emerging markets.
Chromatography Systems Industry Market Report: 2019-2033
This comprehensive report provides an in-depth analysis of the Chromatography Systems industry, encompassing market dynamics, growth trends, regional analysis, competitive landscape, and future outlook. The study period covers 2019-2033, with a base year of 2025 and a forecast period of 2025-2033. The report segments the market by device type (Thin Layer Chromatography Systems, Others), consumables/accessories, application (Agriculture, Pharmaceutical Firms, Clinical Research Organizations, Environmental Testing), and geography, offering granular insights for strategic decision-making. The market size is valued in million units.
Chromatography Systems Industry Market Dynamics & Structure
The Chromatography Systems market, valued at $XX million in 2025, is characterized by moderate concentration, with key players such as Thermo Fisher Scientific, Agilent Technologies, and Waters Corporation holding significant market share. Technological innovation, particularly in high-performance liquid chromatography (HPLC) and gas chromatography (GC), is a primary driver. Stringent regulatory frameworks, particularly within pharmaceutical and environmental testing, influence market growth. Competitive substitutes, such as mass spectrometry, exist, but chromatography remains dominant due to its versatility and cost-effectiveness. The end-user demographics are diverse, spanning research institutions, pharmaceutical and biotechnology companies, environmental agencies, and food and beverage manufacturers. M&A activity in the sector has been moderate, with xx deals recorded between 2019 and 2024, primarily focused on expanding product portfolios and geographic reach.
- Market Concentration: Moderately concentrated, with top 5 players holding approximately xx% market share in 2025.
- Technological Innovation: HPLC and GC advancements, miniaturization, and automation are key drivers.
- Regulatory Framework: Stringent regulations in pharmaceuticals and environmental testing drive demand for high-quality systems.
- Competitive Substitutes: Mass spectrometry presents a competitive alternative in specific applications.
- End-User Demographics: Diverse, including research institutions, pharmaceutical firms, and environmental agencies.
- M&A Activity: xx deals between 2019 and 2024, focused on portfolio expansion and geographic reach.
Chromatography Systems Industry Growth Trends & Insights
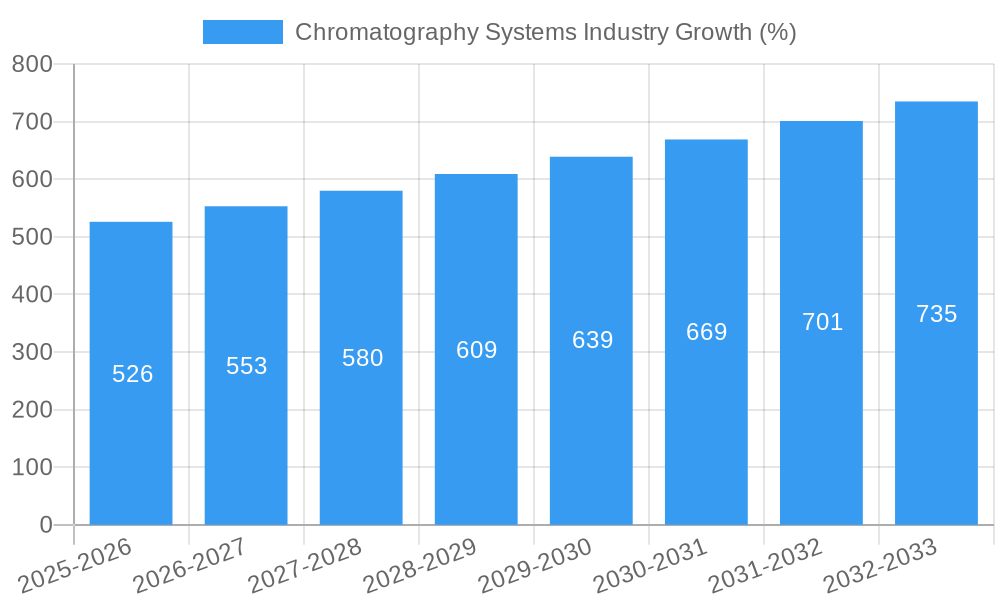
The Chromatography Systems market experienced a CAGR of xx% during the historical period (2019-2024), driven by increasing research and development activities, growing demand from pharmaceutical and biotechnology industries, and rising environmental regulations. The market is expected to maintain a healthy CAGR of xx% during the forecast period (2025-2033). Adoption rates are particularly high in developed regions with advanced research infrastructure. Technological disruptions, such as the integration of artificial intelligence and machine learning, are enhancing system performance and efficiency. Shifting consumer behavior towards automation and high-throughput analysis is boosting demand for sophisticated chromatography systems. Market penetration is expected to increase in emerging economies as research capabilities expand.
Dominant Regions, Countries, or Segments in Chromatography Systems Industry
North America currently holds the largest market share in the Chromatography Systems industry, followed by Europe and Asia Pacific. The dominance is attributed to a robust research infrastructure, high healthcare spending, and a large pharmaceutical and biotechnology industry. Within the segments, the Pharmaceutical Firms application segment exhibits the highest growth rate, driven by the stringent quality control requirements in drug development and manufacturing. The consumables segment within Thin Layer Chromatography Systems demonstrates significant growth potential due to recurring revenue streams.
- Key Drivers:
- Strong R&D investment in North America and Europe.
- High healthcare spending.
- Stringent regulatory frameworks.
- Growing pharmaceutical and biotechnology industries.
- Increasing environmental awareness.
- Dominant Segments: Pharmaceutical Firms application and Thin Layer Chromatography Consumables.
- Growth Potential: Emerging economies offer significant growth opportunities.
Chromatography Systems Industry Product Landscape
The Chromatography Systems market offers a diverse range of products, including HPLC, GC, and Thin Layer Chromatography (TLC) systems. Recent innovations include integrated software for data analysis, automated sample handling, and improved detection capabilities. Unique selling propositions often involve enhanced sensitivity, resolution, and speed of analysis. Technological advancements are focused on miniaturization, portability, and cost-effectiveness, driving market expansion into new application areas.
Key Drivers, Barriers & Challenges in Chromatography Systems Industry
Key Drivers: Increased R&D spending in pharmaceuticals and biotechnology, stringent regulatory requirements for quality control, growing demand for environmental monitoring, and technological advancements driving enhanced system performance.
Key Challenges: High initial investment costs, complex operation and maintenance requirements, and potential supply chain disruptions for specialized components. Competition from alternative analytical techniques also poses a challenge. Regulatory hurdles in certain regions might impact market growth and the cost of compliance.
Emerging Opportunities in Chromatography Systems Industry
Emerging opportunities include the expansion into new application areas, such as proteomics and metabolomics, and the development of portable and point-of-care chromatography systems. The integration of AI and machine learning to improve data analysis and automation capabilities also presents significant growth potential. Untapped markets in developing economies offer considerable growth potential as research capabilities expand.
Growth Accelerators in the Chromatography Systems Industry
Technological breakthroughs in detection technologies, miniaturization, and automation are accelerating market growth. Strategic partnerships and collaborations between instrument manufacturers and software developers are enhancing the capabilities of chromatography systems. Market expansion strategies targeting emerging economies are driving adoption and market penetration.
Key Players Shaping the Chromatography Systems Industry Market
- Restek Corporation
- Merck KGaA
- Phenomenex
- Perkinelmer Inc
- Waters Corporation
- Cytiva
- Sartorius AG
- Bio-Rad Laboratories
- Gilson Inc
- Thermo Fisher Scientific
- Agilent Technologies
- Shimadzu Corporation
Notable Milestones in Chromatography Systems Industry Sector
- 2020, Q3: Agilent Technologies launched a new HPLC system with enhanced sensitivity.
- 2021, Q1: Waters Corporation acquired a smaller chromatography company, expanding its product portfolio.
- 2022, Q4: Thermo Fisher Scientific announced a strategic partnership to develop AI-powered chromatography software.
- (Further milestones to be added based on data)
In-Depth Chromatography Systems Industry Market Outlook
The Chromatography Systems market is poised for robust growth over the forecast period, driven by ongoing technological innovation, increasing demand from various end-use sectors, and expansion into emerging markets. Strategic opportunities exist for companies focused on developing innovative systems with enhanced performance, automation, and user-friendly interfaces. The integration of AI and machine learning will further enhance data analysis and system efficiency, propelling market expansion and adoption across diverse applications.
Chromatography Systems Industry Segmentation
-
1. Devices
-
1.1. By Chromatography Systems
- 1.1.1. Gas Chromatography Systems
- 1.1.2. Liquid Chromatography Systems
- 1.1.3. Fluid Chromatography Systems
- 1.1.4. Thin Layer Chromatography Systems
-
1.2. By Consumables
- 1.2.1. Columns
- 1.2.2. Solvents/Reagents/Adsorbents
- 1.2.3. Syringes/Needles
- 1.2.4. Others
-
1.3. By Accessories
- 1.3.1. Column Accessories
- 1.3.2. Auto-Sampler Accessories
- 1.3.3. Pumps
- 1.3.4. Other Accessories
-
1.1. By Chromatography Systems
-
2. Application
- 2.1. Agriculture
- 2.2. Pharmaceutical Firms
- 2.3. Clinical Research Organizations
- 2.4. Environmental Testing
Chromatography Systems Industry Segmentation By Geography
-
1. North America
- 1.1. United States
- 1.2. Canada
- 1.3. Mexico
-
2. Europe
- 2.1. Germany
- 2.2. United Kingdom
- 2.3. France
- 2.4. Italy
- 2.5. Spain
- 2.6. Rest of Europe
-
3. Asia Pacific
- 3.1. China
- 3.2. Japan
- 3.3. India
- 3.4. Australia
- 3.5. South Korea
- 3.6. Rest of Asia Pacific
-
4. Middle East and Africa
- 4.1. GCC
- 4.2. South Africa
- 4.3. Rest of Middle East and Africa
-
5. South America
- 5.1. Brazil
- 5.2. Argentina
- 5.3. Rest of South America
Chromatography Systems Industry REPORT HIGHLIGHTS
| Aspects | Details |
|---|---|
| Study Period | 2019-2033 |
| Base Year | 2024 |
| Estimated Year | 2025 |
| Forecast Period | 2025-2033 |
| Historical Period | 2019-2024 |
| Growth Rate | CAGR of 5.23% from 2019-2033 |
| Segmentation |
|
Table of Contents
- 1. Introduction
- 1.1. Research Scope
- 1.2. Market Segmentation
- 1.3. Research Methodology
- 1.4. Definitions and Assumptions
- 2. Executive Summary
- 2.1. Introduction
- 3. Market Dynamics
- 3.1. Introduction
- 3.2. Market Drivers
- 3.2.1. Chromatography Tests in Drug Approval Process; Advancements in Chromatography Equipment; Growing Food Safety Concerns
- 3.3. Market Restrains
- 3.3.1. High Equipment Costs; Lack of Skilled Personnel for Equipment Handling
- 3.4. Market Trends
- 3.4.1. Liquid Chromatography Systems are Expected to Dominate the Chromatography Instrumentation Market
- 4. Market Factor Analysis
- 4.1. Porters Five Forces
- 4.2. Supply/Value Chain
- 4.3. PESTEL analysis
- 4.4. Market Entropy
- 4.5. Patent/Trademark Analysis
- 5. Global Chromatography Systems Industry Analysis, Insights and Forecast, 2019-2031
- 5.1. Market Analysis, Insights and Forecast - by Devices
- 5.1.1. By Chromatography Systems
- 5.1.1.1. Gas Chromatography Systems
- 5.1.1.2. Liquid Chromatography Systems
- 5.1.1.3. Fluid Chromatography Systems
- 5.1.1.4. Thin Layer Chromatography Systems
- 5.1.2. By Consumables
- 5.1.2.1. Columns
- 5.1.2.2. Solvents/Reagents/Adsorbents
- 5.1.2.3. Syringes/Needles
- 5.1.2.4. Others
- 5.1.3. By Accessories
- 5.1.3.1. Column Accessories
- 5.1.3.2. Auto-Sampler Accessories
- 5.1.3.3. Pumps
- 5.1.3.4. Other Accessories
- 5.1.1. By Chromatography Systems
- 5.2. Market Analysis, Insights and Forecast - by Application
- 5.2.1. Agriculture
- 5.2.2. Pharmaceutical Firms
- 5.2.3. Clinical Research Organizations
- 5.2.4. Environmental Testing
- 5.3. Market Analysis, Insights and Forecast - by Region
- 5.3.1. North America
- 5.3.2. Europe
- 5.3.3. Asia Pacific
- 5.3.4. Middle East and Africa
- 5.3.5. South America
- 5.1. Market Analysis, Insights and Forecast - by Devices
- 6. North America Chromatography Systems Industry Analysis, Insights and Forecast, 2019-2031
- 6.1. Market Analysis, Insights and Forecast - by Devices
- 6.1.1. By Chromatography Systems
- 6.1.1.1. Gas Chromatography Systems
- 6.1.1.2. Liquid Chromatography Systems
- 6.1.1.3. Fluid Chromatography Systems
- 6.1.1.4. Thin Layer Chromatography Systems
- 6.1.2. By Consumables
- 6.1.2.1. Columns
- 6.1.2.2. Solvents/Reagents/Adsorbents
- 6.1.2.3. Syringes/Needles
- 6.1.2.4. Others
- 6.1.3. By Accessories
- 6.1.3.1. Column Accessories
- 6.1.3.2. Auto-Sampler Accessories
- 6.1.3.3. Pumps
- 6.1.3.4. Other Accessories
- 6.1.1. By Chromatography Systems
- 6.2. Market Analysis, Insights and Forecast - by Application
- 6.2.1. Agriculture
- 6.2.2. Pharmaceutical Firms
- 6.2.3. Clinical Research Organizations
- 6.2.4. Environmental Testing
- 6.1. Market Analysis, Insights and Forecast - by Devices
- 7. Europe Chromatography Systems Industry Analysis, Insights and Forecast, 2019-2031
- 7.1. Market Analysis, Insights and Forecast - by Devices
- 7.1.1. By Chromatography Systems
- 7.1.1.1. Gas Chromatography Systems
- 7.1.1.2. Liquid Chromatography Systems
- 7.1.1.3. Fluid Chromatography Systems
- 7.1.1.4. Thin Layer Chromatography Systems
- 7.1.2. By Consumables
- 7.1.2.1. Columns
- 7.1.2.2. Solvents/Reagents/Adsorbents
- 7.1.2.3. Syringes/Needles
- 7.1.2.4. Others
- 7.1.3. By Accessories
- 7.1.3.1. Column Accessories
- 7.1.3.2. Auto-Sampler Accessories
- 7.1.3.3. Pumps
- 7.1.3.4. Other Accessories
- 7.1.1. By Chromatography Systems
- 7.2. Market Analysis, Insights and Forecast - by Application
- 7.2.1. Agriculture
- 7.2.2. Pharmaceutical Firms
- 7.2.3. Clinical Research Organizations
- 7.2.4. Environmental Testing
- 7.1. Market Analysis, Insights and Forecast - by Devices
- 8. Asia Pacific Chromatography Systems Industry Analysis, Insights and Forecast, 2019-2031
- 8.1. Market Analysis, Insights and Forecast - by Devices
- 8.1.1. By Chromatography Systems
- 8.1.1.1. Gas Chromatography Systems
- 8.1.1.2. Liquid Chromatography Systems
- 8.1.1.3. Fluid Chromatography Systems
- 8.1.1.4. Thin Layer Chromatography Systems
- 8.1.2. By Consumables
- 8.1.2.1. Columns
- 8.1.2.2. Solvents/Reagents/Adsorbents
- 8.1.2.3. Syringes/Needles
- 8.1.2.4. Others
- 8.1.3. By Accessories
- 8.1.3.1. Column Accessories
- 8.1.3.2. Auto-Sampler Accessories
- 8.1.3.3. Pumps
- 8.1.3.4. Other Accessories
- 8.1.1. By Chromatography Systems
- 8.2. Market Analysis, Insights and Forecast - by Application
- 8.2.1. Agriculture
- 8.2.2. Pharmaceutical Firms
- 8.2.3. Clinical Research Organizations
- 8.2.4. Environmental Testing
- 8.1. Market Analysis, Insights and Forecast - by Devices
- 9. Middle East and Africa Chromatography Systems Industry Analysis, Insights and Forecast, 2019-2031
- 9.1. Market Analysis, Insights and Forecast - by Devices
- 9.1.1. By Chromatography Systems
- 9.1.1.1. Gas Chromatography Systems
- 9.1.1.2. Liquid Chromatography Systems
- 9.1.1.3. Fluid Chromatography Systems
- 9.1.1.4. Thin Layer Chromatography Systems
- 9.1.2. By Consumables
- 9.1.2.1. Columns
- 9.1.2.2. Solvents/Reagents/Adsorbents
- 9.1.2.3. Syringes/Needles
- 9.1.2.4. Others
- 9.1.3. By Accessories
- 9.1.3.1. Column Accessories
- 9.1.3.2. Auto-Sampler Accessories
- 9.1.3.3. Pumps
- 9.1.3.4. Other Accessories
- 9.1.1. By Chromatography Systems
- 9.2. Market Analysis, Insights and Forecast - by Application
- 9.2.1. Agriculture
- 9.2.2. Pharmaceutical Firms
- 9.2.3. Clinical Research Organizations
- 9.2.4. Environmental Testing
- 9.1. Market Analysis, Insights and Forecast - by Devices
- 10. South America Chromatography Systems Industry Analysis, Insights and Forecast, 2019-2031
- 10.1. Market Analysis, Insights and Forecast - by Devices
- 10.1.1. By Chromatography Systems
- 10.1.1.1. Gas Chromatography Systems
- 10.1.1.2. Liquid Chromatography Systems
- 10.1.1.3. Fluid Chromatography Systems
- 10.1.1.4. Thin Layer Chromatography Systems
- 10.1.2. By Consumables
- 10.1.2.1. Columns
- 10.1.2.2. Solvents/Reagents/Adsorbents
- 10.1.2.3. Syringes/Needles
- 10.1.2.4. Others
- 10.1.3. By Accessories
- 10.1.3.1. Column Accessories
- 10.1.3.2. Auto-Sampler Accessories
- 10.1.3.3. Pumps
- 10.1.3.4. Other Accessories
- 10.1.1. By Chromatography Systems
- 10.2. Market Analysis, Insights and Forecast - by Application
- 10.2.1. Agriculture
- 10.2.2. Pharmaceutical Firms
- 10.2.3. Clinical Research Organizations
- 10.2.4. Environmental Testing
- 10.1. Market Analysis, Insights and Forecast - by Devices
- 11. North America Chromatography Systems Industry Analysis, Insights and Forecast, 2019-2031
- 11.1. Market Analysis, Insights and Forecast - By Country/Sub-region
- 11.1.1 United States
- 11.1.2 Canada
- 11.1.3 Mexico
- 12. Europe Chromatography Systems Industry Analysis, Insights and Forecast, 2019-2031
- 12.1. Market Analysis, Insights and Forecast - By Country/Sub-region
- 12.1.1 Germany
- 12.1.2 United Kingdom
- 12.1.3 France
- 12.1.4 Italy
- 12.1.5 Spain
- 12.1.6 Rest of Europe
- 13. Asia Pacific Chromatography Systems Industry Analysis, Insights and Forecast, 2019-2031
- 13.1. Market Analysis, Insights and Forecast - By Country/Sub-region
- 13.1.1 China
- 13.1.2 Japan
- 13.1.3 India
- 13.1.4 Australia
- 13.1.5 South Korea
- 13.1.6 Rest of Asia Pacific
- 14. Middle East and Africa Chromatography Systems Industry Analysis, Insights and Forecast, 2019-2031
- 14.1. Market Analysis, Insights and Forecast - By Country/Sub-region
- 14.1.1 GCC
- 14.1.2 South Africa
- 14.1.3 Rest of Middle East and Africa
- 15. South America Chromatography Systems Industry Analysis, Insights and Forecast, 2019-2031
- 15.1. Market Analysis, Insights and Forecast - By Country/Sub-region
- 15.1.1 Brazil
- 15.1.2 Argentina
- 15.1.3 Rest of South America
- 16. Competitive Analysis
- 16.1. Global Market Share Analysis 2024
- 16.2. Company Profiles
- 16.2.1 Restek Corporation
- 16.2.1.1. Overview
- 16.2.1.2. Products
- 16.2.1.3. SWOT Analysis
- 16.2.1.4. Recent Developments
- 16.2.1.5. Financials (Based on Availability)
- 16.2.2 Merck KGaA
- 16.2.2.1. Overview
- 16.2.2.2. Products
- 16.2.2.3. SWOT Analysis
- 16.2.2.4. Recent Developments
- 16.2.2.5. Financials (Based on Availability)
- 16.2.3 Phenomenex
- 16.2.3.1. Overview
- 16.2.3.2. Products
- 16.2.3.3. SWOT Analysis
- 16.2.3.4. Recent Developments
- 16.2.3.5. Financials (Based on Availability)
- 16.2.4 Perkinelmer Inc
- 16.2.4.1. Overview
- 16.2.4.2. Products
- 16.2.4.3. SWOT Analysis
- 16.2.4.4. Recent Developments
- 16.2.4.5. Financials (Based on Availability)
- 16.2.5 Waters Corporation
- 16.2.5.1. Overview
- 16.2.5.2. Products
- 16.2.5.3. SWOT Analysis
- 16.2.5.4. Recent Developments
- 16.2.5.5. Financials (Based on Availability)
- 16.2.6 Cytiva
- 16.2.6.1. Overview
- 16.2.6.2. Products
- 16.2.6.3. SWOT Analysis
- 16.2.6.4. Recent Developments
- 16.2.6.5. Financials (Based on Availability)
- 16.2.7 Sartorius AG
- 16.2.7.1. Overview
- 16.2.7.2. Products
- 16.2.7.3. SWOT Analysis
- 16.2.7.4. Recent Developments
- 16.2.7.5. Financials (Based on Availability)
- 16.2.8 Bio-Rad Laboratories
- 16.2.8.1. Overview
- 16.2.8.2. Products
- 16.2.8.3. SWOT Analysis
- 16.2.8.4. Recent Developments
- 16.2.8.5. Financials (Based on Availability)
- 16.2.9 Gilson Inc
- 16.2.9.1. Overview
- 16.2.9.2. Products
- 16.2.9.3. SWOT Analysis
- 16.2.9.4. Recent Developments
- 16.2.9.5. Financials (Based on Availability)
- 16.2.10 Thermo Fisher Scientific
- 16.2.10.1. Overview
- 16.2.10.2. Products
- 16.2.10.3. SWOT Analysis
- 16.2.10.4. Recent Developments
- 16.2.10.5. Financials (Based on Availability)
- 16.2.11 Agilent Technologies
- 16.2.11.1. Overview
- 16.2.11.2. Products
- 16.2.11.3. SWOT Analysis
- 16.2.11.4. Recent Developments
- 16.2.11.5. Financials (Based on Availability)
- 16.2.12 Shimadzu Corporation
- 16.2.12.1. Overview
- 16.2.12.2. Products
- 16.2.12.3. SWOT Analysis
- 16.2.12.4. Recent Developments
- 16.2.12.5. Financials (Based on Availability)
- 16.2.1 Restek Corporation
List of Figures
- Figure 1: Global Chromatography Systems Industry Revenue Breakdown (Million, %) by Region 2024 & 2032
- Figure 2: Global Chromatography Systems Industry Volume Breakdown (K Unit, %) by Region 2024 & 2032
- Figure 3: North America Chromatography Systems Industry Revenue (Million), by Country 2024 & 2032
- Figure 4: North America Chromatography Systems Industry Volume (K Unit), by Country 2024 & 2032
- Figure 5: North America Chromatography Systems Industry Revenue Share (%), by Country 2024 & 2032
- Figure 6: North America Chromatography Systems Industry Volume Share (%), by Country 2024 & 2032
- Figure 7: Europe Chromatography Systems Industry Revenue (Million), by Country 2024 & 2032
- Figure 8: Europe Chromatography Systems Industry Volume (K Unit), by Country 2024 & 2032
- Figure 9: Europe Chromatography Systems Industry Revenue Share (%), by Country 2024 & 2032
- Figure 10: Europe Chromatography Systems Industry Volume Share (%), by Country 2024 & 2032
- Figure 11: Asia Pacific Chromatography Systems Industry Revenue (Million), by Country 2024 & 2032
- Figure 12: Asia Pacific Chromatography Systems Industry Volume (K Unit), by Country 2024 & 2032
- Figure 13: Asia Pacific Chromatography Systems Industry Revenue Share (%), by Country 2024 & 2032
- Figure 14: Asia Pacific Chromatography Systems Industry Volume Share (%), by Country 2024 & 2032
- Figure 15: Middle East and Africa Chromatography Systems Industry Revenue (Million), by Country 2024 & 2032
- Figure 16: Middle East and Africa Chromatography Systems Industry Volume (K Unit), by Country 2024 & 2032
- Figure 17: Middle East and Africa Chromatography Systems Industry Revenue Share (%), by Country 2024 & 2032
- Figure 18: Middle East and Africa Chromatography Systems Industry Volume Share (%), by Country 2024 & 2032
- Figure 19: South America Chromatography Systems Industry Revenue (Million), by Country 2024 & 2032
- Figure 20: South America Chromatography Systems Industry Volume (K Unit), by Country 2024 & 2032
- Figure 21: South America Chromatography Systems Industry Revenue Share (%), by Country 2024 & 2032
- Figure 22: South America Chromatography Systems Industry Volume Share (%), by Country 2024 & 2032
- Figure 23: North America Chromatography Systems Industry Revenue (Million), by Devices 2024 & 2032
- Figure 24: North America Chromatography Systems Industry Volume (K Unit), by Devices 2024 & 2032
- Figure 25: North America Chromatography Systems Industry Revenue Share (%), by Devices 2024 & 2032
- Figure 26: North America Chromatography Systems Industry Volume Share (%), by Devices 2024 & 2032
- Figure 27: North America Chromatography Systems Industry Revenue (Million), by Application 2024 & 2032
- Figure 28: North America Chromatography Systems Industry Volume (K Unit), by Application 2024 & 2032
- Figure 29: North America Chromatography Systems Industry Revenue Share (%), by Application 2024 & 2032
- Figure 30: North America Chromatography Systems Industry Volume Share (%), by Application 2024 & 2032
- Figure 31: North America Chromatography Systems Industry Revenue (Million), by Country 2024 & 2032
- Figure 32: North America Chromatography Systems Industry Volume (K Unit), by Country 2024 & 2032
- Figure 33: North America Chromatography Systems Industry Revenue Share (%), by Country 2024 & 2032
- Figure 34: North America Chromatography Systems Industry Volume Share (%), by Country 2024 & 2032
- Figure 35: Europe Chromatography Systems Industry Revenue (Million), by Devices 2024 & 2032
- Figure 36: Europe Chromatography Systems Industry Volume (K Unit), by Devices 2024 & 2032
- Figure 37: Europe Chromatography Systems Industry Revenue Share (%), by Devices 2024 & 2032
- Figure 38: Europe Chromatography Systems Industry Volume Share (%), by Devices 2024 & 2032
- Figure 39: Europe Chromatography Systems Industry Revenue (Million), by Application 2024 & 2032
- Figure 40: Europe Chromatography Systems Industry Volume (K Unit), by Application 2024 & 2032
- Figure 41: Europe Chromatography Systems Industry Revenue Share (%), by Application 2024 & 2032
- Figure 42: Europe Chromatography Systems Industry Volume Share (%), by Application 2024 & 2032
- Figure 43: Europe Chromatography Systems Industry Revenue (Million), by Country 2024 & 2032
- Figure 44: Europe Chromatography Systems Industry Volume (K Unit), by Country 2024 & 2032
- Figure 45: Europe Chromatography Systems Industry Revenue Share (%), by Country 2024 & 2032
- Figure 46: Europe Chromatography Systems Industry Volume Share (%), by Country 2024 & 2032
- Figure 47: Asia Pacific Chromatography Systems Industry Revenue (Million), by Devices 2024 & 2032
- Figure 48: Asia Pacific Chromatography Systems Industry Volume (K Unit), by Devices 2024 & 2032
- Figure 49: Asia Pacific Chromatography Systems Industry Revenue Share (%), by Devices 2024 & 2032
- Figure 50: Asia Pacific Chromatography Systems Industry Volume Share (%), by Devices 2024 & 2032
- Figure 51: Asia Pacific Chromatography Systems Industry Revenue (Million), by Application 2024 & 2032
- Figure 52: Asia Pacific Chromatography Systems Industry Volume (K Unit), by Application 2024 & 2032
- Figure 53: Asia Pacific Chromatography Systems Industry Revenue Share (%), by Application 2024 & 2032
- Figure 54: Asia Pacific Chromatography Systems Industry Volume Share (%), by Application 2024 & 2032
- Figure 55: Asia Pacific Chromatography Systems Industry Revenue (Million), by Country 2024 & 2032
- Figure 56: Asia Pacific Chromatography Systems Industry Volume (K Unit), by Country 2024 & 2032
- Figure 57: Asia Pacific Chromatography Systems Industry Revenue Share (%), by Country 2024 & 2032
- Figure 58: Asia Pacific Chromatography Systems Industry Volume Share (%), by Country 2024 & 2032
- Figure 59: Middle East and Africa Chromatography Systems Industry Revenue (Million), by Devices 2024 & 2032
- Figure 60: Middle East and Africa Chromatography Systems Industry Volume (K Unit), by Devices 2024 & 2032
- Figure 61: Middle East and Africa Chromatography Systems Industry Revenue Share (%), by Devices 2024 & 2032
- Figure 62: Middle East and Africa Chromatography Systems Industry Volume Share (%), by Devices 2024 & 2032
- Figure 63: Middle East and Africa Chromatography Systems Industry Revenue (Million), by Application 2024 & 2032
- Figure 64: Middle East and Africa Chromatography Systems Industry Volume (K Unit), by Application 2024 & 2032
- Figure 65: Middle East and Africa Chromatography Systems Industry Revenue Share (%), by Application 2024 & 2032
- Figure 66: Middle East and Africa Chromatography Systems Industry Volume Share (%), by Application 2024 & 2032
- Figure 67: Middle East and Africa Chromatography Systems Industry Revenue (Million), by Country 2024 & 2032
- Figure 68: Middle East and Africa Chromatography Systems Industry Volume (K Unit), by Country 2024 & 2032
- Figure 69: Middle East and Africa Chromatography Systems Industry Revenue Share (%), by Country 2024 & 2032
- Figure 70: Middle East and Africa Chromatography Systems Industry Volume Share (%), by Country 2024 & 2032
- Figure 71: South America Chromatography Systems Industry Revenue (Million), by Devices 2024 & 2032
- Figure 72: South America Chromatography Systems Industry Volume (K Unit), by Devices 2024 & 2032
- Figure 73: South America Chromatography Systems Industry Revenue Share (%), by Devices 2024 & 2032
- Figure 74: South America Chromatography Systems Industry Volume Share (%), by Devices 2024 & 2032
- Figure 75: South America Chromatography Systems Industry Revenue (Million), by Application 2024 & 2032
- Figure 76: South America Chromatography Systems Industry Volume (K Unit), by Application 2024 & 2032
- Figure 77: South America Chromatography Systems Industry Revenue Share (%), by Application 2024 & 2032
- Figure 78: South America Chromatography Systems Industry Volume Share (%), by Application 2024 & 2032
- Figure 79: South America Chromatography Systems Industry Revenue (Million), by Country 2024 & 2032
- Figure 80: South America Chromatography Systems Industry Volume (K Unit), by Country 2024 & 2032
- Figure 81: South America Chromatography Systems Industry Revenue Share (%), by Country 2024 & 2032
- Figure 82: South America Chromatography Systems Industry Volume Share (%), by Country 2024 & 2032
List of Tables
- Table 1: Global Chromatography Systems Industry Revenue Million Forecast, by Region 2019 & 2032
- Table 2: Global Chromatography Systems Industry Volume K Unit Forecast, by Region 2019 & 2032
- Table 3: Global Chromatography Systems Industry Revenue Million Forecast, by Devices 2019 & 2032
- Table 4: Global Chromatography Systems Industry Volume K Unit Forecast, by Devices 2019 & 2032
- Table 5: Global Chromatography Systems Industry Revenue Million Forecast, by Application 2019 & 2032
- Table 6: Global Chromatography Systems Industry Volume K Unit Forecast, by Application 2019 & 2032
- Table 7: Global Chromatography Systems Industry Revenue Million Forecast, by Region 2019 & 2032
- Table 8: Global Chromatography Systems Industry Volume K Unit Forecast, by Region 2019 & 2032
- Table 9: Global Chromatography Systems Industry Revenue Million Forecast, by Country 2019 & 2032
- Table 10: Global Chromatography Systems Industry Volume K Unit Forecast, by Country 2019 & 2032
- Table 11: United States Chromatography Systems Industry Revenue (Million) Forecast, by Application 2019 & 2032
- Table 12: United States Chromatography Systems Industry Volume (K Unit) Forecast, by Application 2019 & 2032
- Table 13: Canada Chromatography Systems Industry Revenue (Million) Forecast, by Application 2019 & 2032
- Table 14: Canada Chromatography Systems Industry Volume (K Unit) Forecast, by Application 2019 & 2032
- Table 15: Mexico Chromatography Systems Industry Revenue (Million) Forecast, by Application 2019 & 2032
- Table 16: Mexico Chromatography Systems Industry Volume (K Unit) Forecast, by Application 2019 & 2032
- Table 17: Global Chromatography Systems Industry Revenue Million Forecast, by Country 2019 & 2032
- Table 18: Global Chromatography Systems Industry Volume K Unit Forecast, by Country 2019 & 2032
- Table 19: Germany Chromatography Systems Industry Revenue (Million) Forecast, by Application 2019 & 2032
- Table 20: Germany Chromatography Systems Industry Volume (K Unit) Forecast, by Application 2019 & 2032
- Table 21: United Kingdom Chromatography Systems Industry Revenue (Million) Forecast, by Application 2019 & 2032
- Table 22: United Kingdom Chromatography Systems Industry Volume (K Unit) Forecast, by Application 2019 & 2032
- Table 23: France Chromatography Systems Industry Revenue (Million) Forecast, by Application 2019 & 2032
- Table 24: France Chromatography Systems Industry Volume (K Unit) Forecast, by Application 2019 & 2032
- Table 25: Italy Chromatography Systems Industry Revenue (Million) Forecast, by Application 2019 & 2032
- Table 26: Italy Chromatography Systems Industry Volume (K Unit) Forecast, by Application 2019 & 2032
- Table 27: Spain Chromatography Systems Industry Revenue (Million) Forecast, by Application 2019 & 2032
- Table 28: Spain Chromatography Systems Industry Volume (K Unit) Forecast, by Application 2019 & 2032
- Table 29: Rest of Europe Chromatography Systems Industry Revenue (Million) Forecast, by Application 2019 & 2032
- Table 30: Rest of Europe Chromatography Systems Industry Volume (K Unit) Forecast, by Application 2019 & 2032
- Table 31: Global Chromatography Systems Industry Revenue Million Forecast, by Country 2019 & 2032
- Table 32: Global Chromatography Systems Industry Volume K Unit Forecast, by Country 2019 & 2032
- Table 33: China Chromatography Systems Industry Revenue (Million) Forecast, by Application 2019 & 2032
- Table 34: China Chromatography Systems Industry Volume (K Unit) Forecast, by Application 2019 & 2032
- Table 35: Japan Chromatography Systems Industry Revenue (Million) Forecast, by Application 2019 & 2032
- Table 36: Japan Chromatography Systems Industry Volume (K Unit) Forecast, by Application 2019 & 2032
- Table 37: India Chromatography Systems Industry Revenue (Million) Forecast, by Application 2019 & 2032
- Table 38: India Chromatography Systems Industry Volume (K Unit) Forecast, by Application 2019 & 2032
- Table 39: Australia Chromatography Systems Industry Revenue (Million) Forecast, by Application 2019 & 2032
- Table 40: Australia Chromatography Systems Industry Volume (K Unit) Forecast, by Application 2019 & 2032
- Table 41: South Korea Chromatography Systems Industry Revenue (Million) Forecast, by Application 2019 & 2032
- Table 42: South Korea Chromatography Systems Industry Volume (K Unit) Forecast, by Application 2019 & 2032
- Table 43: Rest of Asia Pacific Chromatography Systems Industry Revenue (Million) Forecast, by Application 2019 & 2032
- Table 44: Rest of Asia Pacific Chromatography Systems Industry Volume (K Unit) Forecast, by Application 2019 & 2032
- Table 45: Global Chromatography Systems Industry Revenue Million Forecast, by Country 2019 & 2032
- Table 46: Global Chromatography Systems Industry Volume K Unit Forecast, by Country 2019 & 2032
- Table 47: GCC Chromatography Systems Industry Revenue (Million) Forecast, by Application 2019 & 2032
- Table 48: GCC Chromatography Systems Industry Volume (K Unit) Forecast, by Application 2019 & 2032
- Table 49: South Africa Chromatography Systems Industry Revenue (Million) Forecast, by Application 2019 & 2032
- Table 50: South Africa Chromatography Systems Industry Volume (K Unit) Forecast, by Application 2019 & 2032
- Table 51: Rest of Middle East and Africa Chromatography Systems Industry Revenue (Million) Forecast, by Application 2019 & 2032
- Table 52: Rest of Middle East and Africa Chromatography Systems Industry Volume (K Unit) Forecast, by Application 2019 & 2032
- Table 53: Global Chromatography Systems Industry Revenue Million Forecast, by Country 2019 & 2032
- Table 54: Global Chromatography Systems Industry Volume K Unit Forecast, by Country 2019 & 2032
- Table 55: Brazil Chromatography Systems Industry Revenue (Million) Forecast, by Application 2019 & 2032
- Table 56: Brazil Chromatography Systems Industry Volume (K Unit) Forecast, by Application 2019 & 2032
- Table 57: Argentina Chromatography Systems Industry Revenue (Million) Forecast, by Application 2019 & 2032
- Table 58: Argentina Chromatography Systems Industry Volume (K Unit) Forecast, by Application 2019 & 2032
- Table 59: Rest of South America Chromatography Systems Industry Revenue (Million) Forecast, by Application 2019 & 2032
- Table 60: Rest of South America Chromatography Systems Industry Volume (K Unit) Forecast, by Application 2019 & 2032
- Table 61: Global Chromatography Systems Industry Revenue Million Forecast, by Devices 2019 & 2032
- Table 62: Global Chromatography Systems Industry Volume K Unit Forecast, by Devices 2019 & 2032
- Table 63: Global Chromatography Systems Industry Revenue Million Forecast, by Application 2019 & 2032
- Table 64: Global Chromatography Systems Industry Volume K Unit Forecast, by Application 2019 & 2032
- Table 65: Global Chromatography Systems Industry Revenue Million Forecast, by Country 2019 & 2032
- Table 66: Global Chromatography Systems Industry Volume K Unit Forecast, by Country 2019 & 2032
- Table 67: United States Chromatography Systems Industry Revenue (Million) Forecast, by Application 2019 & 2032
- Table 68: United States Chromatography Systems Industry Volume (K Unit) Forecast, by Application 2019 & 2032
- Table 69: Canada Chromatography Systems Industry Revenue (Million) Forecast, by Application 2019 & 2032
- Table 70: Canada Chromatography Systems Industry Volume (K Unit) Forecast, by Application 2019 & 2032
- Table 71: Mexico Chromatography Systems Industry Revenue (Million) Forecast, by Application 2019 & 2032
- Table 72: Mexico Chromatography Systems Industry Volume (K Unit) Forecast, by Application 2019 & 2032
- Table 73: Global Chromatography Systems Industry Revenue Million Forecast, by Devices 2019 & 2032
- Table 74: Global Chromatography Systems Industry Volume K Unit Forecast, by Devices 2019 & 2032
- Table 75: Global Chromatography Systems Industry Revenue Million Forecast, by Application 2019 & 2032
- Table 76: Global Chromatography Systems Industry Volume K Unit Forecast, by Application 2019 & 2032
- Table 77: Global Chromatography Systems Industry Revenue Million Forecast, by Country 2019 & 2032
- Table 78: Global Chromatography Systems Industry Volume K Unit Forecast, by Country 2019 & 2032
- Table 79: Germany Chromatography Systems Industry Revenue (Million) Forecast, by Application 2019 & 2032
- Table 80: Germany Chromatography Systems Industry Volume (K Unit) Forecast, by Application 2019 & 2032
- Table 81: United Kingdom Chromatography Systems Industry Revenue (Million) Forecast, by Application 2019 & 2032
- Table 82: United Kingdom Chromatography Systems Industry Volume (K Unit) Forecast, by Application 2019 & 2032
- Table 83: France Chromatography Systems Industry Revenue (Million) Forecast, by Application 2019 & 2032
- Table 84: France Chromatography Systems Industry Volume (K Unit) Forecast, by Application 2019 & 2032
- Table 85: Italy Chromatography Systems Industry Revenue (Million) Forecast, by Application 2019 & 2032
- Table 86: Italy Chromatography Systems Industry Volume (K Unit) Forecast, by Application 2019 & 2032
- Table 87: Spain Chromatography Systems Industry Revenue (Million) Forecast, by Application 2019 & 2032
- Table 88: Spain Chromatography Systems Industry Volume (K Unit) Forecast, by Application 2019 & 2032
- Table 89: Rest of Europe Chromatography Systems Industry Revenue (Million) Forecast, by Application 2019 & 2032
- Table 90: Rest of Europe Chromatography Systems Industry Volume (K Unit) Forecast, by Application 2019 & 2032
- Table 91: Global Chromatography Systems Industry Revenue Million Forecast, by Devices 2019 & 2032
- Table 92: Global Chromatography Systems Industry Volume K Unit Forecast, by Devices 2019 & 2032
- Table 93: Global Chromatography Systems Industry Revenue Million Forecast, by Application 2019 & 2032
- Table 94: Global Chromatography Systems Industry Volume K Unit Forecast, by Application 2019 & 2032
- Table 95: Global Chromatography Systems Industry Revenue Million Forecast, by Country 2019 & 2032
- Table 96: Global Chromatography Systems Industry Volume K Unit Forecast, by Country 2019 & 2032
- Table 97: China Chromatography Systems Industry Revenue (Million) Forecast, by Application 2019 & 2032
- Table 98: China Chromatography Systems Industry Volume (K Unit) Forecast, by Application 2019 & 2032
- Table 99: Japan Chromatography Systems Industry Revenue (Million) Forecast, by Application 2019 & 2032
- Table 100: Japan Chromatography Systems Industry Volume (K Unit) Forecast, by Application 2019 & 2032
- Table 101: India Chromatography Systems Industry Revenue (Million) Forecast, by Application 2019 & 2032
- Table 102: India Chromatography Systems Industry Volume (K Unit) Forecast, by Application 2019 & 2032
- Table 103: Australia Chromatography Systems Industry Revenue (Million) Forecast, by Application 2019 & 2032
- Table 104: Australia Chromatography Systems Industry Volume (K Unit) Forecast, by Application 2019 & 2032
- Table 105: South Korea Chromatography Systems Industry Revenue (Million) Forecast, by Application 2019 & 2032
- Table 106: South Korea Chromatography Systems Industry Volume (K Unit) Forecast, by Application 2019 & 2032
- Table 107: Rest of Asia Pacific Chromatography Systems Industry Revenue (Million) Forecast, by Application 2019 & 2032
- Table 108: Rest of Asia Pacific Chromatography Systems Industry Volume (K Unit) Forecast, by Application 2019 & 2032
- Table 109: Global Chromatography Systems Industry Revenue Million Forecast, by Devices 2019 & 2032
- Table 110: Global Chromatography Systems Industry Volume K Unit Forecast, by Devices 2019 & 2032
- Table 111: Global Chromatography Systems Industry Revenue Million Forecast, by Application 2019 & 2032
- Table 112: Global Chromatography Systems Industry Volume K Unit Forecast, by Application 2019 & 2032
- Table 113: Global Chromatography Systems Industry Revenue Million Forecast, by Country 2019 & 2032
- Table 114: Global Chromatography Systems Industry Volume K Unit Forecast, by Country 2019 & 2032
- Table 115: GCC Chromatography Systems Industry Revenue (Million) Forecast, by Application 2019 & 2032
- Table 116: GCC Chromatography Systems Industry Volume (K Unit) Forecast, by Application 2019 & 2032
- Table 117: South Africa Chromatography Systems Industry Revenue (Million) Forecast, by Application 2019 & 2032
- Table 118: South Africa Chromatography Systems Industry Volume (K Unit) Forecast, by Application 2019 & 2032
- Table 119: Rest of Middle East and Africa Chromatography Systems Industry Revenue (Million) Forecast, by Application 2019 & 2032
- Table 120: Rest of Middle East and Africa Chromatography Systems Industry Volume (K Unit) Forecast, by Application 2019 & 2032
- Table 121: Global Chromatography Systems Industry Revenue Million Forecast, by Devices 2019 & 2032
- Table 122: Global Chromatography Systems Industry Volume K Unit Forecast, by Devices 2019 & 2032
- Table 123: Global Chromatography Systems Industry Revenue Million Forecast, by Application 2019 & 2032
- Table 124: Global Chromatography Systems Industry Volume K Unit Forecast, by Application 2019 & 2032
- Table 125: Global Chromatography Systems Industry Revenue Million Forecast, by Country 2019 & 2032
- Table 126: Global Chromatography Systems Industry Volume K Unit Forecast, by Country 2019 & 2032
- Table 127: Brazil Chromatography Systems Industry Revenue (Million) Forecast, by Application 2019 & 2032
- Table 128: Brazil Chromatography Systems Industry Volume (K Unit) Forecast, by Application 2019 & 2032
- Table 129: Argentina Chromatography Systems Industry Revenue (Million) Forecast, by Application 2019 & 2032
- Table 130: Argentina Chromatography Systems Industry Volume (K Unit) Forecast, by Application 2019 & 2032
- Table 131: Rest of South America Chromatography Systems Industry Revenue (Million) Forecast, by Application 2019 & 2032
- Table 132: Rest of South America Chromatography Systems Industry Volume (K Unit) Forecast, by Application 2019 & 2032
Frequently Asked Questions
1. What is the projected Compound Annual Growth Rate (CAGR) of the Chromatography Systems Industry?
The projected CAGR is approximately 5.23%.
2. Which companies are prominent players in the Chromatography Systems Industry?
Key companies in the market include Restek Corporation, Merck KGaA, Phenomenex, Perkinelmer Inc, Waters Corporation, Cytiva, Sartorius AG, Bio-Rad Laboratories, Gilson Inc, Thermo Fisher Scientific, Agilent Technologies, Shimadzu Corporation.
3. What are the main segments of the Chromatography Systems Industry?
The market segments include Devices, Application.
4. Can you provide details about the market size?
The market size is estimated to be USD 9.63 Million as of 2022.
5. What are some drivers contributing to market growth?
Chromatography Tests in Drug Approval Process; Advancements in Chromatography Equipment; Growing Food Safety Concerns.
6. What are the notable trends driving market growth?
Liquid Chromatography Systems are Expected to Dominate the Chromatography Instrumentation Market.
7. Are there any restraints impacting market growth?
High Equipment Costs; Lack of Skilled Personnel for Equipment Handling.
8. Can you provide examples of recent developments in the market?
N/A
9. What pricing options are available for accessing the report?
Pricing options include single-user, multi-user, and enterprise licenses priced at USD 4750, USD 5250, and USD 8750 respectively.
10. Is the market size provided in terms of value or volume?
The market size is provided in terms of value, measured in Million and volume, measured in K Unit.
11. Are there any specific market keywords associated with the report?
Yes, the market keyword associated with the report is "Chromatography Systems Industry," which aids in identifying and referencing the specific market segment covered.
12. How do I determine which pricing option suits my needs best?
The pricing options vary based on user requirements and access needs. Individual users may opt for single-user licenses, while businesses requiring broader access may choose multi-user or enterprise licenses for cost-effective access to the report.
13. Are there any additional resources or data provided in the Chromatography Systems Industry report?
While the report offers comprehensive insights, it's advisable to review the specific contents or supplementary materials provided to ascertain if additional resources or data are available.
14. How can I stay updated on further developments or reports in the Chromatography Systems Industry?
To stay informed about further developments, trends, and reports in the Chromatography Systems Industry, consider subscribing to industry newsletters, following relevant companies and organizations, or regularly checking reputable industry news sources and publications.
Methodology
Step 1 - Identification of Relevant Samples Size from Population Database


Step 2 - Approaches for Defining Global Market Size (Value, Volume* & Price*)

Note*: In applicable scenarios
Step 3 - Data Sources
Primary Research
- Web Analytics
- Survey Reports
- Research Institute
- Latest Research Reports
- Opinion Leaders
Secondary Research
- Annual Reports
- White Paper
- Latest Press Release
- Industry Association
- Paid Database
- Investor Presentations

Step 4 - Data Triangulation
Involves using different sources of information in order to increase the validity of a study
These sources are likely to be stakeholders in a program - participants, other researchers, program staff, other community members, and so on.
Then we put all data in single framework & apply various statistical tools to find out the dynamic on the market.
During the analysis stage, feedback from the stakeholder groups would be compared to determine areas of agreement as well as areas of divergence


