
Key Insights
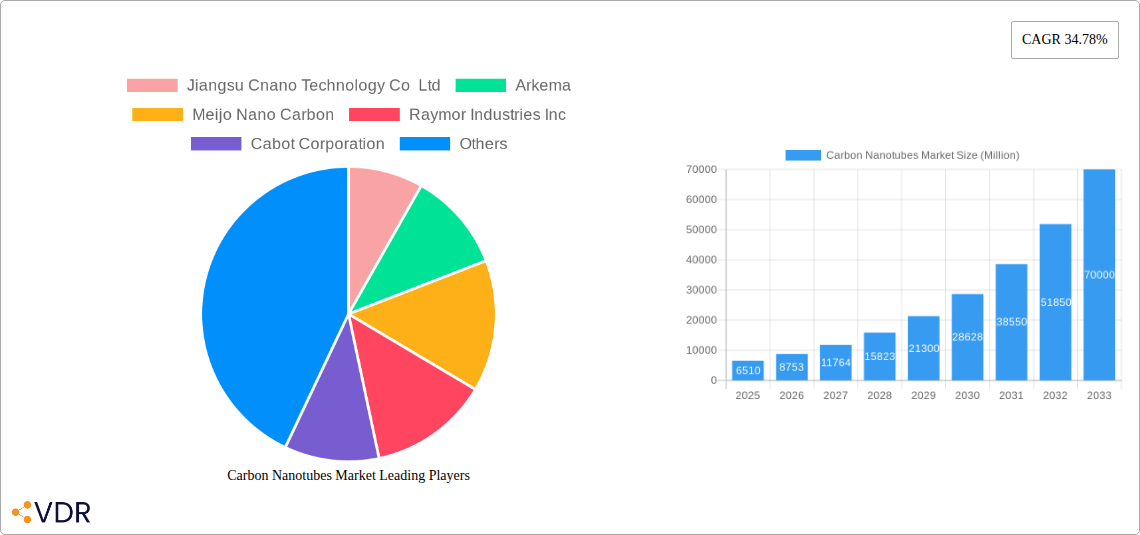
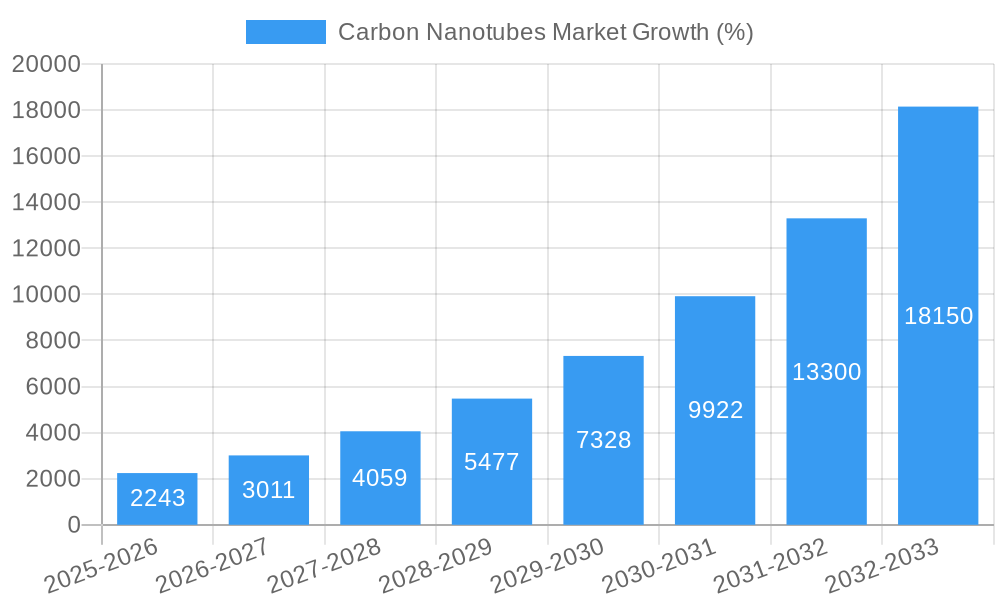
The global carbon nanotubes (CNTs) market is experiencing robust growth, projected to reach $6.51 billion in 2025 and maintain a significant Compound Annual Growth Rate (CAGR) of 34.78% from 2025 to 2033. This expansion is driven by the increasing demand for lightweight, high-strength materials across diverse sectors. The electronics industry, a major consumer, is leveraging CNTs for enhanced conductivity in advanced transistors and flexible displays. Simultaneously, the aerospace and defense industries are exploring CNTs for applications in lightweight composites and high-performance materials, contributing substantially to market growth. The automotive sector is also adopting CNTs for improved battery performance and lightweight vehicle components, further fueling demand. Furthermore, the burgeoning healthcare industry is utilizing CNTs in drug delivery systems and medical imaging, while the energy sector benefits from their application in improved energy storage solutions. Growth is further fueled by ongoing research and development efforts focused on improving CNT synthesis, functionalization, and dispersion techniques, leading to wider applicability and cost reduction.
However, several challenges remain. The high production cost of high-quality CNTs, particularly SWCNTs, is a major restraint. Furthermore, the potential health and environmental risks associated with CNT handling and disposal require thorough investigation and mitigation strategies. Despite these challenges, continuous innovation in manufacturing processes and increasing government support for nanotechnology research are expected to significantly alleviate these issues over the forecast period. The market segmentation reveals that multi-walled carbon nanotubes (MWCNTs) currently hold a larger market share compared to single-walled carbon nanotubes (SWCNTs), owing to their lower cost and established production scale. However, SWCNTs are expected to gain traction in the coming years due to their superior electrical and mechanical properties, driving market diversification. Regional analysis indicates strong growth in the Asia-Pacific region, driven by increasing industrial activity and robust government investments in nanotechnology in countries like China and India.
Carbon Nanotubes Market: A Comprehensive Report (2019-2033)
This in-depth report provides a comprehensive analysis of the Carbon Nanotubes Market, encompassing market dynamics, growth trends, regional dominance, product landscape, key players, and future outlook. The study period spans from 2019 to 2033, with 2025 serving as the base and estimated year. This report is crucial for industry professionals, investors, and researchers seeking to understand and capitalize on the opportunities within this rapidly evolving market. The market is segmented by type (Multi-walled Carbon Nanotubes (MWCNT), Single-walled Carbon Nanotubes (SWCNT), Other Types) and end-user industry (Electronics, Aerospace and Defense, Automotive, Healthcare, Energy, Other End-user Industries).
Carbon Nanotubes Market Dynamics & Structure
The carbon nanotubes (CNT) market is characterized by a moderately consolidated structure, with several major players holding significant market share. Technological innovation, particularly in enhancing CNT production efficiency and functionalization, is a primary driver of market growth. Stringent regulatory frameworks concerning material safety and environmental impact influence market dynamics. Competitive substitutes, such as graphene and other advanced materials, pose a challenge, while the increasing demand from diverse end-user industries fuels market expansion. Mergers and acquisitions (M&A) activity is moderate, reflecting strategic efforts by leading companies to consolidate their position and expand their product portfolios.
- Market Concentration: The top 5 players account for approximately xx% of the global market share in 2025.
- Technological Innovation: Focus is on increasing purity, improving dispersion, and developing specialized functionalized CNTs.
- Regulatory Landscape: Regulations concerning CNT toxicity and environmental impact vary across regions.
- Competitive Substitutes: Graphene and other advanced materials are emerging as potential competitors.
- M&A Activity: xx major M&A deals were recorded in the period 2019-2024, valued at approximately xx million USD.
- End-User Demographics: Strong growth is driven by increasing adoption across electronics, automotive, and energy sectors.
Carbon Nanotubes Market Growth Trends & Insights
The global carbon nanotubes market is experiencing robust growth, driven by increasing demand from various sectors. The market size is projected to reach xx million units by 2025 and is expected to reach xx million units by 2033, exhibiting a Compound Annual Growth Rate (CAGR) of xx% during the forecast period (2025-2033). This growth is fueled by technological advancements enhancing CNT properties, increased adoption in high-growth industries like electronics and energy, and government initiatives promoting the use of nanomaterials in various applications. Market penetration is increasing steadily, with significant adoption in specific applications like conductive inks and composites. Consumer behavior shifts toward sustainable and high-performance materials are also contributing to market growth.
Dominant Regions, Countries, or Segments in Carbon Nanotubes Market
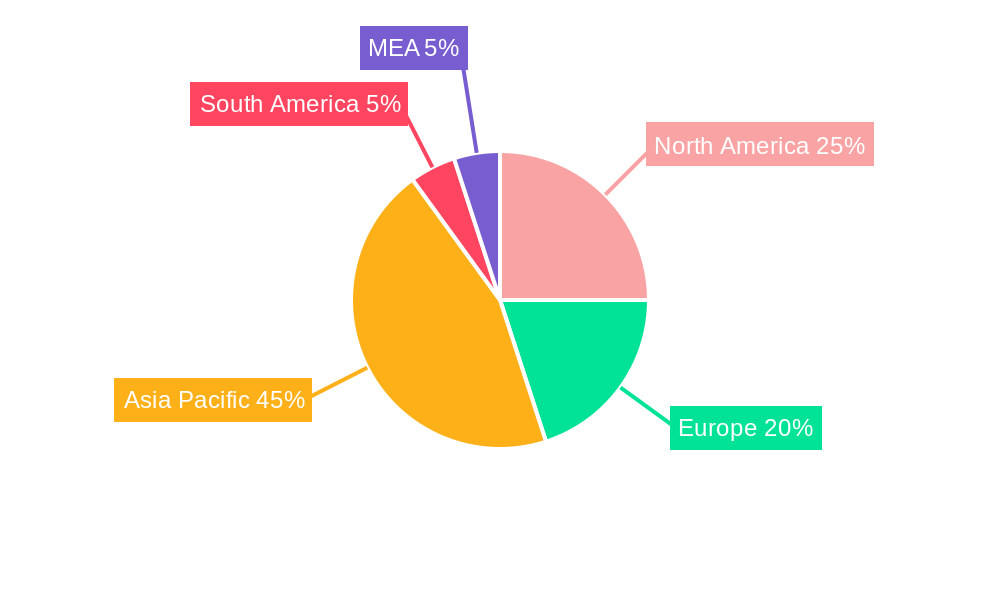
Asia-Pacific is currently the leading region in the carbon nanotubes market, driven by substantial investments in electronics manufacturing, strong government support for nanotechnology research, and a large pool of skilled labor. Within this region, China holds a significant market share, followed by Japan and South Korea. The Electronics sector is the largest end-user segment, accounting for a significant proportion of global demand, followed by the Automotive and Energy sectors. The high demand for lightweight, high-strength materials in automotive and aerospace applications, coupled with the expanding use of CNTs in energy storage systems, drives significant growth in these segments.
- Key Drivers in Asia-Pacific: Rapid growth of the electronics industry, government support for nanotechnology R&D, and increasing investments in infrastructure development.
- Electronics Segment Dominance: Driven by increasing demand for lightweight and high-performance components in consumer electronics and other electronic devices.
- Automotive and Energy Sector Growth: Increasing adoption of CNTs in automotive components and battery systems to improve performance and efficiency.
- Market Share: Asia-Pacific holds xx% market share in 2025, with China at xx%, Japan at xx%, and South Korea at xx%. The Electronics segment accounts for xx% of the total market.
Carbon Nanotubes Market Product Landscape
Carbon nanotubes are available in various forms, including single-walled nanotubes (SWCNTs), multi-walled nanotubes (MWCNTs), and functionalized CNTs. Product innovations focus on improving the purity, dispersion, and functionalization of CNTs to enhance their performance in specific applications. Unique selling propositions (USPs) include high strength-to-weight ratio, excellent electrical and thermal conductivity, and diverse functionalization possibilities. Technological advancements center on scalable production methods, enhancing dispersion techniques, and developing tailored CNT properties for specific applications.
Key Drivers, Barriers & Challenges in Carbon Nanotubes Market
Key Drivers: Growing demand from the electronics and energy sectors, advancements in production technologies leading to reduced costs, and increasing government support for nanotechnology research are key drivers of market growth.
Challenges & Restraints: High production costs, limited availability of high-purity CNTs, potential health and environmental concerns, and the presence of competitive substitute materials pose significant challenges. The lack of standardization and well-defined safety protocols can also hinder wider adoption. Supply chain disruptions can cause price fluctuations, impacting market stability. The estimated impact of these challenges on market growth is xx% reduction in CAGR by 2033.
Emerging Opportunities in Carbon Nanotubes Market
Emerging opportunities include the development of new applications in areas such as biomedical devices, advanced composites, and water purification. Untapped markets in developing economies present significant potential. Innovative applications, such as flexible electronics and next-generation batteries, offer further growth avenues. Evolving consumer preferences toward sustainable and high-performance products will drive demand for CNT-based materials.
Growth Accelerators in the Carbon Nanotubes Market Industry
Technological breakthroughs in scalable and cost-effective CNT production, coupled with strategic partnerships between material suppliers and end-user industries, are major catalysts for long-term growth. Market expansion strategies targeting emerging economies and diversification into new application areas will further accelerate market growth.
Key Players Shaping the Carbon Nanotubes Market Market
- Jiangsu Cnano Technology Co Ltd
- Arkema
- Meijo Nano Carbon
- Raymor Industries Inc
- Cabot Corporation
- Nanocyl SA
- Showa Denko KK (Resonac Holdings Corporation)
- Ocsial
- Hyperion Catalysis International
- LG Chem
- Nano-C
- CHASM
- Chengdu Organic Chemicals Co Ltd (Timesnano)
- Kumho Petrochemical
Notable Milestones in Carbon Nanotubes Market Sector
- May 2023: LG Chem announces construction of its fourth CNT plant in South Korea, doubling its annual production capacity to 6,100 tons by 2025. This significantly increases supply and strengthens LG Chem's market position.
- January 2023: Showa Denko KK and Showa Denko Materials Co., Ltd. merge to form Resonac Holdings Corporation and Resonac Corporation, potentially leading to synergies and increased competitiveness in CNT production and application.
In-Depth Carbon Nanotubes Market Market Outlook
The carbon nanotubes market is poised for significant growth in the coming years, driven by continuous technological advancements, expanding applications, and increasing demand from various sectors. Strategic partnerships and investments in R&D are expected to further accelerate market growth. The market offers attractive opportunities for established players and new entrants alike, particularly in developing innovative applications and expanding into untapped markets. The long-term outlook remains positive, with continued growth predicted through 2033.
Carbon Nanotubes Market Segmentation
-
1. Type
- 1.1. Multi-walled Carbon Nanotubes (MWCNT)
- 1.2. Single-walled Carbon Nanotubes (SWCNT)
- 1.3. Other Ty
-
2. End-user Industry
- 2.1. Electronics
- 2.2. Aerospace and Defense
- 2.3. Automotive
- 2.4. Healthcare
- 2.5. Energy
- 2.6. Other En
Carbon Nanotubes Market Segmentation By Geography
-
1. Asia Pacific
- 1.1. China
- 1.2. India
- 1.3. Japan
- 1.4. South Korea
- 1.5. Rest of Asia Pacific
-
2. North America
- 2.1. United States
- 2.2. Canada
- 2.3. Mexico
-
3. Europe
- 3.1. Germany
- 3.2. United Kingdom
- 3.3. Italy
- 3.4. France
- 3.5. Spain
- 3.6. Rest of Europe
-
4. South America
- 4.1. Brazil
- 4.2. Argentina
- 4.3. Rest of South America
-
5. Middle East and Africa
- 5.1. Saudi Arabia
- 5.2. South Africa
- 5.3. Rest of Middle East and Africa
Carbon Nanotubes Market REPORT HIGHLIGHTS
| Aspects | Details |
|---|---|
| Study Period | 2019-2033 |
| Base Year | 2024 |
| Estimated Year | 2025 |
| Forecast Period | 2025-2033 |
| Historical Period | 2019-2024 |
| Growth Rate | CAGR of 34.78% from 2019-2033 |
| Segmentation |
|
Table of Contents
- 1. Introduction
- 1.1. Research Scope
- 1.2. Market Segmentation
- 1.3. Research Methodology
- 1.4. Definitions and Assumptions
- 2. Executive Summary
- 2.1. Introduction
- 3. Market Dynamics
- 3.1. Introduction
- 3.2. Market Drivers
- 3.2.1. Growing Usage of Carbon Nantotubes in Electric Vehicles; Increasing Demand for Advance Materials in Numerous Applications
- 3.3. Market Restrains
- 3.3.1. Environmental Concerns and Health Safety Issues; Other Restraints
- 3.4. Market Trends
- 3.4.1. Energy Segment to Dominate the Market
- 4. Market Factor Analysis
- 4.1. Porters Five Forces
- 4.2. Supply/Value Chain
- 4.3. PESTEL analysis
- 4.4. Market Entropy
- 4.5. Patent/Trademark Analysis
- 5. Global Carbon Nanotubes Market Analysis, Insights and Forecast, 2019-2031
- 5.1. Market Analysis, Insights and Forecast - by Type
- 5.1.1. Multi-walled Carbon Nanotubes (MWCNT)
- 5.1.2. Single-walled Carbon Nanotubes (SWCNT)
- 5.1.3. Other Ty
- 5.2. Market Analysis, Insights and Forecast - by End-user Industry
- 5.2.1. Electronics
- 5.2.2. Aerospace and Defense
- 5.2.3. Automotive
- 5.2.4. Healthcare
- 5.2.5. Energy
- 5.2.6. Other En
- 5.3. Market Analysis, Insights and Forecast - by Region
- 5.3.1. Asia Pacific
- 5.3.2. North America
- 5.3.3. Europe
- 5.3.4. South America
- 5.3.5. Middle East and Africa
- 5.1. Market Analysis, Insights and Forecast - by Type
- 6. Asia Pacific Carbon Nanotubes Market Analysis, Insights and Forecast, 2019-2031
- 6.1. Market Analysis, Insights and Forecast - by Type
- 6.1.1. Multi-walled Carbon Nanotubes (MWCNT)
- 6.1.2. Single-walled Carbon Nanotubes (SWCNT)
- 6.1.3. Other Ty
- 6.2. Market Analysis, Insights and Forecast - by End-user Industry
- 6.2.1. Electronics
- 6.2.2. Aerospace and Defense
- 6.2.3. Automotive
- 6.2.4. Healthcare
- 6.2.5. Energy
- 6.2.6. Other En
- 6.1. Market Analysis, Insights and Forecast - by Type
- 7. North America Carbon Nanotubes Market Analysis, Insights and Forecast, 2019-2031
- 7.1. Market Analysis, Insights and Forecast - by Type
- 7.1.1. Multi-walled Carbon Nanotubes (MWCNT)
- 7.1.2. Single-walled Carbon Nanotubes (SWCNT)
- 7.1.3. Other Ty
- 7.2. Market Analysis, Insights and Forecast - by End-user Industry
- 7.2.1. Electronics
- 7.2.2. Aerospace and Defense
- 7.2.3. Automotive
- 7.2.4. Healthcare
- 7.2.5. Energy
- 7.2.6. Other En
- 7.1. Market Analysis, Insights and Forecast - by Type
- 8. Europe Carbon Nanotubes Market Analysis, Insights and Forecast, 2019-2031
- 8.1. Market Analysis, Insights and Forecast - by Type
- 8.1.1. Multi-walled Carbon Nanotubes (MWCNT)
- 8.1.2. Single-walled Carbon Nanotubes (SWCNT)
- 8.1.3. Other Ty
- 8.2. Market Analysis, Insights and Forecast - by End-user Industry
- 8.2.1. Electronics
- 8.2.2. Aerospace and Defense
- 8.2.3. Automotive
- 8.2.4. Healthcare
- 8.2.5. Energy
- 8.2.6. Other En
- 8.1. Market Analysis, Insights and Forecast - by Type
- 9. South America Carbon Nanotubes Market Analysis, Insights and Forecast, 2019-2031
- 9.1. Market Analysis, Insights and Forecast - by Type
- 9.1.1. Multi-walled Carbon Nanotubes (MWCNT)
- 9.1.2. Single-walled Carbon Nanotubes (SWCNT)
- 9.1.3. Other Ty
- 9.2. Market Analysis, Insights and Forecast - by End-user Industry
- 9.2.1. Electronics
- 9.2.2. Aerospace and Defense
- 9.2.3. Automotive
- 9.2.4. Healthcare
- 9.2.5. Energy
- 9.2.6. Other En
- 9.1. Market Analysis, Insights and Forecast - by Type
- 10. Middle East and Africa Carbon Nanotubes Market Analysis, Insights and Forecast, 2019-2031
- 10.1. Market Analysis, Insights and Forecast - by Type
- 10.1.1. Multi-walled Carbon Nanotubes (MWCNT)
- 10.1.2. Single-walled Carbon Nanotubes (SWCNT)
- 10.1.3. Other Ty
- 10.2. Market Analysis, Insights and Forecast - by End-user Industry
- 10.2.1. Electronics
- 10.2.2. Aerospace and Defense
- 10.2.3. Automotive
- 10.2.4. Healthcare
- 10.2.5. Energy
- 10.2.6. Other En
- 10.1. Market Analysis, Insights and Forecast - by Type
- 11. North America Carbon Nanotubes Market Analysis, Insights and Forecast, 2019-2031
- 11.1. Market Analysis, Insights and Forecast - By Country/Sub-region
- 11.1.1 United States
- 11.1.2 Canada
- 11.1.3 Mexico
- 12. Europe Carbon Nanotubes Market Analysis, Insights and Forecast, 2019-2031
- 12.1. Market Analysis, Insights and Forecast - By Country/Sub-region
- 12.1.1 Germany
- 12.1.2 France
- 12.1.3 Italy
- 12.1.4 United Kingdom
- 12.1.5 Netherlands
- 12.1.6 Rest of Europe
- 13. Asia Pacific Carbon Nanotubes Market Analysis, Insights and Forecast, 2019-2031
- 13.1. Market Analysis, Insights and Forecast - By Country/Sub-region
- 13.1.1 China
- 13.1.2 Japan
- 13.1.3 India
- 13.1.4 South Korea
- 13.1.5 Taiwan
- 13.1.6 Australia
- 13.1.7 Rest of Asia-Pacific
- 14. South America Carbon Nanotubes Market Analysis, Insights and Forecast, 2019-2031
- 14.1. Market Analysis, Insights and Forecast - By Country/Sub-region
- 14.1.1 Brazil
- 14.1.2 Argentina
- 14.1.3 Rest of South America
- 15. MEA Carbon Nanotubes Market Analysis, Insights and Forecast, 2019-2031
- 15.1. Market Analysis, Insights and Forecast - By Country/Sub-region
- 15.1.1 Middle East
- 15.1.2 Africa
- 16. Competitive Analysis
- 16.1. Global Market Share Analysis 2024
- 16.2. Company Profiles
- 16.2.1 Jiangsu Cnano Technology Co Ltd
- 16.2.1.1. Overview
- 16.2.1.2. Products
- 16.2.1.3. SWOT Analysis
- 16.2.1.4. Recent Developments
- 16.2.1.5. Financials (Based on Availability)
- 16.2.2 Arkema
- 16.2.2.1. Overview
- 16.2.2.2. Products
- 16.2.2.3. SWOT Analysis
- 16.2.2.4. Recent Developments
- 16.2.2.5. Financials (Based on Availability)
- 16.2.3 Meijo Nano Carbon
- 16.2.3.1. Overview
- 16.2.3.2. Products
- 16.2.3.3. SWOT Analysis
- 16.2.3.4. Recent Developments
- 16.2.3.5. Financials (Based on Availability)
- 16.2.4 Raymor Industries Inc
- 16.2.4.1. Overview
- 16.2.4.2. Products
- 16.2.4.3. SWOT Analysis
- 16.2.4.4. Recent Developments
- 16.2.4.5. Financials (Based on Availability)
- 16.2.5 Cabot Corporation
- 16.2.5.1. Overview
- 16.2.5.2. Products
- 16.2.5.3. SWOT Analysis
- 16.2.5.4. Recent Developments
- 16.2.5.5. Financials (Based on Availability)
- 16.2.6 Nanocyl SA
- 16.2.6.1. Overview
- 16.2.6.2. Products
- 16.2.6.3. SWOT Analysis
- 16.2.6.4. Recent Developments
- 16.2.6.5. Financials (Based on Availability)
- 16.2.7 Showa Denko KK (Resonac Holdings Corporation)
- 16.2.7.1. Overview
- 16.2.7.2. Products
- 16.2.7.3. SWOT Analysis
- 16.2.7.4. Recent Developments
- 16.2.7.5. Financials (Based on Availability)
- 16.2.8 Ocsial
- 16.2.8.1. Overview
- 16.2.8.2. Products
- 16.2.8.3. SWOT Analysis
- 16.2.8.4. Recent Developments
- 16.2.8.5. Financials (Based on Availability)
- 16.2.9 Hyperion Catalysis International
- 16.2.9.1. Overview
- 16.2.9.2. Products
- 16.2.9.3. SWOT Analysis
- 16.2.9.4. Recent Developments
- 16.2.9.5. Financials (Based on Availability)
- 16.2.10 LG Chem
- 16.2.10.1. Overview
- 16.2.10.2. Products
- 16.2.10.3. SWOT Analysis
- 16.2.10.4. Recent Developments
- 16.2.10.5. Financials (Based on Availability)
- 16.2.11 Nano-C
- 16.2.11.1. Overview
- 16.2.11.2. Products
- 16.2.11.3. SWOT Analysis
- 16.2.11.4. Recent Developments
- 16.2.11.5. Financials (Based on Availability)
- 16.2.12 CHASM
- 16.2.12.1. Overview
- 16.2.12.2. Products
- 16.2.12.3. SWOT Analysis
- 16.2.12.4. Recent Developments
- 16.2.12.5. Financials (Based on Availability)
- 16.2.13 Chengdu Organic Chemicals Co Ltd (Timesnano)
- 16.2.13.1. Overview
- 16.2.13.2. Products
- 16.2.13.3. SWOT Analysis
- 16.2.13.4. Recent Developments
- 16.2.13.5. Financials (Based on Availability)
- 16.2.14 Kumho Petrochemical
- 16.2.14.1. Overview
- 16.2.14.2. Products
- 16.2.14.3. SWOT Analysis
- 16.2.14.4. Recent Developments
- 16.2.14.5. Financials (Based on Availability)
- 16.2.1 Jiangsu Cnano Technology Co Ltd
List of Figures
- Figure 1: Global Carbon Nanotubes Market Revenue Breakdown (Million, %) by Region 2024 & 2032
- Figure 2: Global Carbon Nanotubes Market Volume Breakdown (K Tons, %) by Region 2024 & 2032
- Figure 3: North America Carbon Nanotubes Market Revenue (Million), by Country 2024 & 2032
- Figure 4: North America Carbon Nanotubes Market Volume (K Tons), by Country 2024 & 2032
- Figure 5: North America Carbon Nanotubes Market Revenue Share (%), by Country 2024 & 2032
- Figure 6: North America Carbon Nanotubes Market Volume Share (%), by Country 2024 & 2032
- Figure 7: Europe Carbon Nanotubes Market Revenue (Million), by Country 2024 & 2032
- Figure 8: Europe Carbon Nanotubes Market Volume (K Tons), by Country 2024 & 2032
- Figure 9: Europe Carbon Nanotubes Market Revenue Share (%), by Country 2024 & 2032
- Figure 10: Europe Carbon Nanotubes Market Volume Share (%), by Country 2024 & 2032
- Figure 11: Asia Pacific Carbon Nanotubes Market Revenue (Million), by Country 2024 & 2032
- Figure 12: Asia Pacific Carbon Nanotubes Market Volume (K Tons), by Country 2024 & 2032
- Figure 13: Asia Pacific Carbon Nanotubes Market Revenue Share (%), by Country 2024 & 2032
- Figure 14: Asia Pacific Carbon Nanotubes Market Volume Share (%), by Country 2024 & 2032
- Figure 15: South America Carbon Nanotubes Market Revenue (Million), by Country 2024 & 2032
- Figure 16: South America Carbon Nanotubes Market Volume (K Tons), by Country 2024 & 2032
- Figure 17: South America Carbon Nanotubes Market Revenue Share (%), by Country 2024 & 2032
- Figure 18: South America Carbon Nanotubes Market Volume Share (%), by Country 2024 & 2032
- Figure 19: MEA Carbon Nanotubes Market Revenue (Million), by Country 2024 & 2032
- Figure 20: MEA Carbon Nanotubes Market Volume (K Tons), by Country 2024 & 2032
- Figure 21: MEA Carbon Nanotubes Market Revenue Share (%), by Country 2024 & 2032
- Figure 22: MEA Carbon Nanotubes Market Volume Share (%), by Country 2024 & 2032
- Figure 23: Asia Pacific Carbon Nanotubes Market Revenue (Million), by Type 2024 & 2032
- Figure 24: Asia Pacific Carbon Nanotubes Market Volume (K Tons), by Type 2024 & 2032
- Figure 25: Asia Pacific Carbon Nanotubes Market Revenue Share (%), by Type 2024 & 2032
- Figure 26: Asia Pacific Carbon Nanotubes Market Volume Share (%), by Type 2024 & 2032
- Figure 27: Asia Pacific Carbon Nanotubes Market Revenue (Million), by End-user Industry 2024 & 2032
- Figure 28: Asia Pacific Carbon Nanotubes Market Volume (K Tons), by End-user Industry 2024 & 2032
- Figure 29: Asia Pacific Carbon Nanotubes Market Revenue Share (%), by End-user Industry 2024 & 2032
- Figure 30: Asia Pacific Carbon Nanotubes Market Volume Share (%), by End-user Industry 2024 & 2032
- Figure 31: Asia Pacific Carbon Nanotubes Market Revenue (Million), by Country 2024 & 2032
- Figure 32: Asia Pacific Carbon Nanotubes Market Volume (K Tons), by Country 2024 & 2032
- Figure 33: Asia Pacific Carbon Nanotubes Market Revenue Share (%), by Country 2024 & 2032
- Figure 34: Asia Pacific Carbon Nanotubes Market Volume Share (%), by Country 2024 & 2032
- Figure 35: North America Carbon Nanotubes Market Revenue (Million), by Type 2024 & 2032
- Figure 36: North America Carbon Nanotubes Market Volume (K Tons), by Type 2024 & 2032
- Figure 37: North America Carbon Nanotubes Market Revenue Share (%), by Type 2024 & 2032
- Figure 38: North America Carbon Nanotubes Market Volume Share (%), by Type 2024 & 2032
- Figure 39: North America Carbon Nanotubes Market Revenue (Million), by End-user Industry 2024 & 2032
- Figure 40: North America Carbon Nanotubes Market Volume (K Tons), by End-user Industry 2024 & 2032
- Figure 41: North America Carbon Nanotubes Market Revenue Share (%), by End-user Industry 2024 & 2032
- Figure 42: North America Carbon Nanotubes Market Volume Share (%), by End-user Industry 2024 & 2032
- Figure 43: North America Carbon Nanotubes Market Revenue (Million), by Country 2024 & 2032
- Figure 44: North America Carbon Nanotubes Market Volume (K Tons), by Country 2024 & 2032
- Figure 45: North America Carbon Nanotubes Market Revenue Share (%), by Country 2024 & 2032
- Figure 46: North America Carbon Nanotubes Market Volume Share (%), by Country 2024 & 2032
- Figure 47: Europe Carbon Nanotubes Market Revenue (Million), by Type 2024 & 2032
- Figure 48: Europe Carbon Nanotubes Market Volume (K Tons), by Type 2024 & 2032
- Figure 49: Europe Carbon Nanotubes Market Revenue Share (%), by Type 2024 & 2032
- Figure 50: Europe Carbon Nanotubes Market Volume Share (%), by Type 2024 & 2032
- Figure 51: Europe Carbon Nanotubes Market Revenue (Million), by End-user Industry 2024 & 2032
- Figure 52: Europe Carbon Nanotubes Market Volume (K Tons), by End-user Industry 2024 & 2032
- Figure 53: Europe Carbon Nanotubes Market Revenue Share (%), by End-user Industry 2024 & 2032
- Figure 54: Europe Carbon Nanotubes Market Volume Share (%), by End-user Industry 2024 & 2032
- Figure 55: Europe Carbon Nanotubes Market Revenue (Million), by Country 2024 & 2032
- Figure 56: Europe Carbon Nanotubes Market Volume (K Tons), by Country 2024 & 2032
- Figure 57: Europe Carbon Nanotubes Market Revenue Share (%), by Country 2024 & 2032
- Figure 58: Europe Carbon Nanotubes Market Volume Share (%), by Country 2024 & 2032
- Figure 59: South America Carbon Nanotubes Market Revenue (Million), by Type 2024 & 2032
- Figure 60: South America Carbon Nanotubes Market Volume (K Tons), by Type 2024 & 2032
- Figure 61: South America Carbon Nanotubes Market Revenue Share (%), by Type 2024 & 2032
- Figure 62: South America Carbon Nanotubes Market Volume Share (%), by Type 2024 & 2032
- Figure 63: South America Carbon Nanotubes Market Revenue (Million), by End-user Industry 2024 & 2032
- Figure 64: South America Carbon Nanotubes Market Volume (K Tons), by End-user Industry 2024 & 2032
- Figure 65: South America Carbon Nanotubes Market Revenue Share (%), by End-user Industry 2024 & 2032
- Figure 66: South America Carbon Nanotubes Market Volume Share (%), by End-user Industry 2024 & 2032
- Figure 67: South America Carbon Nanotubes Market Revenue (Million), by Country 2024 & 2032
- Figure 68: South America Carbon Nanotubes Market Volume (K Tons), by Country 2024 & 2032
- Figure 69: South America Carbon Nanotubes Market Revenue Share (%), by Country 2024 & 2032
- Figure 70: South America Carbon Nanotubes Market Volume Share (%), by Country 2024 & 2032
- Figure 71: Middle East and Africa Carbon Nanotubes Market Revenue (Million), by Type 2024 & 2032
- Figure 72: Middle East and Africa Carbon Nanotubes Market Volume (K Tons), by Type 2024 & 2032
- Figure 73: Middle East and Africa Carbon Nanotubes Market Revenue Share (%), by Type 2024 & 2032
- Figure 74: Middle East and Africa Carbon Nanotubes Market Volume Share (%), by Type 2024 & 2032
- Figure 75: Middle East and Africa Carbon Nanotubes Market Revenue (Million), by End-user Industry 2024 & 2032
- Figure 76: Middle East and Africa Carbon Nanotubes Market Volume (K Tons), by End-user Industry 2024 & 2032
- Figure 77: Middle East and Africa Carbon Nanotubes Market Revenue Share (%), by End-user Industry 2024 & 2032
- Figure 78: Middle East and Africa Carbon Nanotubes Market Volume Share (%), by End-user Industry 2024 & 2032
- Figure 79: Middle East and Africa Carbon Nanotubes Market Revenue (Million), by Country 2024 & 2032
- Figure 80: Middle East and Africa Carbon Nanotubes Market Volume (K Tons), by Country 2024 & 2032
- Figure 81: Middle East and Africa Carbon Nanotubes Market Revenue Share (%), by Country 2024 & 2032
- Figure 82: Middle East and Africa Carbon Nanotubes Market Volume Share (%), by Country 2024 & 2032
List of Tables
- Table 1: Global Carbon Nanotubes Market Revenue Million Forecast, by Region 2019 & 2032
- Table 2: Global Carbon Nanotubes Market Volume K Tons Forecast, by Region 2019 & 2032
- Table 3: Global Carbon Nanotubes Market Revenue Million Forecast, by Type 2019 & 2032
- Table 4: Global Carbon Nanotubes Market Volume K Tons Forecast, by Type 2019 & 2032
- Table 5: Global Carbon Nanotubes Market Revenue Million Forecast, by End-user Industry 2019 & 2032
- Table 6: Global Carbon Nanotubes Market Volume K Tons Forecast, by End-user Industry 2019 & 2032
- Table 7: Global Carbon Nanotubes Market Revenue Million Forecast, by Region 2019 & 2032
- Table 8: Global Carbon Nanotubes Market Volume K Tons Forecast, by Region 2019 & 2032
- Table 9: Global Carbon Nanotubes Market Revenue Million Forecast, by Country 2019 & 2032
- Table 10: Global Carbon Nanotubes Market Volume K Tons Forecast, by Country 2019 & 2032
- Table 11: United States Carbon Nanotubes Market Revenue (Million) Forecast, by Application 2019 & 2032
- Table 12: United States Carbon Nanotubes Market Volume (K Tons) Forecast, by Application 2019 & 2032
- Table 13: Canada Carbon Nanotubes Market Revenue (Million) Forecast, by Application 2019 & 2032
- Table 14: Canada Carbon Nanotubes Market Volume (K Tons) Forecast, by Application 2019 & 2032
- Table 15: Mexico Carbon Nanotubes Market Revenue (Million) Forecast, by Application 2019 & 2032
- Table 16: Mexico Carbon Nanotubes Market Volume (K Tons) Forecast, by Application 2019 & 2032
- Table 17: Global Carbon Nanotubes Market Revenue Million Forecast, by Country 2019 & 2032
- Table 18: Global Carbon Nanotubes Market Volume K Tons Forecast, by Country 2019 & 2032
- Table 19: Germany Carbon Nanotubes Market Revenue (Million) Forecast, by Application 2019 & 2032
- Table 20: Germany Carbon Nanotubes Market Volume (K Tons) Forecast, by Application 2019 & 2032
- Table 21: France Carbon Nanotubes Market Revenue (Million) Forecast, by Application 2019 & 2032
- Table 22: France Carbon Nanotubes Market Volume (K Tons) Forecast, by Application 2019 & 2032
- Table 23: Italy Carbon Nanotubes Market Revenue (Million) Forecast, by Application 2019 & 2032
- Table 24: Italy Carbon Nanotubes Market Volume (K Tons) Forecast, by Application 2019 & 2032
- Table 25: United Kingdom Carbon Nanotubes Market Revenue (Million) Forecast, by Application 2019 & 2032
- Table 26: United Kingdom Carbon Nanotubes Market Volume (K Tons) Forecast, by Application 2019 & 2032
- Table 27: Netherlands Carbon Nanotubes Market Revenue (Million) Forecast, by Application 2019 & 2032
- Table 28: Netherlands Carbon Nanotubes Market Volume (K Tons) Forecast, by Application 2019 & 2032
- Table 29: Rest of Europe Carbon Nanotubes Market Revenue (Million) Forecast, by Application 2019 & 2032
- Table 30: Rest of Europe Carbon Nanotubes Market Volume (K Tons) Forecast, by Application 2019 & 2032
- Table 31: Global Carbon Nanotubes Market Revenue Million Forecast, by Country 2019 & 2032
- Table 32: Global Carbon Nanotubes Market Volume K Tons Forecast, by Country 2019 & 2032
- Table 33: China Carbon Nanotubes Market Revenue (Million) Forecast, by Application 2019 & 2032
- Table 34: China Carbon Nanotubes Market Volume (K Tons) Forecast, by Application 2019 & 2032
- Table 35: Japan Carbon Nanotubes Market Revenue (Million) Forecast, by Application 2019 & 2032
- Table 36: Japan Carbon Nanotubes Market Volume (K Tons) Forecast, by Application 2019 & 2032
- Table 37: India Carbon Nanotubes Market Revenue (Million) Forecast, by Application 2019 & 2032
- Table 38: India Carbon Nanotubes Market Volume (K Tons) Forecast, by Application 2019 & 2032
- Table 39: South Korea Carbon Nanotubes Market Revenue (Million) Forecast, by Application 2019 & 2032
- Table 40: South Korea Carbon Nanotubes Market Volume (K Tons) Forecast, by Application 2019 & 2032
- Table 41: Taiwan Carbon Nanotubes Market Revenue (Million) Forecast, by Application 2019 & 2032
- Table 42: Taiwan Carbon Nanotubes Market Volume (K Tons) Forecast, by Application 2019 & 2032
- Table 43: Australia Carbon Nanotubes Market Revenue (Million) Forecast, by Application 2019 & 2032
- Table 44: Australia Carbon Nanotubes Market Volume (K Tons) Forecast, by Application 2019 & 2032
- Table 45: Rest of Asia-Pacific Carbon Nanotubes Market Revenue (Million) Forecast, by Application 2019 & 2032
- Table 46: Rest of Asia-Pacific Carbon Nanotubes Market Volume (K Tons) Forecast, by Application 2019 & 2032
- Table 47: Global Carbon Nanotubes Market Revenue Million Forecast, by Country 2019 & 2032
- Table 48: Global Carbon Nanotubes Market Volume K Tons Forecast, by Country 2019 & 2032
- Table 49: Brazil Carbon Nanotubes Market Revenue (Million) Forecast, by Application 2019 & 2032
- Table 50: Brazil Carbon Nanotubes Market Volume (K Tons) Forecast, by Application 2019 & 2032
- Table 51: Argentina Carbon Nanotubes Market Revenue (Million) Forecast, by Application 2019 & 2032
- Table 52: Argentina Carbon Nanotubes Market Volume (K Tons) Forecast, by Application 2019 & 2032
- Table 53: Rest of South America Carbon Nanotubes Market Revenue (Million) Forecast, by Application 2019 & 2032
- Table 54: Rest of South America Carbon Nanotubes Market Volume (K Tons) Forecast, by Application 2019 & 2032
- Table 55: Global Carbon Nanotubes Market Revenue Million Forecast, by Country 2019 & 2032
- Table 56: Global Carbon Nanotubes Market Volume K Tons Forecast, by Country 2019 & 2032
- Table 57: Middle East Carbon Nanotubes Market Revenue (Million) Forecast, by Application 2019 & 2032
- Table 58: Middle East Carbon Nanotubes Market Volume (K Tons) Forecast, by Application 2019 & 2032
- Table 59: Africa Carbon Nanotubes Market Revenue (Million) Forecast, by Application 2019 & 2032
- Table 60: Africa Carbon Nanotubes Market Volume (K Tons) Forecast, by Application 2019 & 2032
- Table 61: Global Carbon Nanotubes Market Revenue Million Forecast, by Type 2019 & 2032
- Table 62: Global Carbon Nanotubes Market Volume K Tons Forecast, by Type 2019 & 2032
- Table 63: Global Carbon Nanotubes Market Revenue Million Forecast, by End-user Industry 2019 & 2032
- Table 64: Global Carbon Nanotubes Market Volume K Tons Forecast, by End-user Industry 2019 & 2032
- Table 65: Global Carbon Nanotubes Market Revenue Million Forecast, by Country 2019 & 2032
- Table 66: Global Carbon Nanotubes Market Volume K Tons Forecast, by Country 2019 & 2032
- Table 67: China Carbon Nanotubes Market Revenue (Million) Forecast, by Application 2019 & 2032
- Table 68: China Carbon Nanotubes Market Volume (K Tons) Forecast, by Application 2019 & 2032
- Table 69: India Carbon Nanotubes Market Revenue (Million) Forecast, by Application 2019 & 2032
- Table 70: India Carbon Nanotubes Market Volume (K Tons) Forecast, by Application 2019 & 2032
- Table 71: Japan Carbon Nanotubes Market Revenue (Million) Forecast, by Application 2019 & 2032
- Table 72: Japan Carbon Nanotubes Market Volume (K Tons) Forecast, by Application 2019 & 2032
- Table 73: South Korea Carbon Nanotubes Market Revenue (Million) Forecast, by Application 2019 & 2032
- Table 74: South Korea Carbon Nanotubes Market Volume (K Tons) Forecast, by Application 2019 & 2032
- Table 75: Rest of Asia Pacific Carbon Nanotubes Market Revenue (Million) Forecast, by Application 2019 & 2032
- Table 76: Rest of Asia Pacific Carbon Nanotubes Market Volume (K Tons) Forecast, by Application 2019 & 2032
- Table 77: Global Carbon Nanotubes Market Revenue Million Forecast, by Type 2019 & 2032
- Table 78: Global Carbon Nanotubes Market Volume K Tons Forecast, by Type 2019 & 2032
- Table 79: Global Carbon Nanotubes Market Revenue Million Forecast, by End-user Industry 2019 & 2032
- Table 80: Global Carbon Nanotubes Market Volume K Tons Forecast, by End-user Industry 2019 & 2032
- Table 81: Global Carbon Nanotubes Market Revenue Million Forecast, by Country 2019 & 2032
- Table 82: Global Carbon Nanotubes Market Volume K Tons Forecast, by Country 2019 & 2032
- Table 83: United States Carbon Nanotubes Market Revenue (Million) Forecast, by Application 2019 & 2032
- Table 84: United States Carbon Nanotubes Market Volume (K Tons) Forecast, by Application 2019 & 2032
- Table 85: Canada Carbon Nanotubes Market Revenue (Million) Forecast, by Application 2019 & 2032
- Table 86: Canada Carbon Nanotubes Market Volume (K Tons) Forecast, by Application 2019 & 2032
- Table 87: Mexico Carbon Nanotubes Market Revenue (Million) Forecast, by Application 2019 & 2032
- Table 88: Mexico Carbon Nanotubes Market Volume (K Tons) Forecast, by Application 2019 & 2032
- Table 89: Global Carbon Nanotubes Market Revenue Million Forecast, by Type 2019 & 2032
- Table 90: Global Carbon Nanotubes Market Volume K Tons Forecast, by Type 2019 & 2032
- Table 91: Global Carbon Nanotubes Market Revenue Million Forecast, by End-user Industry 2019 & 2032
- Table 92: Global Carbon Nanotubes Market Volume K Tons Forecast, by End-user Industry 2019 & 2032
- Table 93: Global Carbon Nanotubes Market Revenue Million Forecast, by Country 2019 & 2032
- Table 94: Global Carbon Nanotubes Market Volume K Tons Forecast, by Country 2019 & 2032
- Table 95: Germany Carbon Nanotubes Market Revenue (Million) Forecast, by Application 2019 & 2032
- Table 96: Germany Carbon Nanotubes Market Volume (K Tons) Forecast, by Application 2019 & 2032
- Table 97: United Kingdom Carbon Nanotubes Market Revenue (Million) Forecast, by Application 2019 & 2032
- Table 98: United Kingdom Carbon Nanotubes Market Volume (K Tons) Forecast, by Application 2019 & 2032
- Table 99: Italy Carbon Nanotubes Market Revenue (Million) Forecast, by Application 2019 & 2032
- Table 100: Italy Carbon Nanotubes Market Volume (K Tons) Forecast, by Application 2019 & 2032
- Table 101: France Carbon Nanotubes Market Revenue (Million) Forecast, by Application 2019 & 2032
- Table 102: France Carbon Nanotubes Market Volume (K Tons) Forecast, by Application 2019 & 2032
- Table 103: Spain Carbon Nanotubes Market Revenue (Million) Forecast, by Application 2019 & 2032
- Table 104: Spain Carbon Nanotubes Market Volume (K Tons) Forecast, by Application 2019 & 2032
- Table 105: Rest of Europe Carbon Nanotubes Market Revenue (Million) Forecast, by Application 2019 & 2032
- Table 106: Rest of Europe Carbon Nanotubes Market Volume (K Tons) Forecast, by Application 2019 & 2032
- Table 107: Global Carbon Nanotubes Market Revenue Million Forecast, by Type 2019 & 2032
- Table 108: Global Carbon Nanotubes Market Volume K Tons Forecast, by Type 2019 & 2032
- Table 109: Global Carbon Nanotubes Market Revenue Million Forecast, by End-user Industry 2019 & 2032
- Table 110: Global Carbon Nanotubes Market Volume K Tons Forecast, by End-user Industry 2019 & 2032
- Table 111: Global Carbon Nanotubes Market Revenue Million Forecast, by Country 2019 & 2032
- Table 112: Global Carbon Nanotubes Market Volume K Tons Forecast, by Country 2019 & 2032
- Table 113: Brazil Carbon Nanotubes Market Revenue (Million) Forecast, by Application 2019 & 2032
- Table 114: Brazil Carbon Nanotubes Market Volume (K Tons) Forecast, by Application 2019 & 2032
- Table 115: Argentina Carbon Nanotubes Market Revenue (Million) Forecast, by Application 2019 & 2032
- Table 116: Argentina Carbon Nanotubes Market Volume (K Tons) Forecast, by Application 2019 & 2032
- Table 117: Rest of South America Carbon Nanotubes Market Revenue (Million) Forecast, by Application 2019 & 2032
- Table 118: Rest of South America Carbon Nanotubes Market Volume (K Tons) Forecast, by Application 2019 & 2032
- Table 119: Global Carbon Nanotubes Market Revenue Million Forecast, by Type 2019 & 2032
- Table 120: Global Carbon Nanotubes Market Volume K Tons Forecast, by Type 2019 & 2032
- Table 121: Global Carbon Nanotubes Market Revenue Million Forecast, by End-user Industry 2019 & 2032
- Table 122: Global Carbon Nanotubes Market Volume K Tons Forecast, by End-user Industry 2019 & 2032
- Table 123: Global Carbon Nanotubes Market Revenue Million Forecast, by Country 2019 & 2032
- Table 124: Global Carbon Nanotubes Market Volume K Tons Forecast, by Country 2019 & 2032
- Table 125: Saudi Arabia Carbon Nanotubes Market Revenue (Million) Forecast, by Application 2019 & 2032
- Table 126: Saudi Arabia Carbon Nanotubes Market Volume (K Tons) Forecast, by Application 2019 & 2032
- Table 127: South Africa Carbon Nanotubes Market Revenue (Million) Forecast, by Application 2019 & 2032
- Table 128: South Africa Carbon Nanotubes Market Volume (K Tons) Forecast, by Application 2019 & 2032
- Table 129: Rest of Middle East and Africa Carbon Nanotubes Market Revenue (Million) Forecast, by Application 2019 & 2032
- Table 130: Rest of Middle East and Africa Carbon Nanotubes Market Volume (K Tons) Forecast, by Application 2019 & 2032
Frequently Asked Questions
1. What is the projected Compound Annual Growth Rate (CAGR) of the Carbon Nanotubes Market?
The projected CAGR is approximately 34.78%.
2. Which companies are prominent players in the Carbon Nanotubes Market?
Key companies in the market include Jiangsu Cnano Technology Co Ltd, Arkema, Meijo Nano Carbon, Raymor Industries Inc, Cabot Corporation, Nanocyl SA, Showa Denko KK (Resonac Holdings Corporation), Ocsial, Hyperion Catalysis International, LG Chem, Nano-C, CHASM, Chengdu Organic Chemicals Co Ltd (Timesnano), Kumho Petrochemical.
3. What are the main segments of the Carbon Nanotubes Market?
The market segments include Type, End-user Industry.
4. Can you provide details about the market size?
The market size is estimated to be USD 6.51 Million as of 2022.
5. What are some drivers contributing to market growth?
Growing Usage of Carbon Nantotubes in Electric Vehicles; Increasing Demand for Advance Materials in Numerous Applications.
6. What are the notable trends driving market growth?
Energy Segment to Dominate the Market.
7. Are there any restraints impacting market growth?
Environmental Concerns and Health Safety Issues; Other Restraints.
8. Can you provide examples of recent developments in the market?
May 2023: LG CHEM announced the construction of its fourth carbon nanotube (CNT) plant at Daesan, South Korea. The plant is slated for operation in 2025. Through the expansion, the company contributes to doubling LG Chem’s annual CNT production capability to 6,100 tons, strengthening its product portfolio.
9. What pricing options are available for accessing the report?
Pricing options include single-user, multi-user, and enterprise licenses priced at USD 4750, USD 5250, and USD 8750 respectively.
10. Is the market size provided in terms of value or volume?
The market size is provided in terms of value, measured in Million and volume, measured in K Tons.
11. Are there any specific market keywords associated with the report?
Yes, the market keyword associated with the report is "Carbon Nanotubes Market," which aids in identifying and referencing the specific market segment covered.
12. How do I determine which pricing option suits my needs best?
The pricing options vary based on user requirements and access needs. Individual users may opt for single-user licenses, while businesses requiring broader access may choose multi-user or enterprise licenses for cost-effective access to the report.
13. Are there any additional resources or data provided in the Carbon Nanotubes Market report?
While the report offers comprehensive insights, it's advisable to review the specific contents or supplementary materials provided to ascertain if additional resources or data are available.
14. How can I stay updated on further developments or reports in the Carbon Nanotubes Market?
To stay informed about further developments, trends, and reports in the Carbon Nanotubes Market, consider subscribing to industry newsletters, following relevant companies and organizations, or regularly checking reputable industry news sources and publications.
Methodology
Step 1 - Identification of Relevant Samples Size from Population Database


Step 2 - Approaches for Defining Global Market Size (Value, Volume* & Price*)

Note*: In applicable scenarios
Step 3 - Data Sources
Primary Research
- Web Analytics
- Survey Reports
- Research Institute
- Latest Research Reports
- Opinion Leaders
Secondary Research
- Annual Reports
- White Paper
- Latest Press Release
- Industry Association
- Paid Database
- Investor Presentations

Step 4 - Data Triangulation
Involves using different sources of information in order to increase the validity of a study
These sources are likely to be stakeholders in a program - participants, other researchers, program staff, other community members, and so on.
Then we put all data in single framework & apply various statistical tools to find out the dynamic on the market.
During the analysis stage, feedback from the stakeholder groups would be compared to determine areas of agreement as well as areas of divergence


