
Key Insights
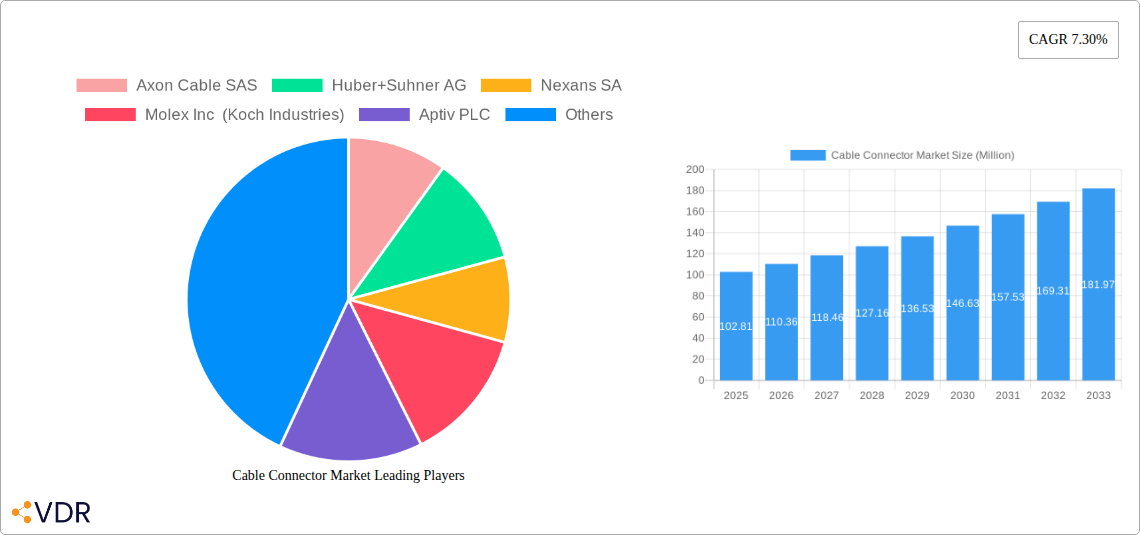
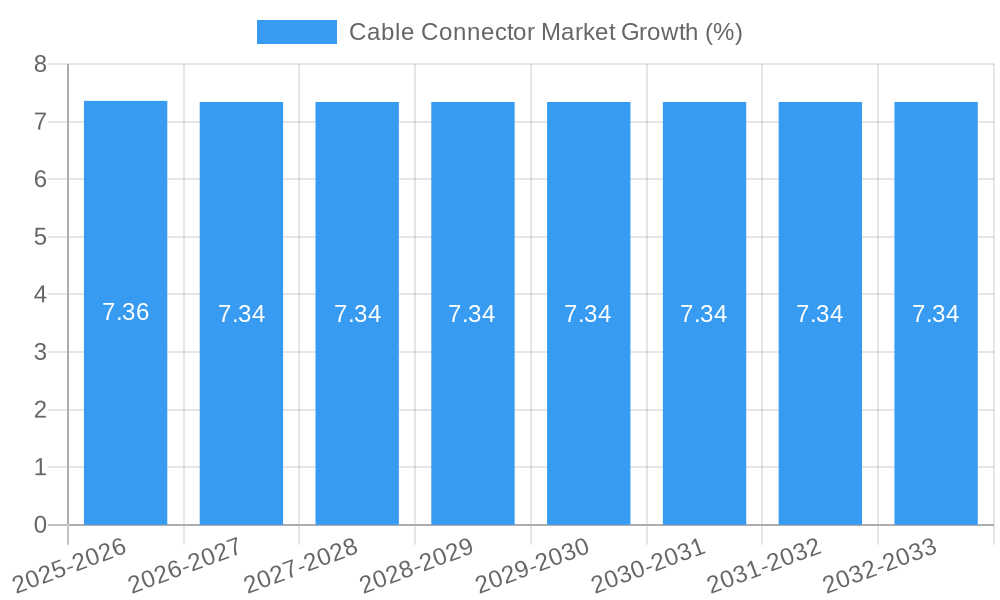
The global cable connector market, valued at $102.81 million in 2025, is projected to experience robust growth, driven by the increasing demand for high-speed data transmission and connectivity across diverse sectors. The Compound Annual Growth Rate (CAGR) of 7.30% from 2025 to 2033 indicates a significant expansion, fueled by several key factors. The burgeoning adoption of advanced technologies like 5G and the Internet of Things (IoT) necessitates high-performance cable connectors, driving market growth. Furthermore, the automotive industry's shift towards electric vehicles and autonomous driving systems creates substantial demand for specialized connectors capable of handling increased power and data requirements. The rise of cloud computing and data centers also contributes significantly, as these facilities rely heavily on reliable and efficient cable connectivity solutions. Finally, the increasing automation in industrial settings necessitates robust and durable connectors, furthering market expansion.
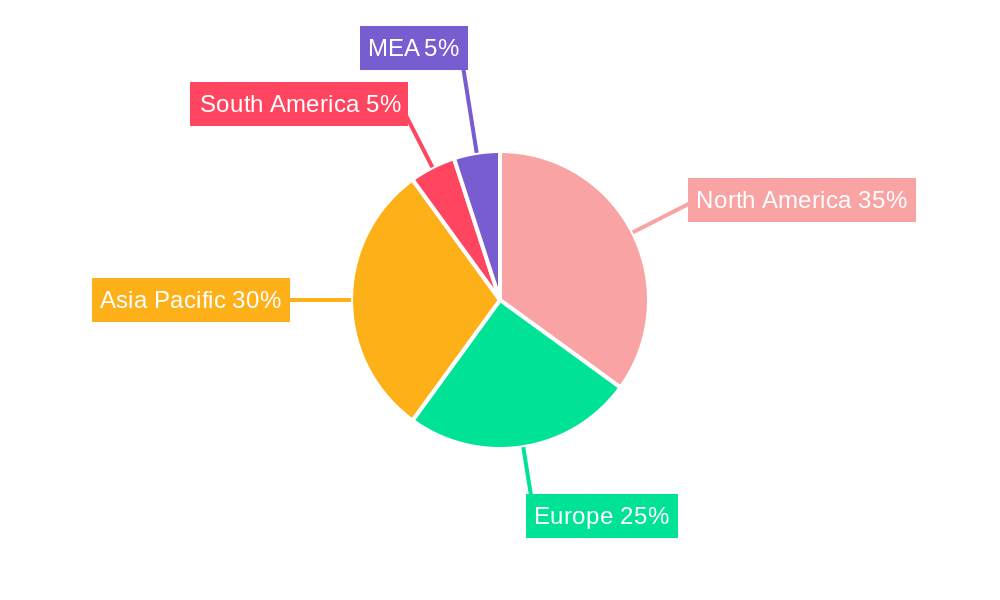
Segment-wise, the PCB connectors segment is expected to dominate due to its widespread use in various electronic devices. However, other segments like fiber optic connectors and circular/rectangular connectors are also expected to show substantial growth driven by their applications in high-speed data transmission and harsh environments respectively. Geographically, North America and Asia Pacific are anticipated to be the key revenue contributors, benefiting from their well-established technological infrastructure and burgeoning electronics manufacturing industries. However, strong growth is also expected in other regions, particularly in developing economies experiencing rapid industrialization and technological advancement. Competition in the market is intense, with major players like Molex, TE Connectivity, Amphenol, and others constantly innovating and expanding their product portfolios to cater to evolving market demands and technological advancements.
Cable Connector Market: A Comprehensive Market Report (2019-2033)
This in-depth report provides a comprehensive analysis of the Cable Connector Market, encompassing market dynamics, growth trends, regional dominance, product landscape, key players, and future outlook. The study period covers 2019-2033, with 2025 serving as the base and estimated year. The report segments the market by type (PCB Connectors, Circular/Rectangular Connectors, Fiber Optic Connectors, IO Connectors, Other Types) and end-user vertical (IT and Telecom, Automotive/Transportation, Consumer Electronics, Industrial, Other End-user Verticals). The market size is presented in million units.
Cable Connector Market Market Dynamics & Structure
The Cable Connector market is characterized by a moderately concentrated landscape with several key players holding significant market share. Technological innovation, particularly in high-speed data transmission and miniaturization, is a primary growth driver. Stringent regulatory frameworks regarding safety and performance standards influence market dynamics. Competitive pressures from substitute technologies (e.g., wireless communication) exist, but the market's overall growth is sustained by increasing demand across diverse end-user verticals. Mergers and acquisitions (M&A) activity is moderate, reflecting strategic consolidation and expansion efforts by major players. The historical period (2019-2024) witnessed a xx% CAGR, with projections of xx% CAGR during the forecast period (2025-2033).
- Market Concentration: The top 5 players hold approximately xx% of the market share in 2025.
- Technological Innovation: Focus on high-bandwidth connectors, miniaturization, and environmentally friendly materials.
- Regulatory Frameworks: Compliance with industry standards (e.g., RoHS, REACH) influences product development and manufacturing.
- M&A Activity: An estimated xx M&A deals occurred between 2019 and 2024, primarily driven by vertical integration and geographic expansion strategies.
- Innovation Barriers: High R&D costs and the need for specialized manufacturing expertise pose significant barriers to entry for new players.
Cable Connector Market Growth Trends & Insights
The Cable Connector market is experiencing robust growth, driven by the escalating demand for high-speed data transmission across various sectors. The increasing adoption of 5G technology and the proliferation of connected devices are key factors. Technological disruptions, such as the development of advanced connector types with higher bandwidth capabilities and improved durability, are further fueling market expansion. Shifting consumer preferences toward smaller, more efficient, and reliable electronic devices are also driving demand. The market size is projected to reach xx million units by 2033, exhibiting a CAGR of xx% from 2025 to 2033. Market penetration in emerging economies is expected to increase significantly during the forecast period.
Dominant Regions, Countries, or Segments in Cable Connector Market
The IT and Telecom sector represents the largest end-user segment, driven by the rapid expansion of data centers and telecommunication networks. North America and Asia-Pacific dominate the market geographically, due to robust technological advancements and high consumer electronics adoption rates. Within the type segment, Circular/Rectangular Connectors hold the largest market share due to their versatility and wide applicability.
- Key Drivers in North America: Strong technological infrastructure, high R&D investments, and the presence of major industry players.
- Key Drivers in Asia-Pacific: Rapid economic growth, increasing smartphone penetration, and expanding automotive and industrial sectors.
- Circular/Rectangular Connectors Dominance: Versatility across various applications and established manufacturing capabilities.
- IT & Telecom Segment Leadership: High demand driven by 5G deployment and data center expansion.
Cable Connector Market Product Landscape
The cable connector market showcases ongoing product innovation, focusing on miniaturization, enhanced durability, and higher bandwidth capabilities. New connectors are being designed to withstand extreme temperatures and vibration, addressing specific requirements in robotics and aerospace applications. High-speed data transmission connectors incorporating PAM4 technology are gaining traction, enabling faster and more efficient data transfer. Unique selling propositions include improved signal integrity, enhanced reliability, and compact designs to accommodate space constraints in modern electronics.
Key Drivers, Barriers & Challenges in Cable Connector Market
Key Drivers: Increasing demand for high-speed data transmission, miniaturization trends in electronics, growth in the automotive and industrial sectors, and the expansion of 5G and IoT technologies.
Key Challenges: Intense competition, fluctuating raw material prices, stringent regulatory compliance, and supply chain disruptions. These factors can lead to price volatility and potential delays in production. The impact of these challenges can be quantified in terms of reduced profit margins and project delays – an estimated xx% impact on overall market growth in the next 5 years.
Emerging Opportunities in Cable Connector Market
Emerging opportunities lie in the development of connectors for next-generation applications, such as autonomous vehicles, robotics, and advanced medical devices. The increasing adoption of sustainable materials and eco-friendly manufacturing processes presents significant opportunities. Furthermore, untapped markets in developing economies offer considerable growth potential.
Growth Accelerators in the Cable Connector Market Industry
Technological advancements, strategic partnerships between connector manufacturers and technology companies, and expansion into new geographical markets are key growth accelerators. The development of innovative connector types with improved performance and enhanced durability will continue to drive market expansion. Strategic alliances will help companies access new markets and technologies.
Key Players Shaping the Cable Connector Market Market
- Axon Cable SAS
- Huber+Suhner AG
- Nexans SA
- Molex Inc (Koch Industries)
- Aptiv PLC
- Prysmian SpA
- 3M Company
- Fujitsu Limited
- Amphenol Corporation
- Huawei Technologies Co Ltd
- TE Connectivity Limited
- Yazaki Corporation
- Alcatel-Lucent SA
Notable Milestones in Cable Connector Market Sector
- November 2021: TE Connectivity launched new connectors for robots and UAVs, designed for extreme environments.
- September 2021: Amphenol ICC and eTopus Technology announced a 112Gb/s interconnect technology using PAM4 technology.
In-Depth Cable Connector Market Market Outlook
The Cable Connector market is poised for sustained growth, driven by ongoing technological advancements and the increasing demand for high-speed data transfer across diverse sectors. Strategic investments in R&D, coupled with the expansion into new applications and markets, will further accelerate market growth. Companies focused on innovation and strategic partnerships are well-positioned to capitalize on the significant market opportunities.
Cable Connector Market Segmentation
-
1. Type
- 1.1. PCB Connectors
- 1.2. Circular/Rectangular Connectors
- 1.3. Fiber Optic Connectors
- 1.4. IO Connectors
- 1.5. Other Types
-
2. End-user Vertical
- 2.1. IT and Telecom
- 2.2. Automotive/Transportation
- 2.3. Consumer
- 2.4. Industrial
- 2.5. Other En
Cable Connector Market Segmentation By Geography
- 1. North America
- 2. Europe
- 3. Asia Pacific
- 4. Latin America
- 5. Middle East and Africa
Cable Connector Market REPORT HIGHLIGHTS
| Aspects | Details |
|---|---|
| Study Period | 2019-2033 |
| Base Year | 2024 |
| Estimated Year | 2025 |
| Forecast Period | 2025-2033 |
| Historical Period | 2019-2024 |
| Growth Rate | CAGR of 7.30% from 2019-2033 |
| Segmentation |
|
Table of Contents
- 1. Introduction
- 1.1. Research Scope
- 1.2. Market Segmentation
- 1.3. Research Methodology
- 1.4. Definitions and Assumptions
- 2. Executive Summary
- 2.1. Introduction
- 3. Market Dynamics
- 3.1. Introduction
- 3.2. Market Drivers
- 3.2.1. Growing Advancements In The Telecom Sector Coupled With Greater Demand for Improved Connectivity; Increasing Demand for High Bandwidth
- 3.3. Market Restrains
- 3.3.1. Fragmentation in the Regional Markets; Volatility in Raw Material Prices
- 3.4. Market Trends
- 3.4.1. Automotive Sector is Expected to Hold Significant Market Share
- 4. Market Factor Analysis
- 4.1. Porters Five Forces
- 4.2. Supply/Value Chain
- 4.3. PESTEL analysis
- 4.4. Market Entropy
- 4.5. Patent/Trademark Analysis
- 5. Global Cable Connector Market Analysis, Insights and Forecast, 2019-2031
- 5.1. Market Analysis, Insights and Forecast - by Type
- 5.1.1. PCB Connectors
- 5.1.2. Circular/Rectangular Connectors
- 5.1.3. Fiber Optic Connectors
- 5.1.4. IO Connectors
- 5.1.5. Other Types
- 5.2. Market Analysis, Insights and Forecast - by End-user Vertical
- 5.2.1. IT and Telecom
- 5.2.2. Automotive/Transportation
- 5.2.3. Consumer
- 5.2.4. Industrial
- 5.2.5. Other En
- 5.3. Market Analysis, Insights and Forecast - by Region
- 5.3.1. North America
- 5.3.2. Europe
- 5.3.3. Asia Pacific
- 5.3.4. Latin America
- 5.3.5. Middle East and Africa
- 5.1. Market Analysis, Insights and Forecast - by Type
- 6. North America Cable Connector Market Analysis, Insights and Forecast, 2019-2031
- 6.1. Market Analysis, Insights and Forecast - by Type
- 6.1.1. PCB Connectors
- 6.1.2. Circular/Rectangular Connectors
- 6.1.3. Fiber Optic Connectors
- 6.1.4. IO Connectors
- 6.1.5. Other Types
- 6.2. Market Analysis, Insights and Forecast - by End-user Vertical
- 6.2.1. IT and Telecom
- 6.2.2. Automotive/Transportation
- 6.2.3. Consumer
- 6.2.4. Industrial
- 6.2.5. Other En
- 6.1. Market Analysis, Insights and Forecast - by Type
- 7. Europe Cable Connector Market Analysis, Insights and Forecast, 2019-2031
- 7.1. Market Analysis, Insights and Forecast - by Type
- 7.1.1. PCB Connectors
- 7.1.2. Circular/Rectangular Connectors
- 7.1.3. Fiber Optic Connectors
- 7.1.4. IO Connectors
- 7.1.5. Other Types
- 7.2. Market Analysis, Insights and Forecast - by End-user Vertical
- 7.2.1. IT and Telecom
- 7.2.2. Automotive/Transportation
- 7.2.3. Consumer
- 7.2.4. Industrial
- 7.2.5. Other En
- 7.1. Market Analysis, Insights and Forecast - by Type
- 8. Asia Pacific Cable Connector Market Analysis, Insights and Forecast, 2019-2031
- 8.1. Market Analysis, Insights and Forecast - by Type
- 8.1.1. PCB Connectors
- 8.1.2. Circular/Rectangular Connectors
- 8.1.3. Fiber Optic Connectors
- 8.1.4. IO Connectors
- 8.1.5. Other Types
- 8.2. Market Analysis, Insights and Forecast - by End-user Vertical
- 8.2.1. IT and Telecom
- 8.2.2. Automotive/Transportation
- 8.2.3. Consumer
- 8.2.4. Industrial
- 8.2.5. Other En
- 8.1. Market Analysis, Insights and Forecast - by Type
- 9. Latin America Cable Connector Market Analysis, Insights and Forecast, 2019-2031
- 9.1. Market Analysis, Insights and Forecast - by Type
- 9.1.1. PCB Connectors
- 9.1.2. Circular/Rectangular Connectors
- 9.1.3. Fiber Optic Connectors
- 9.1.4. IO Connectors
- 9.1.5. Other Types
- 9.2. Market Analysis, Insights and Forecast - by End-user Vertical
- 9.2.1. IT and Telecom
- 9.2.2. Automotive/Transportation
- 9.2.3. Consumer
- 9.2.4. Industrial
- 9.2.5. Other En
- 9.1. Market Analysis, Insights and Forecast - by Type
- 10. Middle East and Africa Cable Connector Market Analysis, Insights and Forecast, 2019-2031
- 10.1. Market Analysis, Insights and Forecast - by Type
- 10.1.1. PCB Connectors
- 10.1.2. Circular/Rectangular Connectors
- 10.1.3. Fiber Optic Connectors
- 10.1.4. IO Connectors
- 10.1.5. Other Types
- 10.2. Market Analysis, Insights and Forecast - by End-user Vertical
- 10.2.1. IT and Telecom
- 10.2.2. Automotive/Transportation
- 10.2.3. Consumer
- 10.2.4. Industrial
- 10.2.5. Other En
- 10.1. Market Analysis, Insights and Forecast - by Type
- 11. North America Cable Connector Market Analysis, Insights and Forecast, 2019-2031
- 11.1. Market Analysis, Insights and Forecast - By Country/Sub-region
- 11.1.1 United States
- 11.1.2 Canada
- 11.1.3 Mexico
- 12. Europe Cable Connector Market Analysis, Insights and Forecast, 2019-2031
- 12.1. Market Analysis, Insights and Forecast - By Country/Sub-region
- 12.1.1 Germany
- 12.1.2 United Kingdom
- 12.1.3 France
- 12.1.4 Spain
- 12.1.5 Italy
- 12.1.6 Spain
- 12.1.7 Belgium
- 12.1.8 Netherland
- 12.1.9 Nordics
- 12.1.10 Rest of Europe
- 13. Asia Pacific Cable Connector Market Analysis, Insights and Forecast, 2019-2031
- 13.1. Market Analysis, Insights and Forecast - By Country/Sub-region
- 13.1.1 China
- 13.1.2 Japan
- 13.1.3 India
- 13.1.4 South Korea
- 13.1.5 Southeast Asia
- 13.1.6 Australia
- 13.1.7 Indonesia
- 13.1.8 Phillipes
- 13.1.9 Singapore
- 13.1.10 Thailandc
- 13.1.11 Rest of Asia Pacific
- 14. South America Cable Connector Market Analysis, Insights and Forecast, 2019-2031
- 14.1. Market Analysis, Insights and Forecast - By Country/Sub-region
- 14.1.1 Brazil
- 14.1.2 Argentina
- 14.1.3 Peru
- 14.1.4 Chile
- 14.1.5 Colombia
- 14.1.6 Ecuador
- 14.1.7 Venezuela
- 14.1.8 Rest of South America
- 15. MEA Cable Connector Market Analysis, Insights and Forecast, 2019-2031
- 15.1. Market Analysis, Insights and Forecast - By Country/Sub-region
- 15.1.1 United Arab Emirates
- 15.1.2 Saudi Arabia
- 15.1.3 South Africa
- 15.1.4 Rest of Middle East and Africa
- 16. Competitive Analysis
- 16.1. Global Market Share Analysis 2024
- 16.2. Company Profiles
- 16.2.1 Axon Cable SAS
- 16.2.1.1. Overview
- 16.2.1.2. Products
- 16.2.1.3. SWOT Analysis
- 16.2.1.4. Recent Developments
- 16.2.1.5. Financials (Based on Availability)
- 16.2.2 Huber+Suhner AG
- 16.2.2.1. Overview
- 16.2.2.2. Products
- 16.2.2.3. SWOT Analysis
- 16.2.2.4. Recent Developments
- 16.2.2.5. Financials (Based on Availability)
- 16.2.3 Nexans SA
- 16.2.3.1. Overview
- 16.2.3.2. Products
- 16.2.3.3. SWOT Analysis
- 16.2.3.4. Recent Developments
- 16.2.3.5. Financials (Based on Availability)
- 16.2.4 Molex Inc (Koch Industries)
- 16.2.4.1. Overview
- 16.2.4.2. Products
- 16.2.4.3. SWOT Analysis
- 16.2.4.4. Recent Developments
- 16.2.4.5. Financials (Based on Availability)
- 16.2.5 Aptiv PLC
- 16.2.5.1. Overview
- 16.2.5.2. Products
- 16.2.5.3. SWOT Analysis
- 16.2.5.4. Recent Developments
- 16.2.5.5. Financials (Based on Availability)
- 16.2.6 Prysmian SpA
- 16.2.6.1. Overview
- 16.2.6.2. Products
- 16.2.6.3. SWOT Analysis
- 16.2.6.4. Recent Developments
- 16.2.6.5. Financials (Based on Availability)
- 16.2.7 3M Company
- 16.2.7.1. Overview
- 16.2.7.2. Products
- 16.2.7.3. SWOT Analysis
- 16.2.7.4. Recent Developments
- 16.2.7.5. Financials (Based on Availability)
- 16.2.8 Fujitsu Limited
- 16.2.8.1. Overview
- 16.2.8.2. Products
- 16.2.8.3. SWOT Analysis
- 16.2.8.4. Recent Developments
- 16.2.8.5. Financials (Based on Availability)
- 16.2.9 Amphenol Corporation
- 16.2.9.1. Overview
- 16.2.9.2. Products
- 16.2.9.3. SWOT Analysis
- 16.2.9.4. Recent Developments
- 16.2.9.5. Financials (Based on Availability)
- 16.2.10 Huawei Technologies Co Ltd
- 16.2.10.1. Overview
- 16.2.10.2. Products
- 16.2.10.3. SWOT Analysis
- 16.2.10.4. Recent Developments
- 16.2.10.5. Financials (Based on Availability)
- 16.2.11 TE Connectivity Limited
- 16.2.11.1. Overview
- 16.2.11.2. Products
- 16.2.11.3. SWOT Analysis
- 16.2.11.4. Recent Developments
- 16.2.11.5. Financials (Based on Availability)
- 16.2.12 Yazaki Corporation
- 16.2.12.1. Overview
- 16.2.12.2. Products
- 16.2.12.3. SWOT Analysis
- 16.2.12.4. Recent Developments
- 16.2.12.5. Financials (Based on Availability)
- 16.2.13 Alcatel-Lucent SA
- 16.2.13.1. Overview
- 16.2.13.2. Products
- 16.2.13.3. SWOT Analysis
- 16.2.13.4. Recent Developments
- 16.2.13.5. Financials (Based on Availability)
- 16.2.1 Axon Cable SAS
List of Figures
- Figure 1: Global Cable Connector Market Revenue Breakdown (Million, %) by Region 2024 & 2032
- Figure 2: Global Cable Connector Market Volume Breakdown (K Unit, %) by Region 2024 & 2032
- Figure 3: North America Cable Connector Market Revenue (Million), by Country 2024 & 2032
- Figure 4: North America Cable Connector Market Volume (K Unit), by Country 2024 & 2032
- Figure 5: North America Cable Connector Market Revenue Share (%), by Country 2024 & 2032
- Figure 6: North America Cable Connector Market Volume Share (%), by Country 2024 & 2032
- Figure 7: Europe Cable Connector Market Revenue (Million), by Country 2024 & 2032
- Figure 8: Europe Cable Connector Market Volume (K Unit), by Country 2024 & 2032
- Figure 9: Europe Cable Connector Market Revenue Share (%), by Country 2024 & 2032
- Figure 10: Europe Cable Connector Market Volume Share (%), by Country 2024 & 2032
- Figure 11: Asia Pacific Cable Connector Market Revenue (Million), by Country 2024 & 2032
- Figure 12: Asia Pacific Cable Connector Market Volume (K Unit), by Country 2024 & 2032
- Figure 13: Asia Pacific Cable Connector Market Revenue Share (%), by Country 2024 & 2032
- Figure 14: Asia Pacific Cable Connector Market Volume Share (%), by Country 2024 & 2032
- Figure 15: South America Cable Connector Market Revenue (Million), by Country 2024 & 2032
- Figure 16: South America Cable Connector Market Volume (K Unit), by Country 2024 & 2032
- Figure 17: South America Cable Connector Market Revenue Share (%), by Country 2024 & 2032
- Figure 18: South America Cable Connector Market Volume Share (%), by Country 2024 & 2032
- Figure 19: MEA Cable Connector Market Revenue (Million), by Country 2024 & 2032
- Figure 20: MEA Cable Connector Market Volume (K Unit), by Country 2024 & 2032
- Figure 21: MEA Cable Connector Market Revenue Share (%), by Country 2024 & 2032
- Figure 22: MEA Cable Connector Market Volume Share (%), by Country 2024 & 2032
- Figure 23: North America Cable Connector Market Revenue (Million), by Type 2024 & 2032
- Figure 24: North America Cable Connector Market Volume (K Unit), by Type 2024 & 2032
- Figure 25: North America Cable Connector Market Revenue Share (%), by Type 2024 & 2032
- Figure 26: North America Cable Connector Market Volume Share (%), by Type 2024 & 2032
- Figure 27: North America Cable Connector Market Revenue (Million), by End-user Vertical 2024 & 2032
- Figure 28: North America Cable Connector Market Volume (K Unit), by End-user Vertical 2024 & 2032
- Figure 29: North America Cable Connector Market Revenue Share (%), by End-user Vertical 2024 & 2032
- Figure 30: North America Cable Connector Market Volume Share (%), by End-user Vertical 2024 & 2032
- Figure 31: North America Cable Connector Market Revenue (Million), by Country 2024 & 2032
- Figure 32: North America Cable Connector Market Volume (K Unit), by Country 2024 & 2032
- Figure 33: North America Cable Connector Market Revenue Share (%), by Country 2024 & 2032
- Figure 34: North America Cable Connector Market Volume Share (%), by Country 2024 & 2032
- Figure 35: Europe Cable Connector Market Revenue (Million), by Type 2024 & 2032
- Figure 36: Europe Cable Connector Market Volume (K Unit), by Type 2024 & 2032
- Figure 37: Europe Cable Connector Market Revenue Share (%), by Type 2024 & 2032
- Figure 38: Europe Cable Connector Market Volume Share (%), by Type 2024 & 2032
- Figure 39: Europe Cable Connector Market Revenue (Million), by End-user Vertical 2024 & 2032
- Figure 40: Europe Cable Connector Market Volume (K Unit), by End-user Vertical 2024 & 2032
- Figure 41: Europe Cable Connector Market Revenue Share (%), by End-user Vertical 2024 & 2032
- Figure 42: Europe Cable Connector Market Volume Share (%), by End-user Vertical 2024 & 2032
- Figure 43: Europe Cable Connector Market Revenue (Million), by Country 2024 & 2032
- Figure 44: Europe Cable Connector Market Volume (K Unit), by Country 2024 & 2032
- Figure 45: Europe Cable Connector Market Revenue Share (%), by Country 2024 & 2032
- Figure 46: Europe Cable Connector Market Volume Share (%), by Country 2024 & 2032
- Figure 47: Asia Pacific Cable Connector Market Revenue (Million), by Type 2024 & 2032
- Figure 48: Asia Pacific Cable Connector Market Volume (K Unit), by Type 2024 & 2032
- Figure 49: Asia Pacific Cable Connector Market Revenue Share (%), by Type 2024 & 2032
- Figure 50: Asia Pacific Cable Connector Market Volume Share (%), by Type 2024 & 2032
- Figure 51: Asia Pacific Cable Connector Market Revenue (Million), by End-user Vertical 2024 & 2032
- Figure 52: Asia Pacific Cable Connector Market Volume (K Unit), by End-user Vertical 2024 & 2032
- Figure 53: Asia Pacific Cable Connector Market Revenue Share (%), by End-user Vertical 2024 & 2032
- Figure 54: Asia Pacific Cable Connector Market Volume Share (%), by End-user Vertical 2024 & 2032
- Figure 55: Asia Pacific Cable Connector Market Revenue (Million), by Country 2024 & 2032
- Figure 56: Asia Pacific Cable Connector Market Volume (K Unit), by Country 2024 & 2032
- Figure 57: Asia Pacific Cable Connector Market Revenue Share (%), by Country 2024 & 2032
- Figure 58: Asia Pacific Cable Connector Market Volume Share (%), by Country 2024 & 2032
- Figure 59: Latin America Cable Connector Market Revenue (Million), by Type 2024 & 2032
- Figure 60: Latin America Cable Connector Market Volume (K Unit), by Type 2024 & 2032
- Figure 61: Latin America Cable Connector Market Revenue Share (%), by Type 2024 & 2032
- Figure 62: Latin America Cable Connector Market Volume Share (%), by Type 2024 & 2032
- Figure 63: Latin America Cable Connector Market Revenue (Million), by End-user Vertical 2024 & 2032
- Figure 64: Latin America Cable Connector Market Volume (K Unit), by End-user Vertical 2024 & 2032
- Figure 65: Latin America Cable Connector Market Revenue Share (%), by End-user Vertical 2024 & 2032
- Figure 66: Latin America Cable Connector Market Volume Share (%), by End-user Vertical 2024 & 2032
- Figure 67: Latin America Cable Connector Market Revenue (Million), by Country 2024 & 2032
- Figure 68: Latin America Cable Connector Market Volume (K Unit), by Country 2024 & 2032
- Figure 69: Latin America Cable Connector Market Revenue Share (%), by Country 2024 & 2032
- Figure 70: Latin America Cable Connector Market Volume Share (%), by Country 2024 & 2032
- Figure 71: Middle East and Africa Cable Connector Market Revenue (Million), by Type 2024 & 2032
- Figure 72: Middle East and Africa Cable Connector Market Volume (K Unit), by Type 2024 & 2032
- Figure 73: Middle East and Africa Cable Connector Market Revenue Share (%), by Type 2024 & 2032
- Figure 74: Middle East and Africa Cable Connector Market Volume Share (%), by Type 2024 & 2032
- Figure 75: Middle East and Africa Cable Connector Market Revenue (Million), by End-user Vertical 2024 & 2032
- Figure 76: Middle East and Africa Cable Connector Market Volume (K Unit), by End-user Vertical 2024 & 2032
- Figure 77: Middle East and Africa Cable Connector Market Revenue Share (%), by End-user Vertical 2024 & 2032
- Figure 78: Middle East and Africa Cable Connector Market Volume Share (%), by End-user Vertical 2024 & 2032
- Figure 79: Middle East and Africa Cable Connector Market Revenue (Million), by Country 2024 & 2032
- Figure 80: Middle East and Africa Cable Connector Market Volume (K Unit), by Country 2024 & 2032
- Figure 81: Middle East and Africa Cable Connector Market Revenue Share (%), by Country 2024 & 2032
- Figure 82: Middle East and Africa Cable Connector Market Volume Share (%), by Country 2024 & 2032
List of Tables
- Table 1: Global Cable Connector Market Revenue Million Forecast, by Region 2019 & 2032
- Table 2: Global Cable Connector Market Volume K Unit Forecast, by Region 2019 & 2032
- Table 3: Global Cable Connector Market Revenue Million Forecast, by Type 2019 & 2032
- Table 4: Global Cable Connector Market Volume K Unit Forecast, by Type 2019 & 2032
- Table 5: Global Cable Connector Market Revenue Million Forecast, by End-user Vertical 2019 & 2032
- Table 6: Global Cable Connector Market Volume K Unit Forecast, by End-user Vertical 2019 & 2032
- Table 7: Global Cable Connector Market Revenue Million Forecast, by Region 2019 & 2032
- Table 8: Global Cable Connector Market Volume K Unit Forecast, by Region 2019 & 2032
- Table 9: Global Cable Connector Market Revenue Million Forecast, by Country 2019 & 2032
- Table 10: Global Cable Connector Market Volume K Unit Forecast, by Country 2019 & 2032
- Table 11: United States Cable Connector Market Revenue (Million) Forecast, by Application 2019 & 2032
- Table 12: United States Cable Connector Market Volume (K Unit) Forecast, by Application 2019 & 2032
- Table 13: Canada Cable Connector Market Revenue (Million) Forecast, by Application 2019 & 2032
- Table 14: Canada Cable Connector Market Volume (K Unit) Forecast, by Application 2019 & 2032
- Table 15: Mexico Cable Connector Market Revenue (Million) Forecast, by Application 2019 & 2032
- Table 16: Mexico Cable Connector Market Volume (K Unit) Forecast, by Application 2019 & 2032
- Table 17: Global Cable Connector Market Revenue Million Forecast, by Country 2019 & 2032
- Table 18: Global Cable Connector Market Volume K Unit Forecast, by Country 2019 & 2032
- Table 19: Germany Cable Connector Market Revenue (Million) Forecast, by Application 2019 & 2032
- Table 20: Germany Cable Connector Market Volume (K Unit) Forecast, by Application 2019 & 2032
- Table 21: United Kingdom Cable Connector Market Revenue (Million) Forecast, by Application 2019 & 2032
- Table 22: United Kingdom Cable Connector Market Volume (K Unit) Forecast, by Application 2019 & 2032
- Table 23: France Cable Connector Market Revenue (Million) Forecast, by Application 2019 & 2032
- Table 24: France Cable Connector Market Volume (K Unit) Forecast, by Application 2019 & 2032
- Table 25: Spain Cable Connector Market Revenue (Million) Forecast, by Application 2019 & 2032
- Table 26: Spain Cable Connector Market Volume (K Unit) Forecast, by Application 2019 & 2032
- Table 27: Italy Cable Connector Market Revenue (Million) Forecast, by Application 2019 & 2032
- Table 28: Italy Cable Connector Market Volume (K Unit) Forecast, by Application 2019 & 2032
- Table 29: Spain Cable Connector Market Revenue (Million) Forecast, by Application 2019 & 2032
- Table 30: Spain Cable Connector Market Volume (K Unit) Forecast, by Application 2019 & 2032
- Table 31: Belgium Cable Connector Market Revenue (Million) Forecast, by Application 2019 & 2032
- Table 32: Belgium Cable Connector Market Volume (K Unit) Forecast, by Application 2019 & 2032
- Table 33: Netherland Cable Connector Market Revenue (Million) Forecast, by Application 2019 & 2032
- Table 34: Netherland Cable Connector Market Volume (K Unit) Forecast, by Application 2019 & 2032
- Table 35: Nordics Cable Connector Market Revenue (Million) Forecast, by Application 2019 & 2032
- Table 36: Nordics Cable Connector Market Volume (K Unit) Forecast, by Application 2019 & 2032
- Table 37: Rest of Europe Cable Connector Market Revenue (Million) Forecast, by Application 2019 & 2032
- Table 38: Rest of Europe Cable Connector Market Volume (K Unit) Forecast, by Application 2019 & 2032
- Table 39: Global Cable Connector Market Revenue Million Forecast, by Country 2019 & 2032
- Table 40: Global Cable Connector Market Volume K Unit Forecast, by Country 2019 & 2032
- Table 41: China Cable Connector Market Revenue (Million) Forecast, by Application 2019 & 2032
- Table 42: China Cable Connector Market Volume (K Unit) Forecast, by Application 2019 & 2032
- Table 43: Japan Cable Connector Market Revenue (Million) Forecast, by Application 2019 & 2032
- Table 44: Japan Cable Connector Market Volume (K Unit) Forecast, by Application 2019 & 2032
- Table 45: India Cable Connector Market Revenue (Million) Forecast, by Application 2019 & 2032
- Table 46: India Cable Connector Market Volume (K Unit) Forecast, by Application 2019 & 2032
- Table 47: South Korea Cable Connector Market Revenue (Million) Forecast, by Application 2019 & 2032
- Table 48: South Korea Cable Connector Market Volume (K Unit) Forecast, by Application 2019 & 2032
- Table 49: Southeast Asia Cable Connector Market Revenue (Million) Forecast, by Application 2019 & 2032
- Table 50: Southeast Asia Cable Connector Market Volume (K Unit) Forecast, by Application 2019 & 2032
- Table 51: Australia Cable Connector Market Revenue (Million) Forecast, by Application 2019 & 2032
- Table 52: Australia Cable Connector Market Volume (K Unit) Forecast, by Application 2019 & 2032
- Table 53: Indonesia Cable Connector Market Revenue (Million) Forecast, by Application 2019 & 2032
- Table 54: Indonesia Cable Connector Market Volume (K Unit) Forecast, by Application 2019 & 2032
- Table 55: Phillipes Cable Connector Market Revenue (Million) Forecast, by Application 2019 & 2032
- Table 56: Phillipes Cable Connector Market Volume (K Unit) Forecast, by Application 2019 & 2032
- Table 57: Singapore Cable Connector Market Revenue (Million) Forecast, by Application 2019 & 2032
- Table 58: Singapore Cable Connector Market Volume (K Unit) Forecast, by Application 2019 & 2032
- Table 59: Thailandc Cable Connector Market Revenue (Million) Forecast, by Application 2019 & 2032
- Table 60: Thailandc Cable Connector Market Volume (K Unit) Forecast, by Application 2019 & 2032
- Table 61: Rest of Asia Pacific Cable Connector Market Revenue (Million) Forecast, by Application 2019 & 2032
- Table 62: Rest of Asia Pacific Cable Connector Market Volume (K Unit) Forecast, by Application 2019 & 2032
- Table 63: Global Cable Connector Market Revenue Million Forecast, by Country 2019 & 2032
- Table 64: Global Cable Connector Market Volume K Unit Forecast, by Country 2019 & 2032
- Table 65: Brazil Cable Connector Market Revenue (Million) Forecast, by Application 2019 & 2032
- Table 66: Brazil Cable Connector Market Volume (K Unit) Forecast, by Application 2019 & 2032
- Table 67: Argentina Cable Connector Market Revenue (Million) Forecast, by Application 2019 & 2032
- Table 68: Argentina Cable Connector Market Volume (K Unit) Forecast, by Application 2019 & 2032
- Table 69: Peru Cable Connector Market Revenue (Million) Forecast, by Application 2019 & 2032
- Table 70: Peru Cable Connector Market Volume (K Unit) Forecast, by Application 2019 & 2032
- Table 71: Chile Cable Connector Market Revenue (Million) Forecast, by Application 2019 & 2032
- Table 72: Chile Cable Connector Market Volume (K Unit) Forecast, by Application 2019 & 2032
- Table 73: Colombia Cable Connector Market Revenue (Million) Forecast, by Application 2019 & 2032
- Table 74: Colombia Cable Connector Market Volume (K Unit) Forecast, by Application 2019 & 2032
- Table 75: Ecuador Cable Connector Market Revenue (Million) Forecast, by Application 2019 & 2032
- Table 76: Ecuador Cable Connector Market Volume (K Unit) Forecast, by Application 2019 & 2032
- Table 77: Venezuela Cable Connector Market Revenue (Million) Forecast, by Application 2019 & 2032
- Table 78: Venezuela Cable Connector Market Volume (K Unit) Forecast, by Application 2019 & 2032
- Table 79: Rest of South America Cable Connector Market Revenue (Million) Forecast, by Application 2019 & 2032
- Table 80: Rest of South America Cable Connector Market Volume (K Unit) Forecast, by Application 2019 & 2032
- Table 81: Global Cable Connector Market Revenue Million Forecast, by Country 2019 & 2032
- Table 82: Global Cable Connector Market Volume K Unit Forecast, by Country 2019 & 2032
- Table 83: United Arab Emirates Cable Connector Market Revenue (Million) Forecast, by Application 2019 & 2032
- Table 84: United Arab Emirates Cable Connector Market Volume (K Unit) Forecast, by Application 2019 & 2032
- Table 85: Saudi Arabia Cable Connector Market Revenue (Million) Forecast, by Application 2019 & 2032
- Table 86: Saudi Arabia Cable Connector Market Volume (K Unit) Forecast, by Application 2019 & 2032
- Table 87: South Africa Cable Connector Market Revenue (Million) Forecast, by Application 2019 & 2032
- Table 88: South Africa Cable Connector Market Volume (K Unit) Forecast, by Application 2019 & 2032
- Table 89: Rest of Middle East and Africa Cable Connector Market Revenue (Million) Forecast, by Application 2019 & 2032
- Table 90: Rest of Middle East and Africa Cable Connector Market Volume (K Unit) Forecast, by Application 2019 & 2032
- Table 91: Global Cable Connector Market Revenue Million Forecast, by Type 2019 & 2032
- Table 92: Global Cable Connector Market Volume K Unit Forecast, by Type 2019 & 2032
- Table 93: Global Cable Connector Market Revenue Million Forecast, by End-user Vertical 2019 & 2032
- Table 94: Global Cable Connector Market Volume K Unit Forecast, by End-user Vertical 2019 & 2032
- Table 95: Global Cable Connector Market Revenue Million Forecast, by Country 2019 & 2032
- Table 96: Global Cable Connector Market Volume K Unit Forecast, by Country 2019 & 2032
- Table 97: Global Cable Connector Market Revenue Million Forecast, by Type 2019 & 2032
- Table 98: Global Cable Connector Market Volume K Unit Forecast, by Type 2019 & 2032
- Table 99: Global Cable Connector Market Revenue Million Forecast, by End-user Vertical 2019 & 2032
- Table 100: Global Cable Connector Market Volume K Unit Forecast, by End-user Vertical 2019 & 2032
- Table 101: Global Cable Connector Market Revenue Million Forecast, by Country 2019 & 2032
- Table 102: Global Cable Connector Market Volume K Unit Forecast, by Country 2019 & 2032
- Table 103: Global Cable Connector Market Revenue Million Forecast, by Type 2019 & 2032
- Table 104: Global Cable Connector Market Volume K Unit Forecast, by Type 2019 & 2032
- Table 105: Global Cable Connector Market Revenue Million Forecast, by End-user Vertical 2019 & 2032
- Table 106: Global Cable Connector Market Volume K Unit Forecast, by End-user Vertical 2019 & 2032
- Table 107: Global Cable Connector Market Revenue Million Forecast, by Country 2019 & 2032
- Table 108: Global Cable Connector Market Volume K Unit Forecast, by Country 2019 & 2032
- Table 109: Global Cable Connector Market Revenue Million Forecast, by Type 2019 & 2032
- Table 110: Global Cable Connector Market Volume K Unit Forecast, by Type 2019 & 2032
- Table 111: Global Cable Connector Market Revenue Million Forecast, by End-user Vertical 2019 & 2032
- Table 112: Global Cable Connector Market Volume K Unit Forecast, by End-user Vertical 2019 & 2032
- Table 113: Global Cable Connector Market Revenue Million Forecast, by Country 2019 & 2032
- Table 114: Global Cable Connector Market Volume K Unit Forecast, by Country 2019 & 2032
- Table 115: Global Cable Connector Market Revenue Million Forecast, by Type 2019 & 2032
- Table 116: Global Cable Connector Market Volume K Unit Forecast, by Type 2019 & 2032
- Table 117: Global Cable Connector Market Revenue Million Forecast, by End-user Vertical 2019 & 2032
- Table 118: Global Cable Connector Market Volume K Unit Forecast, by End-user Vertical 2019 & 2032
- Table 119: Global Cable Connector Market Revenue Million Forecast, by Country 2019 & 2032
- Table 120: Global Cable Connector Market Volume K Unit Forecast, by Country 2019 & 2032
Frequently Asked Questions
1. What is the projected Compound Annual Growth Rate (CAGR) of the Cable Connector Market?
The projected CAGR is approximately 7.30%.
2. Which companies are prominent players in the Cable Connector Market?
Key companies in the market include Axon Cable SAS, Huber+Suhner AG, Nexans SA, Molex Inc (Koch Industries), Aptiv PLC, Prysmian SpA, 3M Company, Fujitsu Limited, Amphenol Corporation, Huawei Technologies Co Ltd, TE Connectivity Limited, Yazaki Corporation, Alcatel-Lucent SA.
3. What are the main segments of the Cable Connector Market?
The market segments include Type, End-user Vertical.
4. Can you provide details about the market size?
The market size is estimated to be USD 102.81 Million as of 2022.
5. What are some drivers contributing to market growth?
Growing Advancements In The Telecom Sector Coupled With Greater Demand for Improved Connectivity; Increasing Demand for High Bandwidth.
6. What are the notable trends driving market growth?
Automotive Sector is Expected to Hold Significant Market Share.
7. Are there any restraints impacting market growth?
Fragmentation in the Regional Markets; Volatility in Raw Material Prices.
8. Can you provide examples of recent developments in the market?
November 2021 - TE Connectivity announced the launch of new connectors that are designed to work with robots and UAVs. To protect the unit from extreme environments, the connector is encased in a high-temperature rated plastic assembly. The connector is also outfitted with contact position locks to secure the housing during high and frequent vibration events.
9. What pricing options are available for accessing the report?
Pricing options include single-user, multi-user, and enterprise licenses priced at USD 4750, USD 5250, and USD 8750 respectively.
10. Is the market size provided in terms of value or volume?
The market size is provided in terms of value, measured in Million and volume, measured in K Unit.
11. Are there any specific market keywords associated with the report?
Yes, the market keyword associated with the report is "Cable Connector Market," which aids in identifying and referencing the specific market segment covered.
12. How do I determine which pricing option suits my needs best?
The pricing options vary based on user requirements and access needs. Individual users may opt for single-user licenses, while businesses requiring broader access may choose multi-user or enterprise licenses for cost-effective access to the report.
13. Are there any additional resources or data provided in the Cable Connector Market report?
While the report offers comprehensive insights, it's advisable to review the specific contents or supplementary materials provided to ascertain if additional resources or data are available.
14. How can I stay updated on further developments or reports in the Cable Connector Market?
To stay informed about further developments, trends, and reports in the Cable Connector Market, consider subscribing to industry newsletters, following relevant companies and organizations, or regularly checking reputable industry news sources and publications.
Methodology
Step 1 - Identification of Relevant Samples Size from Population Database


Step 2 - Approaches for Defining Global Market Size (Value, Volume* & Price*)

Note*: In applicable scenarios
Step 3 - Data Sources
Primary Research
- Web Analytics
- Survey Reports
- Research Institute
- Latest Research Reports
- Opinion Leaders
Secondary Research
- Annual Reports
- White Paper
- Latest Press Release
- Industry Association
- Paid Database
- Investor Presentations

Step 4 - Data Triangulation
Involves using different sources of information in order to increase the validity of a study
These sources are likely to be stakeholders in a program - participants, other researchers, program staff, other community members, and so on.
Then we put all data in single framework & apply various statistical tools to find out the dynamic on the market.
During the analysis stage, feedback from the stakeholder groups would be compared to determine areas of agreement as well as areas of divergence


