
Key Insights
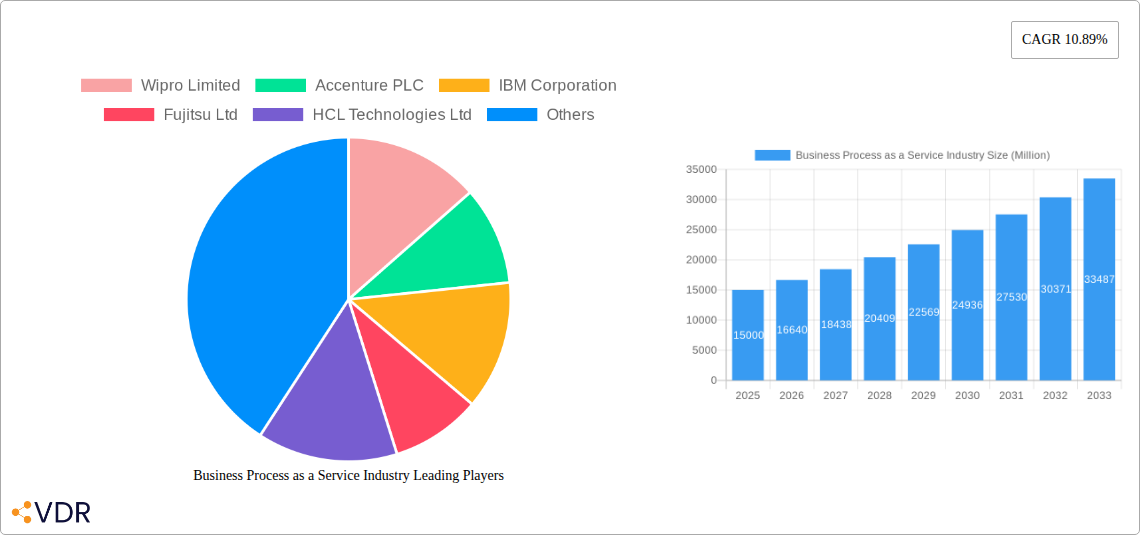
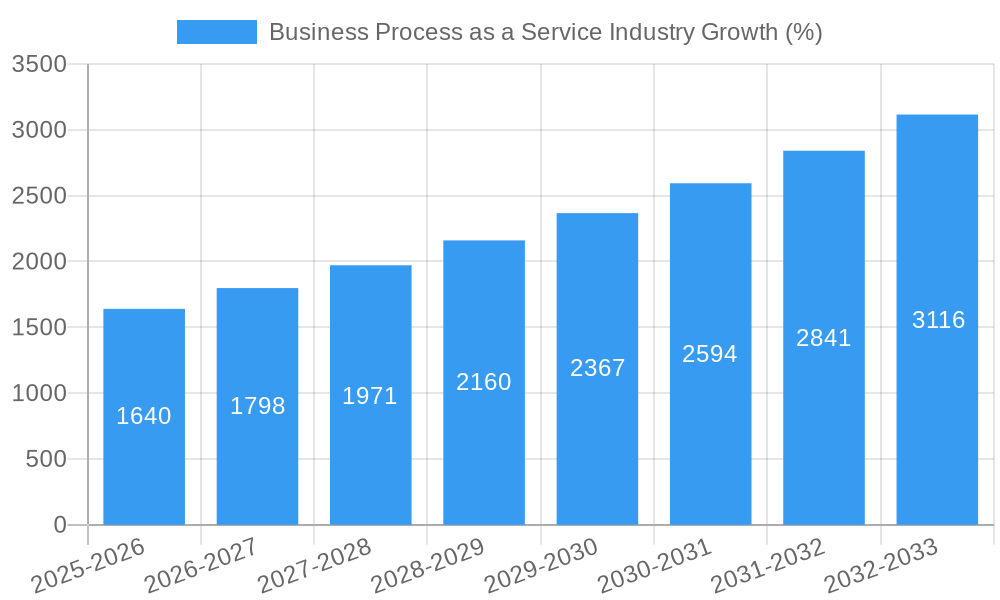
The Business Process as a Service (BPaaS) market is experiencing robust growth, projected to maintain a Compound Annual Growth Rate (CAGR) of 10.89% from 2025 to 2033. This expansion is fueled by several key drivers. The increasing adoption of cloud-based technologies allows businesses to outsource non-core functions, enhancing efficiency and reducing operational costs. Furthermore, the growing demand for improved agility and scalability is driving organizations towards BPaaS solutions. The shift towards digital transformation across diverse sectors, including government, BFSI, IT, healthcare, and retail, contributes significantly to the market's expansion. Larger enterprises are leading the adoption, driven by their need to manage complex processes and optimize resource allocation. However, challenges remain, including data security concerns and the need for robust integration capabilities with existing IT infrastructure. The market is segmented by end-user industry, organizational size, and process type, reflecting the diverse applications of BPaaS. Specific process areas like Human Resource Management, Accounting and Finance, and Supply Chain Management are experiencing particularly strong growth, driven by the need for automation and enhanced efficiency in these critical functions. The competitive landscape includes major players like Wipro, Accenture, IBM, and TCS, who are continuously innovating to maintain their market share. Geographical distribution showcases strong growth across North America and Asia Pacific, fueled by the high concentration of technology hubs and the increasing adoption of digital transformation strategies.
The forecast period (2025-2033) suggests a continuous upward trend for the BPaaS market, with North America and Asia Pacific expected to retain their dominant positions. Increased investment in R&D to improve service offerings and accommodate emerging technologies like AI and machine learning will likely contribute to this growth. However, factors like fluctuating economic conditions and competition from other outsourcing models could present challenges. The ongoing need for specialized expertise, particularly in managing the security and integration aspects of BPaaS, presents opportunities for service providers specializing in these areas. The market's future trajectory hinges on sustained technological advancements, the growing adoption of cloud computing, and the ongoing efforts of BPaaS providers to address the challenges and leverage the opportunities presented by a rapidly evolving digital landscape.
Business Process as a Service (BPaaS) Industry Market Report: 2019-2033
This comprehensive report provides a detailed analysis of the Business Process as a Service (BPaaS) industry, encompassing market dynamics, growth trends, regional segmentation, product landscape, key players, and future outlook. The study period covers 2019-2033, with a base year of 2025 and a forecast period of 2025-2033. The report's in-depth analysis leverages extensive data and insights to offer valuable intelligence for industry professionals, investors, and strategic decision-makers. The total market size in 2025 is estimated at XXX Million.
Business Process as a Service Industry Market Dynamics & Structure
The BPaaS market is characterized by a moderately concentrated landscape with a few dominant players and numerous smaller niche providers. Technological innovation, particularly in AI, automation, and cloud computing, is a key driver. Regulatory frameworks, including data privacy regulations (e.g., GDPR), significantly impact market operations. Competitive substitutes include in-house process management and other outsourcing models. End-user demographics are diverse, spanning various industries and organizational sizes. M&A activity remains significant, with larger players consolidating market share.
- Market Concentration: Top 10 players hold approximately 60% market share in 2025.
- Technological Innovation: AI, automation, and cloud technologies are driving efficiency and cost reduction.
- Regulatory Landscape: Data privacy regulations influence service delivery and security protocols.
- M&A Activity: xx M&A deals were recorded in the historical period (2019-2024), consolidating market share among major players.
- Innovation Barriers: High initial investment costs and integration complexities can hinder innovation adoption.
Business Process as a Service Industry Growth Trends & Insights
The BPaaS market witnessed robust growth during the historical period (2019-2024), with a CAGR of xx%. This growth is fueled by increasing digital transformation initiatives across industries, the need for enhanced operational efficiency, and the rising adoption of cloud-based solutions. The market is expected to continue its expansion during the forecast period (2025-2033), driven by technological advancements and evolving consumer behavior, including a greater reliance on outsourcing for non-core functions. Market penetration in key segments, such as BFSI and Healthcare, is expected to increase significantly. Technological disruptions, such as the rise of hyperautomation, are reshaping the industry.
The market is expected to reach xx Million by 2033, representing a CAGR of xx% during the forecast period.
Dominant Regions, Countries, or Segments in Business Process as a Service Industry
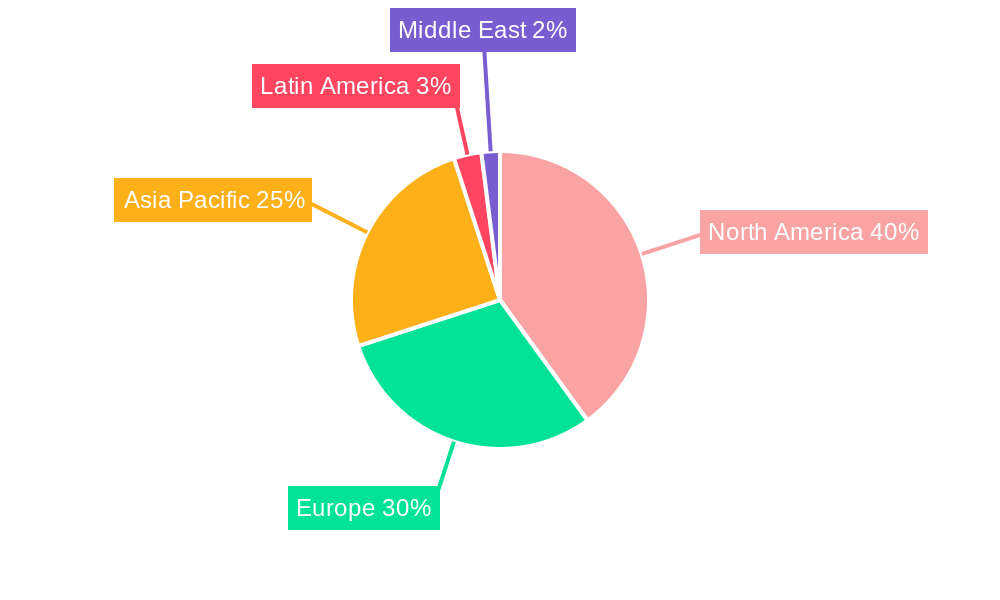
North America and Europe currently dominate the BPaaS market, driven by high adoption rates in large enterprises and a mature technological infrastructure. However, the Asia-Pacific region is experiencing rapid growth, fueled by increasing outsourcing and a large pool of skilled labor. Within industry segments, BFSI and IT & Telecommunication are the largest contributors, showcasing significant demand for BPaaS solutions. Large enterprises account for a larger market share due to their greater resources and complex operational needs. Human Resource Management and Accounting & Finance are dominant process segments.
- Leading Region: North America
- Fastest-Growing Region: Asia-Pacific
- Largest Industry Segment: BFSI
- Largest Organizational Segment: Large Enterprises
- Largest Process Segment: Accounting and Finance
Business Process as a Service Industry Product Landscape
BPaaS solutions are evolving rapidly, incorporating AI, machine learning, and robotic process automation (RPA) to enhance efficiency, accuracy, and scalability. These solutions offer various functionalities, including automation of repetitive tasks, data analytics, and improved customer experience. Key performance indicators (KPIs) include cost reduction, process efficiency gains, and error rate minimization. Unique selling propositions include tailored solutions, flexible pricing models, and guaranteed service level agreements (SLAs).
Key Drivers, Barriers & Challenges in Business Process as a Service Industry
Key Drivers:
- Increasing demand for operational efficiency and cost reduction.
- Growing adoption of cloud-based technologies.
- Rise of AI and automation solutions.
- Favorable government policies promoting digital transformation.
Key Challenges:
- Data security and privacy concerns.
- Integration complexities with existing systems.
- Lack of skilled workforce in some regions.
- Intense competition among providers.
- xx% of companies report challenges in integrating BPaaS solutions with legacy systems.
Emerging Opportunities in Business Process as a Service Industry
- Expansion into untapped markets in developing economies.
- Development of specialized BPaaS solutions for niche industries.
- Growing demand for AI-powered process optimization tools.
- Increased focus on sustainability and ESG considerations.
Growth Accelerators in the Business Process as a Service Industry
Technological breakthroughs in AI, automation, and cloud computing continue to fuel BPaaS market expansion. Strategic partnerships and alliances between technology providers and BPaaS companies are broadening service offerings and strengthening market presence. Market expansion strategies focusing on emerging economies and underserved industries present substantial growth opportunities. A shift towards outcome-based pricing models is increasing the attractiveness of BPaaS for businesses.
Key Players Shaping the Business Process as a Service Industry Market
- Wipro Limited
- Accenture PLC
- IBM Corporation
- Fujitsu Ltd
- HCL Technologies Ltd
- Tata Consultancy Services Limited
- Oracle Corporation
- Capgemini SE
- Cognizant Technology Solutions
- Genpact Limited
Notable Milestones in Business Process as a Service Industry Sector
- November 2022: Infosys BPM and IBM launch an AI and automation center in Poland.
- May 2022: Oracle integrates enhanced threat management into its cloud security capabilities.
- April 2022: Fujitsu launches its Fujitsu Computing as a Service (CaaS) portfolio.
- March 2022: Oracle Cloud Infrastructure launches new services and capabilities.
In-Depth Business Process as a Service Industry Market Outlook
The BPaaS market is poised for sustained growth, driven by continuous technological advancements and increasing demand for streamlined business operations across diverse industries. Strategic partnerships, expansion into emerging markets, and the development of innovative AI-powered solutions will be crucial for future success. The focus on outcome-based pricing and enhanced security measures will further shape market dynamics, creating new opportunities for both established and emerging players. The market's long-term potential is substantial, with significant growth expected across various regions and segments.
Business Process as a Service Industry Segmentation
-
1. Size of Organization
- 1.1. Small and Medium Organizations
- 1.2. Large Enterprises
-
2. Process
- 2.1. Human Resource Management
- 2.2. Accounting and Finance
- 2.3. Sales and Marketing
- 2.4. Supply Chain Management
- 2.5. Other Processes
-
3. End-user Industry
- 3.1. Government and Defense
- 3.2. Banking, Financial Services and Insurance (BFSI)
- 3.3. IT and Telecommunication
- 3.4. Healthcare
- 3.5. Retail
- 3.6. Manufacturing
- 3.7. Other End-user Industries
Business Process as a Service Industry Segmentation By Geography
-
1. North America
- 1.1. United States
- 1.2. Canada
-
2. Europe
- 2.1. United Kingdom
- 2.2. Germany
- 2.3. France
- 2.4. Rest of Europe
-
3. Asia Pacific
- 3.1. China
- 3.2. India
- 3.3. Japan
- 3.4. Rest of Asia Pacific
- 4. Latin America
- 5. Middle East
Business Process as a Service Industry REPORT HIGHLIGHTS
| Aspects | Details |
|---|---|
| Study Period | 2019-2033 |
| Base Year | 2024 |
| Estimated Year | 2025 |
| Forecast Period | 2025-2033 |
| Historical Period | 2019-2024 |
| Growth Rate | CAGR of 10.89% from 2019-2033 |
| Segmentation |
|
Table of Contents
- 1. Introduction
- 1.1. Research Scope
- 1.2. Market Segmentation
- 1.3. Research Methodology
- 1.4. Definitions and Assumptions
- 2. Executive Summary
- 2.1. Introduction
- 3. Market Dynamics
- 3.1. Introduction
- 3.2. Market Drivers
- 3.2.1. Growing Demand for Cloud Services and Standard Operating Processes; Rising Need for the Reduction of Operational Costs and Improvement of Productivity
- 3.3. Market Restrains
- 3.3.1. Managing Regulatory and Compliance Needs Across the World
- 3.4. Market Trends
- 3.4.1. Reduction of Operational Costs and Productivity Improvement to Drive the Market
- 4. Market Factor Analysis
- 4.1. Porters Five Forces
- 4.2. Supply/Value Chain
- 4.3. PESTEL analysis
- 4.4. Market Entropy
- 4.5. Patent/Trademark Analysis
- 5. Global Business Process as a Service Industry Analysis, Insights and Forecast, 2019-2031
- 5.1. Market Analysis, Insights and Forecast - by Size of Organization
- 5.1.1. Small and Medium Organizations
- 5.1.2. Large Enterprises
- 5.2. Market Analysis, Insights and Forecast - by Process
- 5.2.1. Human Resource Management
- 5.2.2. Accounting and Finance
- 5.2.3. Sales and Marketing
- 5.2.4. Supply Chain Management
- 5.2.5. Other Processes
- 5.3. Market Analysis, Insights and Forecast - by End-user Industry
- 5.3.1. Government and Defense
- 5.3.2. Banking, Financial Services and Insurance (BFSI)
- 5.3.3. IT and Telecommunication
- 5.3.4. Healthcare
- 5.3.5. Retail
- 5.3.6. Manufacturing
- 5.3.7. Other End-user Industries
- 5.4. Market Analysis, Insights and Forecast - by Region
- 5.4.1. North America
- 5.4.2. Europe
- 5.4.3. Asia Pacific
- 5.4.4. Latin America
- 5.4.5. Middle East
- 5.1. Market Analysis, Insights and Forecast - by Size of Organization
- 6. North America Business Process as a Service Industry Analysis, Insights and Forecast, 2019-2031
- 6.1. Market Analysis, Insights and Forecast - by Size of Organization
- 6.1.1. Small and Medium Organizations
- 6.1.2. Large Enterprises
- 6.2. Market Analysis, Insights and Forecast - by Process
- 6.2.1. Human Resource Management
- 6.2.2. Accounting and Finance
- 6.2.3. Sales and Marketing
- 6.2.4. Supply Chain Management
- 6.2.5. Other Processes
- 6.3. Market Analysis, Insights and Forecast - by End-user Industry
- 6.3.1. Government and Defense
- 6.3.2. Banking, Financial Services and Insurance (BFSI)
- 6.3.3. IT and Telecommunication
- 6.3.4. Healthcare
- 6.3.5. Retail
- 6.3.6. Manufacturing
- 6.3.7. Other End-user Industries
- 6.1. Market Analysis, Insights and Forecast - by Size of Organization
- 7. Europe Business Process as a Service Industry Analysis, Insights and Forecast, 2019-2031
- 7.1. Market Analysis, Insights and Forecast - by Size of Organization
- 7.1.1. Small and Medium Organizations
- 7.1.2. Large Enterprises
- 7.2. Market Analysis, Insights and Forecast - by Process
- 7.2.1. Human Resource Management
- 7.2.2. Accounting and Finance
- 7.2.3. Sales and Marketing
- 7.2.4. Supply Chain Management
- 7.2.5. Other Processes
- 7.3. Market Analysis, Insights and Forecast - by End-user Industry
- 7.3.1. Government and Defense
- 7.3.2. Banking, Financial Services and Insurance (BFSI)
- 7.3.3. IT and Telecommunication
- 7.3.4. Healthcare
- 7.3.5. Retail
- 7.3.6. Manufacturing
- 7.3.7. Other End-user Industries
- 7.1. Market Analysis, Insights and Forecast - by Size of Organization
- 8. Asia Pacific Business Process as a Service Industry Analysis, Insights and Forecast, 2019-2031
- 8.1. Market Analysis, Insights and Forecast - by Size of Organization
- 8.1.1. Small and Medium Organizations
- 8.1.2. Large Enterprises
- 8.2. Market Analysis, Insights and Forecast - by Process
- 8.2.1. Human Resource Management
- 8.2.2. Accounting and Finance
- 8.2.3. Sales and Marketing
- 8.2.4. Supply Chain Management
- 8.2.5. Other Processes
- 8.3. Market Analysis, Insights and Forecast - by End-user Industry
- 8.3.1. Government and Defense
- 8.3.2. Banking, Financial Services and Insurance (BFSI)
- 8.3.3. IT and Telecommunication
- 8.3.4. Healthcare
- 8.3.5. Retail
- 8.3.6. Manufacturing
- 8.3.7. Other End-user Industries
- 8.1. Market Analysis, Insights and Forecast - by Size of Organization
- 9. Latin America Business Process as a Service Industry Analysis, Insights and Forecast, 2019-2031
- 9.1. Market Analysis, Insights and Forecast - by Size of Organization
- 9.1.1. Small and Medium Organizations
- 9.1.2. Large Enterprises
- 9.2. Market Analysis, Insights and Forecast - by Process
- 9.2.1. Human Resource Management
- 9.2.2. Accounting and Finance
- 9.2.3. Sales and Marketing
- 9.2.4. Supply Chain Management
- 9.2.5. Other Processes
- 9.3. Market Analysis, Insights and Forecast - by End-user Industry
- 9.3.1. Government and Defense
- 9.3.2. Banking, Financial Services and Insurance (BFSI)
- 9.3.3. IT and Telecommunication
- 9.3.4. Healthcare
- 9.3.5. Retail
- 9.3.6. Manufacturing
- 9.3.7. Other End-user Industries
- 9.1. Market Analysis, Insights and Forecast - by Size of Organization
- 10. Middle East Business Process as a Service Industry Analysis, Insights and Forecast, 2019-2031
- 10.1. Market Analysis, Insights and Forecast - by Size of Organization
- 10.1.1. Small and Medium Organizations
- 10.1.2. Large Enterprises
- 10.2. Market Analysis, Insights and Forecast - by Process
- 10.2.1. Human Resource Management
- 10.2.2. Accounting and Finance
- 10.2.3. Sales and Marketing
- 10.2.4. Supply Chain Management
- 10.2.5. Other Processes
- 10.3. Market Analysis, Insights and Forecast - by End-user Industry
- 10.3.1. Government and Defense
- 10.3.2. Banking, Financial Services and Insurance (BFSI)
- 10.3.3. IT and Telecommunication
- 10.3.4. Healthcare
- 10.3.5. Retail
- 10.3.6. Manufacturing
- 10.3.7. Other End-user Industries
- 10.1. Market Analysis, Insights and Forecast - by Size of Organization
- 11. North America Business Process as a Service Industry Analysis, Insights and Forecast, 2019-2031
- 11.1. Market Analysis, Insights and Forecast - By Country/Sub-region
- 11.1.1 United States
- 11.1.2 Canada
- 12. Europe Business Process as a Service Industry Analysis, Insights and Forecast, 2019-2031
- 12.1. Market Analysis, Insights and Forecast - By Country/Sub-region
- 12.1.1 United Kingdom
- 12.1.2 Germany
- 12.1.3 France
- 12.1.4 Rest of Europe
- 13. Asia Pacific Business Process as a Service Industry Analysis, Insights and Forecast, 2019-2031
- 13.1. Market Analysis, Insights and Forecast - By Country/Sub-region
- 13.1.1 China
- 13.1.2 India
- 13.1.3 Japan
- 13.1.4 Rest of Asia Pacific
- 14. Latin America Business Process as a Service Industry Analysis, Insights and Forecast, 2019-2031
- 14.1. Market Analysis, Insights and Forecast - By Country/Sub-region
- 14.1.1.
- 15. Middle East Business Process as a Service Industry Analysis, Insights and Forecast, 2019-2031
- 15.1. Market Analysis, Insights and Forecast - By Country/Sub-region
- 15.1.1.
- 16. Competitive Analysis
- 16.1. Global Market Share Analysis 2024
- 16.2. Company Profiles
- 16.2.1 Wipro Limited
- 16.2.1.1. Overview
- 16.2.1.2. Products
- 16.2.1.3. SWOT Analysis
- 16.2.1.4. Recent Developments
- 16.2.1.5. Financials (Based on Availability)
- 16.2.2 Accenture PLC
- 16.2.2.1. Overview
- 16.2.2.2. Products
- 16.2.2.3. SWOT Analysis
- 16.2.2.4. Recent Developments
- 16.2.2.5. Financials (Based on Availability)
- 16.2.3 IBM Corporation
- 16.2.3.1. Overview
- 16.2.3.2. Products
- 16.2.3.3. SWOT Analysis
- 16.2.3.4. Recent Developments
- 16.2.3.5. Financials (Based on Availability)
- 16.2.4 Fujitsu Ltd
- 16.2.4.1. Overview
- 16.2.4.2. Products
- 16.2.4.3. SWOT Analysis
- 16.2.4.4. Recent Developments
- 16.2.4.5. Financials (Based on Availability)
- 16.2.5 HCL Technologies Ltd
- 16.2.5.1. Overview
- 16.2.5.2. Products
- 16.2.5.3. SWOT Analysis
- 16.2.5.4. Recent Developments
- 16.2.5.5. Financials (Based on Availability)
- 16.2.6 Tata Consultancy Services Limited
- 16.2.6.1. Overview
- 16.2.6.2. Products
- 16.2.6.3. SWOT Analysis
- 16.2.6.4. Recent Developments
- 16.2.6.5. Financials (Based on Availability)
- 16.2.7 Oracle Corporation
- 16.2.7.1. Overview
- 16.2.7.2. Products
- 16.2.7.3. SWOT Analysis
- 16.2.7.4. Recent Developments
- 16.2.7.5. Financials (Based on Availability)
- 16.2.8 Capgemini SE*List Not Exhaustive
- 16.2.8.1. Overview
- 16.2.8.2. Products
- 16.2.8.3. SWOT Analysis
- 16.2.8.4. Recent Developments
- 16.2.8.5. Financials (Based on Availability)
- 16.2.9 Cognizant Technology Solutions
- 16.2.9.1. Overview
- 16.2.9.2. Products
- 16.2.9.3. SWOT Analysis
- 16.2.9.4. Recent Developments
- 16.2.9.5. Financials (Based on Availability)
- 16.2.10 Genpact Limited
- 16.2.10.1. Overview
- 16.2.10.2. Products
- 16.2.10.3. SWOT Analysis
- 16.2.10.4. Recent Developments
- 16.2.10.5. Financials (Based on Availability)
- 16.2.1 Wipro Limited
List of Figures
- Figure 1: Global Business Process as a Service Industry Revenue Breakdown (Million, %) by Region 2024 & 2032
- Figure 2: North America Business Process as a Service Industry Revenue (Million), by Country 2024 & 2032
- Figure 3: North America Business Process as a Service Industry Revenue Share (%), by Country 2024 & 2032
- Figure 4: Europe Business Process as a Service Industry Revenue (Million), by Country 2024 & 2032
- Figure 5: Europe Business Process as a Service Industry Revenue Share (%), by Country 2024 & 2032
- Figure 6: Asia Pacific Business Process as a Service Industry Revenue (Million), by Country 2024 & 2032
- Figure 7: Asia Pacific Business Process as a Service Industry Revenue Share (%), by Country 2024 & 2032
- Figure 8: Latin America Business Process as a Service Industry Revenue (Million), by Country 2024 & 2032
- Figure 9: Latin America Business Process as a Service Industry Revenue Share (%), by Country 2024 & 2032
- Figure 10: Middle East Business Process as a Service Industry Revenue (Million), by Country 2024 & 2032
- Figure 11: Middle East Business Process as a Service Industry Revenue Share (%), by Country 2024 & 2032
- Figure 12: North America Business Process as a Service Industry Revenue (Million), by Size of Organization 2024 & 2032
- Figure 13: North America Business Process as a Service Industry Revenue Share (%), by Size of Organization 2024 & 2032
- Figure 14: North America Business Process as a Service Industry Revenue (Million), by Process 2024 & 2032
- Figure 15: North America Business Process as a Service Industry Revenue Share (%), by Process 2024 & 2032
- Figure 16: North America Business Process as a Service Industry Revenue (Million), by End-user Industry 2024 & 2032
- Figure 17: North America Business Process as a Service Industry Revenue Share (%), by End-user Industry 2024 & 2032
- Figure 18: North America Business Process as a Service Industry Revenue (Million), by Country 2024 & 2032
- Figure 19: North America Business Process as a Service Industry Revenue Share (%), by Country 2024 & 2032
- Figure 20: Europe Business Process as a Service Industry Revenue (Million), by Size of Organization 2024 & 2032
- Figure 21: Europe Business Process as a Service Industry Revenue Share (%), by Size of Organization 2024 & 2032
- Figure 22: Europe Business Process as a Service Industry Revenue (Million), by Process 2024 & 2032
- Figure 23: Europe Business Process as a Service Industry Revenue Share (%), by Process 2024 & 2032
- Figure 24: Europe Business Process as a Service Industry Revenue (Million), by End-user Industry 2024 & 2032
- Figure 25: Europe Business Process as a Service Industry Revenue Share (%), by End-user Industry 2024 & 2032
- Figure 26: Europe Business Process as a Service Industry Revenue (Million), by Country 2024 & 2032
- Figure 27: Europe Business Process as a Service Industry Revenue Share (%), by Country 2024 & 2032
- Figure 28: Asia Pacific Business Process as a Service Industry Revenue (Million), by Size of Organization 2024 & 2032
- Figure 29: Asia Pacific Business Process as a Service Industry Revenue Share (%), by Size of Organization 2024 & 2032
- Figure 30: Asia Pacific Business Process as a Service Industry Revenue (Million), by Process 2024 & 2032
- Figure 31: Asia Pacific Business Process as a Service Industry Revenue Share (%), by Process 2024 & 2032
- Figure 32: Asia Pacific Business Process as a Service Industry Revenue (Million), by End-user Industry 2024 & 2032
- Figure 33: Asia Pacific Business Process as a Service Industry Revenue Share (%), by End-user Industry 2024 & 2032
- Figure 34: Asia Pacific Business Process as a Service Industry Revenue (Million), by Country 2024 & 2032
- Figure 35: Asia Pacific Business Process as a Service Industry Revenue Share (%), by Country 2024 & 2032
- Figure 36: Latin America Business Process as a Service Industry Revenue (Million), by Size of Organization 2024 & 2032
- Figure 37: Latin America Business Process as a Service Industry Revenue Share (%), by Size of Organization 2024 & 2032
- Figure 38: Latin America Business Process as a Service Industry Revenue (Million), by Process 2024 & 2032
- Figure 39: Latin America Business Process as a Service Industry Revenue Share (%), by Process 2024 & 2032
- Figure 40: Latin America Business Process as a Service Industry Revenue (Million), by End-user Industry 2024 & 2032
- Figure 41: Latin America Business Process as a Service Industry Revenue Share (%), by End-user Industry 2024 & 2032
- Figure 42: Latin America Business Process as a Service Industry Revenue (Million), by Country 2024 & 2032
- Figure 43: Latin America Business Process as a Service Industry Revenue Share (%), by Country 2024 & 2032
- Figure 44: Middle East Business Process as a Service Industry Revenue (Million), by Size of Organization 2024 & 2032
- Figure 45: Middle East Business Process as a Service Industry Revenue Share (%), by Size of Organization 2024 & 2032
- Figure 46: Middle East Business Process as a Service Industry Revenue (Million), by Process 2024 & 2032
- Figure 47: Middle East Business Process as a Service Industry Revenue Share (%), by Process 2024 & 2032
- Figure 48: Middle East Business Process as a Service Industry Revenue (Million), by End-user Industry 2024 & 2032
- Figure 49: Middle East Business Process as a Service Industry Revenue Share (%), by End-user Industry 2024 & 2032
- Figure 50: Middle East Business Process as a Service Industry Revenue (Million), by Country 2024 & 2032
- Figure 51: Middle East Business Process as a Service Industry Revenue Share (%), by Country 2024 & 2032
List of Tables
- Table 1: Global Business Process as a Service Industry Revenue Million Forecast, by Region 2019 & 2032
- Table 2: Global Business Process as a Service Industry Revenue Million Forecast, by Size of Organization 2019 & 2032
- Table 3: Global Business Process as a Service Industry Revenue Million Forecast, by Process 2019 & 2032
- Table 4: Global Business Process as a Service Industry Revenue Million Forecast, by End-user Industry 2019 & 2032
- Table 5: Global Business Process as a Service Industry Revenue Million Forecast, by Region 2019 & 2032
- Table 6: Global Business Process as a Service Industry Revenue Million Forecast, by Country 2019 & 2032
- Table 7: United States Business Process as a Service Industry Revenue (Million) Forecast, by Application 2019 & 2032
- Table 8: Canada Business Process as a Service Industry Revenue (Million) Forecast, by Application 2019 & 2032
- Table 9: Global Business Process as a Service Industry Revenue Million Forecast, by Country 2019 & 2032
- Table 10: United Kingdom Business Process as a Service Industry Revenue (Million) Forecast, by Application 2019 & 2032
- Table 11: Germany Business Process as a Service Industry Revenue (Million) Forecast, by Application 2019 & 2032
- Table 12: France Business Process as a Service Industry Revenue (Million) Forecast, by Application 2019 & 2032
- Table 13: Rest of Europe Business Process as a Service Industry Revenue (Million) Forecast, by Application 2019 & 2032
- Table 14: Global Business Process as a Service Industry Revenue Million Forecast, by Country 2019 & 2032
- Table 15: China Business Process as a Service Industry Revenue (Million) Forecast, by Application 2019 & 2032
- Table 16: India Business Process as a Service Industry Revenue (Million) Forecast, by Application 2019 & 2032
- Table 17: Japan Business Process as a Service Industry Revenue (Million) Forecast, by Application 2019 & 2032
- Table 18: Rest of Asia Pacific Business Process as a Service Industry Revenue (Million) Forecast, by Application 2019 & 2032
- Table 19: Global Business Process as a Service Industry Revenue Million Forecast, by Country 2019 & 2032
- Table 20: Business Process as a Service Industry Revenue (Million) Forecast, by Application 2019 & 2032
- Table 21: Global Business Process as a Service Industry Revenue Million Forecast, by Country 2019 & 2032
- Table 22: Business Process as a Service Industry Revenue (Million) Forecast, by Application 2019 & 2032
- Table 23: Global Business Process as a Service Industry Revenue Million Forecast, by Size of Organization 2019 & 2032
- Table 24: Global Business Process as a Service Industry Revenue Million Forecast, by Process 2019 & 2032
- Table 25: Global Business Process as a Service Industry Revenue Million Forecast, by End-user Industry 2019 & 2032
- Table 26: Global Business Process as a Service Industry Revenue Million Forecast, by Country 2019 & 2032
- Table 27: United States Business Process as a Service Industry Revenue (Million) Forecast, by Application 2019 & 2032
- Table 28: Canada Business Process as a Service Industry Revenue (Million) Forecast, by Application 2019 & 2032
- Table 29: Global Business Process as a Service Industry Revenue Million Forecast, by Size of Organization 2019 & 2032
- Table 30: Global Business Process as a Service Industry Revenue Million Forecast, by Process 2019 & 2032
- Table 31: Global Business Process as a Service Industry Revenue Million Forecast, by End-user Industry 2019 & 2032
- Table 32: Global Business Process as a Service Industry Revenue Million Forecast, by Country 2019 & 2032
- Table 33: United Kingdom Business Process as a Service Industry Revenue (Million) Forecast, by Application 2019 & 2032
- Table 34: Germany Business Process as a Service Industry Revenue (Million) Forecast, by Application 2019 & 2032
- Table 35: France Business Process as a Service Industry Revenue (Million) Forecast, by Application 2019 & 2032
- Table 36: Rest of Europe Business Process as a Service Industry Revenue (Million) Forecast, by Application 2019 & 2032
- Table 37: Global Business Process as a Service Industry Revenue Million Forecast, by Size of Organization 2019 & 2032
- Table 38: Global Business Process as a Service Industry Revenue Million Forecast, by Process 2019 & 2032
- Table 39: Global Business Process as a Service Industry Revenue Million Forecast, by End-user Industry 2019 & 2032
- Table 40: Global Business Process as a Service Industry Revenue Million Forecast, by Country 2019 & 2032
- Table 41: China Business Process as a Service Industry Revenue (Million) Forecast, by Application 2019 & 2032
- Table 42: India Business Process as a Service Industry Revenue (Million) Forecast, by Application 2019 & 2032
- Table 43: Japan Business Process as a Service Industry Revenue (Million) Forecast, by Application 2019 & 2032
- Table 44: Rest of Asia Pacific Business Process as a Service Industry Revenue (Million) Forecast, by Application 2019 & 2032
- Table 45: Global Business Process as a Service Industry Revenue Million Forecast, by Size of Organization 2019 & 2032
- Table 46: Global Business Process as a Service Industry Revenue Million Forecast, by Process 2019 & 2032
- Table 47: Global Business Process as a Service Industry Revenue Million Forecast, by End-user Industry 2019 & 2032
- Table 48: Global Business Process as a Service Industry Revenue Million Forecast, by Country 2019 & 2032
- Table 49: Global Business Process as a Service Industry Revenue Million Forecast, by Size of Organization 2019 & 2032
- Table 50: Global Business Process as a Service Industry Revenue Million Forecast, by Process 2019 & 2032
- Table 51: Global Business Process as a Service Industry Revenue Million Forecast, by End-user Industry 2019 & 2032
- Table 52: Global Business Process as a Service Industry Revenue Million Forecast, by Country 2019 & 2032
Frequently Asked Questions
1. What is the projected Compound Annual Growth Rate (CAGR) of the Business Process as a Service Industry?
The projected CAGR is approximately 10.89%.
2. Which companies are prominent players in the Business Process as a Service Industry?
Key companies in the market include Wipro Limited, Accenture PLC, IBM Corporation, Fujitsu Ltd, HCL Technologies Ltd, Tata Consultancy Services Limited, Oracle Corporation, Capgemini SE*List Not Exhaustive, Cognizant Technology Solutions, Genpact Limited.
3. What are the main segments of the Business Process as a Service Industry?
The market segments include Size of Organization, Process, End-user Industry.
4. Can you provide details about the market size?
The market size is estimated to be USD XX Million as of 2022.
5. What are some drivers contributing to market growth?
Growing Demand for Cloud Services and Standard Operating Processes; Rising Need for the Reduction of Operational Costs and Improvement of Productivity.
6. What are the notable trends driving market growth?
Reduction of Operational Costs and Productivity Improvement to Drive the Market.
7. Are there any restraints impacting market growth?
Managing Regulatory and Compliance Needs Across the World.
8. Can you provide examples of recent developments in the market?
November 2022: In collaboration with IBM, Infosys Business Process Management (BPM) launches a cutting-edge AI and automation center in Poland. The partnership between Infosys BPM and IBM aims to deliver client success, identify new use cases, and build solutions to enable clients to innovate in hybrid cloud environments. Customers will have access to a range of digital solution offerings across the space of data, AI, and hyper-automation, including IBM CloudPak for data, IBM Watson Assistant and IBM Watson Discovery, IBM SaferPayments, IBM Blockchain, IBM Sterling Supply Chain, IBM Risk and Fraud Detection software, and Envizi for sustainability. They will also access critical solutions from Infosys BPM, such as Infosys Intelligent Document Processing, Infosys Interaction Analytics, and Infosys.
9. What pricing options are available for accessing the report?
Pricing options include single-user, multi-user, and enterprise licenses priced at USD 4750, USD 5250, and USD 8750 respectively.
10. Is the market size provided in terms of value or volume?
The market size is provided in terms of value, measured in Million.
11. Are there any specific market keywords associated with the report?
Yes, the market keyword associated with the report is "Business Process as a Service Industry," which aids in identifying and referencing the specific market segment covered.
12. How do I determine which pricing option suits my needs best?
The pricing options vary based on user requirements and access needs. Individual users may opt for single-user licenses, while businesses requiring broader access may choose multi-user or enterprise licenses for cost-effective access to the report.
13. Are there any additional resources or data provided in the Business Process as a Service Industry report?
While the report offers comprehensive insights, it's advisable to review the specific contents or supplementary materials provided to ascertain if additional resources or data are available.
14. How can I stay updated on further developments or reports in the Business Process as a Service Industry?
To stay informed about further developments, trends, and reports in the Business Process as a Service Industry, consider subscribing to industry newsletters, following relevant companies and organizations, or regularly checking reputable industry news sources and publications.
Methodology
Step 1 - Identification of Relevant Samples Size from Population Database


Step 2 - Approaches for Defining Global Market Size (Value, Volume* & Price*)

Note*: In applicable scenarios
Step 3 - Data Sources
Primary Research
- Web Analytics
- Survey Reports
- Research Institute
- Latest Research Reports
- Opinion Leaders
Secondary Research
- Annual Reports
- White Paper
- Latest Press Release
- Industry Association
- Paid Database
- Investor Presentations

Step 4 - Data Triangulation
Involves using different sources of information in order to increase the validity of a study
These sources are likely to be stakeholders in a program - participants, other researchers, program staff, other community members, and so on.
Then we put all data in single framework & apply various statistical tools to find out the dynamic on the market.
During the analysis stage, feedback from the stakeholder groups would be compared to determine areas of agreement as well as areas of divergence


