
Key Insights
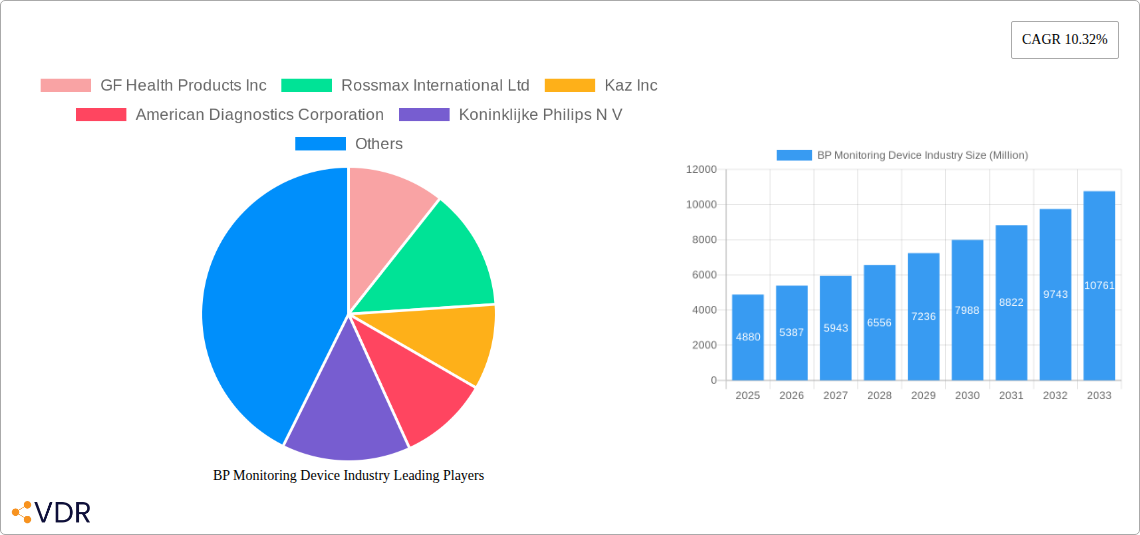
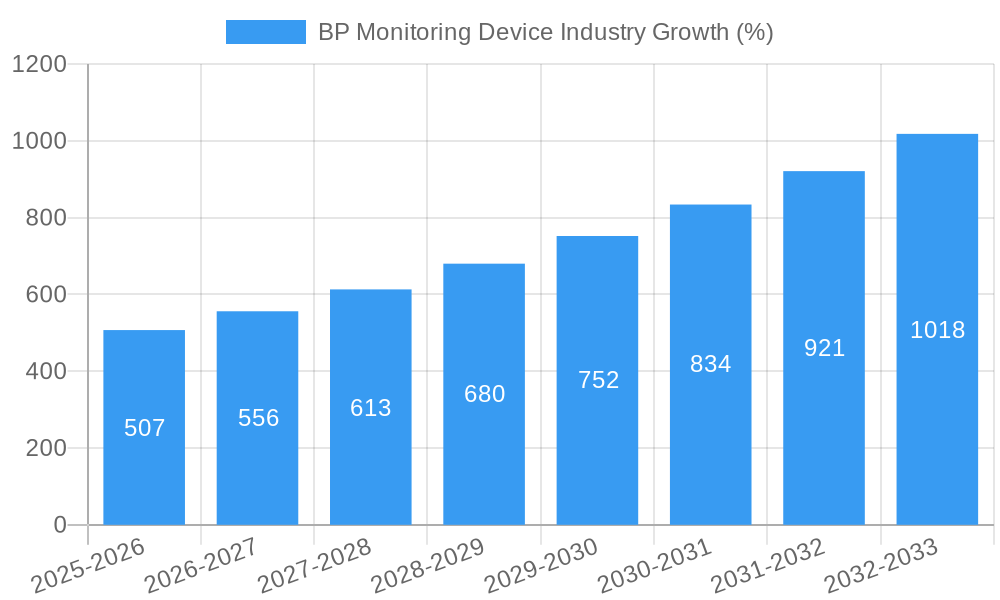
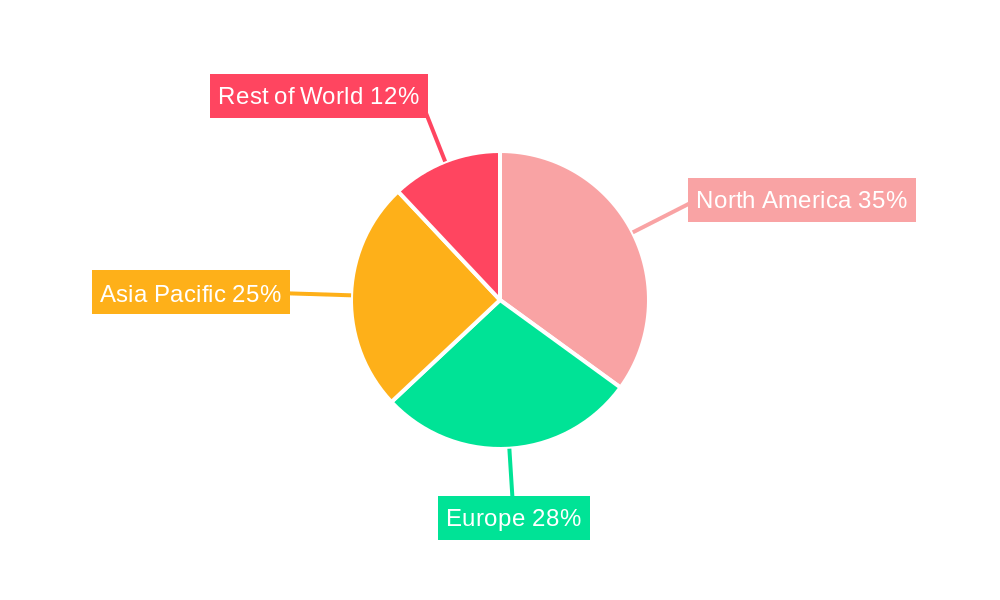
The global blood pressure (BP) monitoring device market is experiencing robust growth, projected to reach a significant size driven by rising prevalence of hypertension, increasing geriatric population, and growing awareness about cardiovascular health. The market's Compound Annual Growth Rate (CAGR) of 10.32% from 2019 to 2024 indicates a strong upward trajectory. This growth is fueled by technological advancements leading to more accurate, user-friendly, and portable devices like automated digital blood pressure monitors. The segment encompassing home-use devices is expanding rapidly as individuals increasingly prioritize self-monitoring and proactive healthcare management. Hospitals and clinics remain significant end-users, but the ambulatory surgical center segment is also demonstrating promising growth as these facilities increasingly adopt advanced BP monitoring technologies for better patient care. The competitive landscape is marked by the presence of both established multinational corporations and innovative smaller players, resulting in continuous product innovation and market penetration. Geographic analysis reveals that North America and Europe currently hold substantial market shares due to high healthcare expenditure and technological adoption, however, Asia-Pacific is anticipated to experience significant growth in the coming years fueled by rising disposable incomes and increasing healthcare infrastructure development.
The market segmentation reveals key growth drivers. Automated/digital blood pressure monitors are gaining prominence over traditional aneroid devices due to their ease of use and accuracy. The increasing demand for convenient, portable, and connected devices is driving the growth of home monitoring segment. While the market enjoys significant growth potential, challenges remain, such as the need for greater affordability and accessibility in emerging economies, coupled with regulatory hurdles and reimbursement policies in different regions. However, continuous innovation in device features (like smartphone connectivity and data analytics) and expanding telehealth initiatives are expected to mitigate these challenges. The market is poised for sustained growth, making strategic investments in innovative products and geographic expansions attractive for market players. The expanding market for wearable and connected health technology will also contribute to the continued expansion of the BP monitoring device market in the coming years.
BP Monitoring Device Industry Market Report: 2019-2033
This comprehensive report provides an in-depth analysis of the global BP Monitoring Device market, encompassing historical data (2019-2024), current estimates (2025), and future forecasts (2025-2033). We delve into market dynamics, growth trends, regional performance, product segmentation, and key players, equipping you with the insights needed to navigate this dynamic industry. The report covers both the parent market (Medical Devices) and the child market (Blood Pressure Monitoring Devices) for a comprehensive understanding. Market size is presented in Million Units.
BP Monitoring Device Industry Market Dynamics & Structure
This section analyzes the competitive landscape, technological advancements, regulatory influences, and market trends within the BP Monitoring Device industry. The market is characterized by a mix of established players and emerging innovators. Market concentration is moderate, with the top 10 players accounting for approximately xx% of the global market share in 2024.
- Market Concentration: Moderate, with top 10 players holding xx% market share (2024).
- Technological Innovation: Continuous advancements in sensor technology, wireless connectivity, and data analytics drive product innovation. Miniaturization and improved accuracy are key focus areas.
- Regulatory Frameworks: Stringent regulatory approvals (e.g., FDA, CE marking) impact market entry and product development.
- Competitive Product Substitutes: Limited direct substitutes exist; however, alternative monitoring methods (e.g., continuous cardiac output monitoring) present indirect competition.
- End-User Demographics: Aging populations and rising prevalence of hypertension fuel demand across home settings, hospitals, and clinics.
- M&A Trends: The number of M&A deals within the last 5 years has been approximately xx, driven by consolidation efforts and expansion into new technologies. Deal value has totaled approximately xx million USD.
- Innovation Barriers: High R&D costs, regulatory hurdles, and the need for rigorous clinical validation pose significant challenges to innovation.
BP Monitoring Device Industry Growth Trends & Insights
The global BP Monitoring Device market witnessed significant growth during the historical period (2019-2024), driven primarily by increasing healthcare expenditure, growing prevalence of hypertension, and technological advancements. The market size is estimated at xx million units in 2025 and is projected to expand at a CAGR of xx% during the forecast period (2025-2033), reaching xx million units by 2033. This growth is fueled by increasing adoption of digital and automated BP monitoring devices in home settings, coupled with rising demand for continuous ambulatory blood pressure monitoring (ABPM) systems. Increased awareness of hypertension and its associated health risks is also a major driver. Technological advancements, including wireless connectivity and data integration capabilities, are shaping consumer preferences and driving adoption rates. Market penetration for automated devices is increasing, particularly in developed regions.
Dominant Regions, Countries, or Segments in BP Monitoring Device Industry
North America and Europe currently dominate the BP Monitoring Device market, accounting for approximately xx% of the global market share in 2025. This dominance is driven by high healthcare expenditure, advanced healthcare infrastructure, and high prevalence of hypertension in these regions. However, Asia-Pacific is witnessing the fastest growth, propelled by rising healthcare spending, increasing awareness about cardiovascular diseases, and a rapidly expanding elderly population.
By Product:
- Automated/Digital Blood Pressure Monitors: This segment is the fastest-growing, driven by convenience, accuracy, and ease of use. It holds approximately xx% of the market share in 2025.
- Sphygmomanometer/Aneroid BP Monitors: This segment retains a significant market share, particularly in developing economies, due to its lower cost.
- Non-Portable (Upper Arm): Instrument Accessories: This segment shows steady growth, driven by the increasing demand for automated systems and the need for reliable accessories.
By End User:
- Home Setting: This segment represents the largest share of the market, fueled by rising consumer preference for self-monitoring and the availability of affordable home devices.
- Hospitals and Clinics: This segment displays steady growth, driven by the need for accurate and reliable BP monitoring in healthcare settings.
- Ambulatory Surgical Centers: This segment experiences moderate growth, aligned with the increasing number of ambulatory procedures.
BP Monitoring Device Industry Product Landscape
The BP monitoring device market features a diverse range of products, from traditional mercury-free sphygmomanometers to advanced automated devices with wireless connectivity and data logging capabilities. Innovative features include cuffless blood pressure monitoring technologies, improved algorithms for accurate readings, and integration with smartphone apps for remote monitoring and data management. Many devices now boast user-friendly interfaces, large displays, and irregular heartbeat detection features. These improvements enhance patient experience and compliance with monitoring regimens.
Key Drivers, Barriers & Challenges in BP Monitoring Device Industry
Key Drivers:
- The rising prevalence of hypertension globally is a major driver.
- Technological advancements, such as wireless connectivity and improved accuracy, are enhancing the appeal of these devices.
- Increasing healthcare expenditure and improved healthcare infrastructure are contributing to market growth.
- Growing awareness among consumers about the importance of regular blood pressure monitoring is also a significant factor.
Key Challenges and Restraints:
- Stringent regulatory approvals and high R&D costs pose challenges for market entry and innovation.
- The potential for inaccuracies in readings due to user errors or device malfunction remains a concern.
- Competition from alternative monitoring methods and established players presents a significant hurdle.
- Supply chain disruptions and fluctuations in raw material prices could affect production costs and market stability. The impact of this is estimated at xx% reduction in production in 2024.
Emerging Opportunities in BP Monitoring Device Industry
- The rising demand for wearable and continuous ambulatory blood pressure monitoring (ABPM) devices presents a significant opportunity.
- The integration of BP monitoring devices with telehealth platforms enables remote patient monitoring and improved care management.
- Untapped markets in developing economies with rising healthcare expenditure offer immense growth potential.
- The development of smart home technologies that integrate with BP monitoring devices presents further opportunities for market expansion.
Growth Accelerators in the BP Monitoring Device Industry
Technological innovation remains a key growth accelerator. Advancements in sensor technology, data analytics, and wireless communication are enhancing device accuracy, ease of use, and connectivity. Strategic partnerships between device manufacturers and healthcare providers are also expanding market access and improving patient outcomes. Expansion into new markets, particularly in developing regions, offers significant growth potential.
Key Players Shaping the BP Monitoring Device Industry Market
- GF Health Products Inc
- Rossmax International Ltd
- Kaz Inc
- American Diagnostics Corporation
- Koninklijke Philips N V
- Withings
- A&D Medical Inc
- Microlife AG
- General Electric Company (GE Healthcare)
- Omron Healthcare Inc
- List Not Exhaustive
Notable Milestones in BP Monitoring Device Industry Sector
- May 2021: Biobeat launched a new wearable and continuous ambulatory blood pressure monitoring (ABPM) chest-monitoring device, expanding the ABPM market.
- January 2020: SunTech Medical Inc. announced a collaboration agreement to jointly develop new blood pressure measurement solutions, highlighting the importance of partnerships in innovation.
In-Depth BP Monitoring Device Industry Market Outlook
The BP Monitoring Device market is poised for sustained growth, driven by technological advancements, increasing prevalence of hypertension, and expanding access to healthcare. Strategic investments in R&D, strategic partnerships, and expansion into emerging markets will be crucial for capturing the market's significant future potential. The market is expected to witness a continued shift towards automated and connected devices, leading to improved patient care and management.
BP Monitoring Device Industry Segmentation
-
1. Product
- 1.1. Sphygmomanometer/Aneroid BP Monitor
-
1.2. Automated/Digital Blood Pressure Monitor
- 1.2.1. Portable (Wrist, Upper Arm, Finger)
- 1.2.2. Non-Portable (Upper Arm)
- 1.3. Instrument Accessories
-
2. End User
- 2.1. Hospitals and Clinics
- 2.2. Ambulatory Surgical Centers
- 2.3. Home Setting
BP Monitoring Device Industry Segmentation By Geography
-
1. North America
- 1.1. United States
- 1.2. Canada
- 1.3. Mexico
-
2. Europe
- 2.1. Germany
- 2.2. United Kingdom
- 2.3. France
- 2.4. Italy
- 2.5. Spain
- 2.6. Rest of Europe
-
3. Asia Pacific
- 3.1. China
- 3.2. Japan
- 3.3. India
- 3.4. Australia
- 3.5. South Korea
- 3.6. Rest of Asia Pacific
-
4. Middle East and Africa
- 4.1. GCC
- 4.2. South Africa
- 4.3. Rest of Middle East and Africa
-
5. South America
- 5.1. Brazil
- 5.2. Argentina
- 5.3. Rest of South America
BP Monitoring Device Industry REPORT HIGHLIGHTS
| Aspects | Details |
|---|---|
| Study Period | 2019-2033 |
| Base Year | 2024 |
| Estimated Year | 2025 |
| Forecast Period | 2025-2033 |
| Historical Period | 2019-2024 |
| Growth Rate | CAGR of 10.32% from 2019-2033 |
| Segmentation |
|
Table of Contents
- 1. Introduction
- 1.1. Research Scope
- 1.2. Market Segmentation
- 1.3. Research Methodology
- 1.4. Definitions and Assumptions
- 2. Executive Summary
- 2.1. Introduction
- 3. Market Dynamics
- 3.1. Introduction
- 3.2. Market Drivers
- 3.2.1. Surging Burden of Cardiovascular Disorders; Technological Advancements
- 3.3. Market Restrains
- 3.3.1. Excessive Cost for Technological Developments
- 3.4. Market Trends
- 3.4.1. Automated/Digital Blood Pressure Monitor is Expected to Witness a Growth Over the Forecast Period
- 4. Market Factor Analysis
- 4.1. Porters Five Forces
- 4.2. Supply/Value Chain
- 4.3. PESTEL analysis
- 4.4. Market Entropy
- 4.5. Patent/Trademark Analysis
- 5. Global BP Monitoring Device Industry Analysis, Insights and Forecast, 2019-2031
- 5.1. Market Analysis, Insights and Forecast - by Product
- 5.1.1. Sphygmomanometer/Aneroid BP Monitor
- 5.1.2. Automated/Digital Blood Pressure Monitor
- 5.1.2.1. Portable (Wrist, Upper Arm, Finger)
- 5.1.2.2. Non-Portable (Upper Arm)
- 5.1.3. Instrument Accessories
- 5.2. Market Analysis, Insights and Forecast - by End User
- 5.2.1. Hospitals and Clinics
- 5.2.2. Ambulatory Surgical Centers
- 5.2.3. Home Setting
- 5.3. Market Analysis, Insights and Forecast - by Region
- 5.3.1. North America
- 5.3.2. Europe
- 5.3.3. Asia Pacific
- 5.3.4. Middle East and Africa
- 5.3.5. South America
- 5.1. Market Analysis, Insights and Forecast - by Product
- 6. North America BP Monitoring Device Industry Analysis, Insights and Forecast, 2019-2031
- 6.1. Market Analysis, Insights and Forecast - by Product
- 6.1.1. Sphygmomanometer/Aneroid BP Monitor
- 6.1.2. Automated/Digital Blood Pressure Monitor
- 6.1.2.1. Portable (Wrist, Upper Arm, Finger)
- 6.1.2.2. Non-Portable (Upper Arm)
- 6.1.3. Instrument Accessories
- 6.2. Market Analysis, Insights and Forecast - by End User
- 6.2.1. Hospitals and Clinics
- 6.2.2. Ambulatory Surgical Centers
- 6.2.3. Home Setting
- 6.1. Market Analysis, Insights and Forecast - by Product
- 7. Europe BP Monitoring Device Industry Analysis, Insights and Forecast, 2019-2031
- 7.1. Market Analysis, Insights and Forecast - by Product
- 7.1.1. Sphygmomanometer/Aneroid BP Monitor
- 7.1.2. Automated/Digital Blood Pressure Monitor
- 7.1.2.1. Portable (Wrist, Upper Arm, Finger)
- 7.1.2.2. Non-Portable (Upper Arm)
- 7.1.3. Instrument Accessories
- 7.2. Market Analysis, Insights and Forecast - by End User
- 7.2.1. Hospitals and Clinics
- 7.2.2. Ambulatory Surgical Centers
- 7.2.3. Home Setting
- 7.1. Market Analysis, Insights and Forecast - by Product
- 8. Asia Pacific BP Monitoring Device Industry Analysis, Insights and Forecast, 2019-2031
- 8.1. Market Analysis, Insights and Forecast - by Product
- 8.1.1. Sphygmomanometer/Aneroid BP Monitor
- 8.1.2. Automated/Digital Blood Pressure Monitor
- 8.1.2.1. Portable (Wrist, Upper Arm, Finger)
- 8.1.2.2. Non-Portable (Upper Arm)
- 8.1.3. Instrument Accessories
- 8.2. Market Analysis, Insights and Forecast - by End User
- 8.2.1. Hospitals and Clinics
- 8.2.2. Ambulatory Surgical Centers
- 8.2.3. Home Setting
- 8.1. Market Analysis, Insights and Forecast - by Product
- 9. Middle East and Africa BP Monitoring Device Industry Analysis, Insights and Forecast, 2019-2031
- 9.1. Market Analysis, Insights and Forecast - by Product
- 9.1.1. Sphygmomanometer/Aneroid BP Monitor
- 9.1.2. Automated/Digital Blood Pressure Monitor
- 9.1.2.1. Portable (Wrist, Upper Arm, Finger)
- 9.1.2.2. Non-Portable (Upper Arm)
- 9.1.3. Instrument Accessories
- 9.2. Market Analysis, Insights and Forecast - by End User
- 9.2.1. Hospitals and Clinics
- 9.2.2. Ambulatory Surgical Centers
- 9.2.3. Home Setting
- 9.1. Market Analysis, Insights and Forecast - by Product
- 10. South America BP Monitoring Device Industry Analysis, Insights and Forecast, 2019-2031
- 10.1. Market Analysis, Insights and Forecast - by Product
- 10.1.1. Sphygmomanometer/Aneroid BP Monitor
- 10.1.2. Automated/Digital Blood Pressure Monitor
- 10.1.2.1. Portable (Wrist, Upper Arm, Finger)
- 10.1.2.2. Non-Portable (Upper Arm)
- 10.1.3. Instrument Accessories
- 10.2. Market Analysis, Insights and Forecast - by End User
- 10.2.1. Hospitals and Clinics
- 10.2.2. Ambulatory Surgical Centers
- 10.2.3. Home Setting
- 10.1. Market Analysis, Insights and Forecast - by Product
- 11. North America BP Monitoring Device Industry Analysis, Insights and Forecast, 2019-2031
- 11.1. Market Analysis, Insights and Forecast - By Country/Sub-region
- 11.1.1 United States
- 11.1.2 Canada
- 11.1.3 Mexico
- 12. South America BP Monitoring Device Industry Analysis, Insights and Forecast, 2019-2031
- 12.1. Market Analysis, Insights and Forecast - By Country/Sub-region
- 12.1.1 Brazil
- 12.1.2 Mexico
- 12.1.3 Rest of South America
- 13. Europe BP Monitoring Device Industry Analysis, Insights and Forecast, 2019-2031
- 13.1. Market Analysis, Insights and Forecast - By Country/Sub-region
- 13.1.1 United Kingdom
- 13.1.2 Germany
- 13.1.3 France
- 13.1.4 Italy
- 13.1.5 Spain
- 13.1.6 Russia
- 13.1.7 Rest of Europe
- 14. Asia Pacific BP Monitoring Device Industry Analysis, Insights and Forecast, 2019-2031
- 14.1. Market Analysis, Insights and Forecast - By Country/Sub-region
- 14.1.1 China
- 14.1.2 Japan
- 14.1.3 India
- 14.1.4 South Korea
- 14.1.5 Taiwan
- 14.1.6 Australia
- 14.1.7 Rest of Asia-Pacific
- 15. MEA BP Monitoring Device Industry Analysis, Insights and Forecast, 2019-2031
- 15.1. Market Analysis, Insights and Forecast - By Country/Sub-region
- 15.1.1 Middle East
- 15.1.2 Africa
- 16. Competitive Analysis
- 16.1. Global Market Share Analysis 2024
- 16.2. Company Profiles
- 16.2.1 GF Health Products Inc
- 16.2.1.1. Overview
- 16.2.1.2. Products
- 16.2.1.3. SWOT Analysis
- 16.2.1.4. Recent Developments
- 16.2.1.5. Financials (Based on Availability)
- 16.2.2 Rossmax International Ltd
- 16.2.2.1. Overview
- 16.2.2.2. Products
- 16.2.2.3. SWOT Analysis
- 16.2.2.4. Recent Developments
- 16.2.2.5. Financials (Based on Availability)
- 16.2.3 Kaz Inc
- 16.2.3.1. Overview
- 16.2.3.2. Products
- 16.2.3.3. SWOT Analysis
- 16.2.3.4. Recent Developments
- 16.2.3.5. Financials (Based on Availability)
- 16.2.4 American Diagnostics Corporation
- 16.2.4.1. Overview
- 16.2.4.2. Products
- 16.2.4.3. SWOT Analysis
- 16.2.4.4. Recent Developments
- 16.2.4.5. Financials (Based on Availability)
- 16.2.5 Koninklijke Philips N V
- 16.2.5.1. Overview
- 16.2.5.2. Products
- 16.2.5.3. SWOT Analysis
- 16.2.5.4. Recent Developments
- 16.2.5.5. Financials (Based on Availability)
- 16.2.6 Withings*List Not Exhaustive
- 16.2.6.1. Overview
- 16.2.6.2. Products
- 16.2.6.3. SWOT Analysis
- 16.2.6.4. Recent Developments
- 16.2.6.5. Financials (Based on Availability)
- 16.2.7 A&D Medical Inc
- 16.2.7.1. Overview
- 16.2.7.2. Products
- 16.2.7.3. SWOT Analysis
- 16.2.7.4. Recent Developments
- 16.2.7.5. Financials (Based on Availability)
- 16.2.8 Microlife AG
- 16.2.8.1. Overview
- 16.2.8.2. Products
- 16.2.8.3. SWOT Analysis
- 16.2.8.4. Recent Developments
- 16.2.8.5. Financials (Based on Availability)
- 16.2.9 General Electric Company (GE Healthcare)
- 16.2.9.1. Overview
- 16.2.9.2. Products
- 16.2.9.3. SWOT Analysis
- 16.2.9.4. Recent Developments
- 16.2.9.5. Financials (Based on Availability)
- 16.2.10 Omron Healthcare Inc
- 16.2.10.1. Overview
- 16.2.10.2. Products
- 16.2.10.3. SWOT Analysis
- 16.2.10.4. Recent Developments
- 16.2.10.5. Financials (Based on Availability)
- 16.2.1 GF Health Products Inc
List of Figures
- Figure 1: Global BP Monitoring Device Industry Revenue Breakdown (Million, %) by Region 2024 & 2032
- Figure 2: Global BP Monitoring Device Industry Volume Breakdown (K Units, %) by Region 2024 & 2032
- Figure 3: North America BP Monitoring Device Industry Revenue (Million), by Country 2024 & 2032
- Figure 4: North America BP Monitoring Device Industry Volume (K Units), by Country 2024 & 2032
- Figure 5: North America BP Monitoring Device Industry Revenue Share (%), by Country 2024 & 2032
- Figure 6: North America BP Monitoring Device Industry Volume Share (%), by Country 2024 & 2032
- Figure 7: South America BP Monitoring Device Industry Revenue (Million), by Country 2024 & 2032
- Figure 8: South America BP Monitoring Device Industry Volume (K Units), by Country 2024 & 2032
- Figure 9: South America BP Monitoring Device Industry Revenue Share (%), by Country 2024 & 2032
- Figure 10: South America BP Monitoring Device Industry Volume Share (%), by Country 2024 & 2032
- Figure 11: Europe BP Monitoring Device Industry Revenue (Million), by Country 2024 & 2032
- Figure 12: Europe BP Monitoring Device Industry Volume (K Units), by Country 2024 & 2032
- Figure 13: Europe BP Monitoring Device Industry Revenue Share (%), by Country 2024 & 2032
- Figure 14: Europe BP Monitoring Device Industry Volume Share (%), by Country 2024 & 2032
- Figure 15: Asia Pacific BP Monitoring Device Industry Revenue (Million), by Country 2024 & 2032
- Figure 16: Asia Pacific BP Monitoring Device Industry Volume (K Units), by Country 2024 & 2032
- Figure 17: Asia Pacific BP Monitoring Device Industry Revenue Share (%), by Country 2024 & 2032
- Figure 18: Asia Pacific BP Monitoring Device Industry Volume Share (%), by Country 2024 & 2032
- Figure 19: MEA BP Monitoring Device Industry Revenue (Million), by Country 2024 & 2032
- Figure 20: MEA BP Monitoring Device Industry Volume (K Units), by Country 2024 & 2032
- Figure 21: MEA BP Monitoring Device Industry Revenue Share (%), by Country 2024 & 2032
- Figure 22: MEA BP Monitoring Device Industry Volume Share (%), by Country 2024 & 2032
- Figure 23: North America BP Monitoring Device Industry Revenue (Million), by Product 2024 & 2032
- Figure 24: North America BP Monitoring Device Industry Volume (K Units), by Product 2024 & 2032
- Figure 25: North America BP Monitoring Device Industry Revenue Share (%), by Product 2024 & 2032
- Figure 26: North America BP Monitoring Device Industry Volume Share (%), by Product 2024 & 2032
- Figure 27: North America BP Monitoring Device Industry Revenue (Million), by End User 2024 & 2032
- Figure 28: North America BP Monitoring Device Industry Volume (K Units), by End User 2024 & 2032
- Figure 29: North America BP Monitoring Device Industry Revenue Share (%), by End User 2024 & 2032
- Figure 30: North America BP Monitoring Device Industry Volume Share (%), by End User 2024 & 2032
- Figure 31: North America BP Monitoring Device Industry Revenue (Million), by Country 2024 & 2032
- Figure 32: North America BP Monitoring Device Industry Volume (K Units), by Country 2024 & 2032
- Figure 33: North America BP Monitoring Device Industry Revenue Share (%), by Country 2024 & 2032
- Figure 34: North America BP Monitoring Device Industry Volume Share (%), by Country 2024 & 2032
- Figure 35: Europe BP Monitoring Device Industry Revenue (Million), by Product 2024 & 2032
- Figure 36: Europe BP Monitoring Device Industry Volume (K Units), by Product 2024 & 2032
- Figure 37: Europe BP Monitoring Device Industry Revenue Share (%), by Product 2024 & 2032
- Figure 38: Europe BP Monitoring Device Industry Volume Share (%), by Product 2024 & 2032
- Figure 39: Europe BP Monitoring Device Industry Revenue (Million), by End User 2024 & 2032
- Figure 40: Europe BP Monitoring Device Industry Volume (K Units), by End User 2024 & 2032
- Figure 41: Europe BP Monitoring Device Industry Revenue Share (%), by End User 2024 & 2032
- Figure 42: Europe BP Monitoring Device Industry Volume Share (%), by End User 2024 & 2032
- Figure 43: Europe BP Monitoring Device Industry Revenue (Million), by Country 2024 & 2032
- Figure 44: Europe BP Monitoring Device Industry Volume (K Units), by Country 2024 & 2032
- Figure 45: Europe BP Monitoring Device Industry Revenue Share (%), by Country 2024 & 2032
- Figure 46: Europe BP Monitoring Device Industry Volume Share (%), by Country 2024 & 2032
- Figure 47: Asia Pacific BP Monitoring Device Industry Revenue (Million), by Product 2024 & 2032
- Figure 48: Asia Pacific BP Monitoring Device Industry Volume (K Units), by Product 2024 & 2032
- Figure 49: Asia Pacific BP Monitoring Device Industry Revenue Share (%), by Product 2024 & 2032
- Figure 50: Asia Pacific BP Monitoring Device Industry Volume Share (%), by Product 2024 & 2032
- Figure 51: Asia Pacific BP Monitoring Device Industry Revenue (Million), by End User 2024 & 2032
- Figure 52: Asia Pacific BP Monitoring Device Industry Volume (K Units), by End User 2024 & 2032
- Figure 53: Asia Pacific BP Monitoring Device Industry Revenue Share (%), by End User 2024 & 2032
- Figure 54: Asia Pacific BP Monitoring Device Industry Volume Share (%), by End User 2024 & 2032
- Figure 55: Asia Pacific BP Monitoring Device Industry Revenue (Million), by Country 2024 & 2032
- Figure 56: Asia Pacific BP Monitoring Device Industry Volume (K Units), by Country 2024 & 2032
- Figure 57: Asia Pacific BP Monitoring Device Industry Revenue Share (%), by Country 2024 & 2032
- Figure 58: Asia Pacific BP Monitoring Device Industry Volume Share (%), by Country 2024 & 2032
- Figure 59: Middle East and Africa BP Monitoring Device Industry Revenue (Million), by Product 2024 & 2032
- Figure 60: Middle East and Africa BP Monitoring Device Industry Volume (K Units), by Product 2024 & 2032
- Figure 61: Middle East and Africa BP Monitoring Device Industry Revenue Share (%), by Product 2024 & 2032
- Figure 62: Middle East and Africa BP Monitoring Device Industry Volume Share (%), by Product 2024 & 2032
- Figure 63: Middle East and Africa BP Monitoring Device Industry Revenue (Million), by End User 2024 & 2032
- Figure 64: Middle East and Africa BP Monitoring Device Industry Volume (K Units), by End User 2024 & 2032
- Figure 65: Middle East and Africa BP Monitoring Device Industry Revenue Share (%), by End User 2024 & 2032
- Figure 66: Middle East and Africa BP Monitoring Device Industry Volume Share (%), by End User 2024 & 2032
- Figure 67: Middle East and Africa BP Monitoring Device Industry Revenue (Million), by Country 2024 & 2032
- Figure 68: Middle East and Africa BP Monitoring Device Industry Volume (K Units), by Country 2024 & 2032
- Figure 69: Middle East and Africa BP Monitoring Device Industry Revenue Share (%), by Country 2024 & 2032
- Figure 70: Middle East and Africa BP Monitoring Device Industry Volume Share (%), by Country 2024 & 2032
- Figure 71: South America BP Monitoring Device Industry Revenue (Million), by Product 2024 & 2032
- Figure 72: South America BP Monitoring Device Industry Volume (K Units), by Product 2024 & 2032
- Figure 73: South America BP Monitoring Device Industry Revenue Share (%), by Product 2024 & 2032
- Figure 74: South America BP Monitoring Device Industry Volume Share (%), by Product 2024 & 2032
- Figure 75: South America BP Monitoring Device Industry Revenue (Million), by End User 2024 & 2032
- Figure 76: South America BP Monitoring Device Industry Volume (K Units), by End User 2024 & 2032
- Figure 77: South America BP Monitoring Device Industry Revenue Share (%), by End User 2024 & 2032
- Figure 78: South America BP Monitoring Device Industry Volume Share (%), by End User 2024 & 2032
- Figure 79: South America BP Monitoring Device Industry Revenue (Million), by Country 2024 & 2032
- Figure 80: South America BP Monitoring Device Industry Volume (K Units), by Country 2024 & 2032
- Figure 81: South America BP Monitoring Device Industry Revenue Share (%), by Country 2024 & 2032
- Figure 82: South America BP Monitoring Device Industry Volume Share (%), by Country 2024 & 2032
List of Tables
- Table 1: Global BP Monitoring Device Industry Revenue Million Forecast, by Region 2019 & 2032
- Table 2: Global BP Monitoring Device Industry Volume K Units Forecast, by Region 2019 & 2032
- Table 3: Global BP Monitoring Device Industry Revenue Million Forecast, by Product 2019 & 2032
- Table 4: Global BP Monitoring Device Industry Volume K Units Forecast, by Product 2019 & 2032
- Table 5: Global BP Monitoring Device Industry Revenue Million Forecast, by End User 2019 & 2032
- Table 6: Global BP Monitoring Device Industry Volume K Units Forecast, by End User 2019 & 2032
- Table 7: Global BP Monitoring Device Industry Revenue Million Forecast, by Region 2019 & 2032
- Table 8: Global BP Monitoring Device Industry Volume K Units Forecast, by Region 2019 & 2032
- Table 9: Global BP Monitoring Device Industry Revenue Million Forecast, by Country 2019 & 2032
- Table 10: Global BP Monitoring Device Industry Volume K Units Forecast, by Country 2019 & 2032
- Table 11: United States BP Monitoring Device Industry Revenue (Million) Forecast, by Application 2019 & 2032
- Table 12: United States BP Monitoring Device Industry Volume (K Units) Forecast, by Application 2019 & 2032
- Table 13: Canada BP Monitoring Device Industry Revenue (Million) Forecast, by Application 2019 & 2032
- Table 14: Canada BP Monitoring Device Industry Volume (K Units) Forecast, by Application 2019 & 2032
- Table 15: Mexico BP Monitoring Device Industry Revenue (Million) Forecast, by Application 2019 & 2032
- Table 16: Mexico BP Monitoring Device Industry Volume (K Units) Forecast, by Application 2019 & 2032
- Table 17: Global BP Monitoring Device Industry Revenue Million Forecast, by Country 2019 & 2032
- Table 18: Global BP Monitoring Device Industry Volume K Units Forecast, by Country 2019 & 2032
- Table 19: Brazil BP Monitoring Device Industry Revenue (Million) Forecast, by Application 2019 & 2032
- Table 20: Brazil BP Monitoring Device Industry Volume (K Units) Forecast, by Application 2019 & 2032
- Table 21: Mexico BP Monitoring Device Industry Revenue (Million) Forecast, by Application 2019 & 2032
- Table 22: Mexico BP Monitoring Device Industry Volume (K Units) Forecast, by Application 2019 & 2032
- Table 23: Rest of South America BP Monitoring Device Industry Revenue (Million) Forecast, by Application 2019 & 2032
- Table 24: Rest of South America BP Monitoring Device Industry Volume (K Units) Forecast, by Application 2019 & 2032
- Table 25: Global BP Monitoring Device Industry Revenue Million Forecast, by Country 2019 & 2032
- Table 26: Global BP Monitoring Device Industry Volume K Units Forecast, by Country 2019 & 2032
- Table 27: United Kingdom BP Monitoring Device Industry Revenue (Million) Forecast, by Application 2019 & 2032
- Table 28: United Kingdom BP Monitoring Device Industry Volume (K Units) Forecast, by Application 2019 & 2032
- Table 29: Germany BP Monitoring Device Industry Revenue (Million) Forecast, by Application 2019 & 2032
- Table 30: Germany BP Monitoring Device Industry Volume (K Units) Forecast, by Application 2019 & 2032
- Table 31: France BP Monitoring Device Industry Revenue (Million) Forecast, by Application 2019 & 2032
- Table 32: France BP Monitoring Device Industry Volume (K Units) Forecast, by Application 2019 & 2032
- Table 33: Italy BP Monitoring Device Industry Revenue (Million) Forecast, by Application 2019 & 2032
- Table 34: Italy BP Monitoring Device Industry Volume (K Units) Forecast, by Application 2019 & 2032
- Table 35: Spain BP Monitoring Device Industry Revenue (Million) Forecast, by Application 2019 & 2032
- Table 36: Spain BP Monitoring Device Industry Volume (K Units) Forecast, by Application 2019 & 2032
- Table 37: Russia BP Monitoring Device Industry Revenue (Million) Forecast, by Application 2019 & 2032
- Table 38: Russia BP Monitoring Device Industry Volume (K Units) Forecast, by Application 2019 & 2032
- Table 39: Rest of Europe BP Monitoring Device Industry Revenue (Million) Forecast, by Application 2019 & 2032
- Table 40: Rest of Europe BP Monitoring Device Industry Volume (K Units) Forecast, by Application 2019 & 2032
- Table 41: Global BP Monitoring Device Industry Revenue Million Forecast, by Country 2019 & 2032
- Table 42: Global BP Monitoring Device Industry Volume K Units Forecast, by Country 2019 & 2032
- Table 43: China BP Monitoring Device Industry Revenue (Million) Forecast, by Application 2019 & 2032
- Table 44: China BP Monitoring Device Industry Volume (K Units) Forecast, by Application 2019 & 2032
- Table 45: Japan BP Monitoring Device Industry Revenue (Million) Forecast, by Application 2019 & 2032
- Table 46: Japan BP Monitoring Device Industry Volume (K Units) Forecast, by Application 2019 & 2032
- Table 47: India BP Monitoring Device Industry Revenue (Million) Forecast, by Application 2019 & 2032
- Table 48: India BP Monitoring Device Industry Volume (K Units) Forecast, by Application 2019 & 2032
- Table 49: South Korea BP Monitoring Device Industry Revenue (Million) Forecast, by Application 2019 & 2032
- Table 50: South Korea BP Monitoring Device Industry Volume (K Units) Forecast, by Application 2019 & 2032
- Table 51: Taiwan BP Monitoring Device Industry Revenue (Million) Forecast, by Application 2019 & 2032
- Table 52: Taiwan BP Monitoring Device Industry Volume (K Units) Forecast, by Application 2019 & 2032
- Table 53: Australia BP Monitoring Device Industry Revenue (Million) Forecast, by Application 2019 & 2032
- Table 54: Australia BP Monitoring Device Industry Volume (K Units) Forecast, by Application 2019 & 2032
- Table 55: Rest of Asia-Pacific BP Monitoring Device Industry Revenue (Million) Forecast, by Application 2019 & 2032
- Table 56: Rest of Asia-Pacific BP Monitoring Device Industry Volume (K Units) Forecast, by Application 2019 & 2032
- Table 57: Global BP Monitoring Device Industry Revenue Million Forecast, by Country 2019 & 2032
- Table 58: Global BP Monitoring Device Industry Volume K Units Forecast, by Country 2019 & 2032
- Table 59: Middle East BP Monitoring Device Industry Revenue (Million) Forecast, by Application 2019 & 2032
- Table 60: Middle East BP Monitoring Device Industry Volume (K Units) Forecast, by Application 2019 & 2032
- Table 61: Africa BP Monitoring Device Industry Revenue (Million) Forecast, by Application 2019 & 2032
- Table 62: Africa BP Monitoring Device Industry Volume (K Units) Forecast, by Application 2019 & 2032
- Table 63: Global BP Monitoring Device Industry Revenue Million Forecast, by Product 2019 & 2032
- Table 64: Global BP Monitoring Device Industry Volume K Units Forecast, by Product 2019 & 2032
- Table 65: Global BP Monitoring Device Industry Revenue Million Forecast, by End User 2019 & 2032
- Table 66: Global BP Monitoring Device Industry Volume K Units Forecast, by End User 2019 & 2032
- Table 67: Global BP Monitoring Device Industry Revenue Million Forecast, by Country 2019 & 2032
- Table 68: Global BP Monitoring Device Industry Volume K Units Forecast, by Country 2019 & 2032
- Table 69: United States BP Monitoring Device Industry Revenue (Million) Forecast, by Application 2019 & 2032
- Table 70: United States BP Monitoring Device Industry Volume (K Units) Forecast, by Application 2019 & 2032
- Table 71: Canada BP Monitoring Device Industry Revenue (Million) Forecast, by Application 2019 & 2032
- Table 72: Canada BP Monitoring Device Industry Volume (K Units) Forecast, by Application 2019 & 2032
- Table 73: Mexico BP Monitoring Device Industry Revenue (Million) Forecast, by Application 2019 & 2032
- Table 74: Mexico BP Monitoring Device Industry Volume (K Units) Forecast, by Application 2019 & 2032
- Table 75: Global BP Monitoring Device Industry Revenue Million Forecast, by Product 2019 & 2032
- Table 76: Global BP Monitoring Device Industry Volume K Units Forecast, by Product 2019 & 2032
- Table 77: Global BP Monitoring Device Industry Revenue Million Forecast, by End User 2019 & 2032
- Table 78: Global BP Monitoring Device Industry Volume K Units Forecast, by End User 2019 & 2032
- Table 79: Global BP Monitoring Device Industry Revenue Million Forecast, by Country 2019 & 2032
- Table 80: Global BP Monitoring Device Industry Volume K Units Forecast, by Country 2019 & 2032
- Table 81: Germany BP Monitoring Device Industry Revenue (Million) Forecast, by Application 2019 & 2032
- Table 82: Germany BP Monitoring Device Industry Volume (K Units) Forecast, by Application 2019 & 2032
- Table 83: United Kingdom BP Monitoring Device Industry Revenue (Million) Forecast, by Application 2019 & 2032
- Table 84: United Kingdom BP Monitoring Device Industry Volume (K Units) Forecast, by Application 2019 & 2032
- Table 85: France BP Monitoring Device Industry Revenue (Million) Forecast, by Application 2019 & 2032
- Table 86: France BP Monitoring Device Industry Volume (K Units) Forecast, by Application 2019 & 2032
- Table 87: Italy BP Monitoring Device Industry Revenue (Million) Forecast, by Application 2019 & 2032
- Table 88: Italy BP Monitoring Device Industry Volume (K Units) Forecast, by Application 2019 & 2032
- Table 89: Spain BP Monitoring Device Industry Revenue (Million) Forecast, by Application 2019 & 2032
- Table 90: Spain BP Monitoring Device Industry Volume (K Units) Forecast, by Application 2019 & 2032
- Table 91: Rest of Europe BP Monitoring Device Industry Revenue (Million) Forecast, by Application 2019 & 2032
- Table 92: Rest of Europe BP Monitoring Device Industry Volume (K Units) Forecast, by Application 2019 & 2032
- Table 93: Global BP Monitoring Device Industry Revenue Million Forecast, by Product 2019 & 2032
- Table 94: Global BP Monitoring Device Industry Volume K Units Forecast, by Product 2019 & 2032
- Table 95: Global BP Monitoring Device Industry Revenue Million Forecast, by End User 2019 & 2032
- Table 96: Global BP Monitoring Device Industry Volume K Units Forecast, by End User 2019 & 2032
- Table 97: Global BP Monitoring Device Industry Revenue Million Forecast, by Country 2019 & 2032
- Table 98: Global BP Monitoring Device Industry Volume K Units Forecast, by Country 2019 & 2032
- Table 99: China BP Monitoring Device Industry Revenue (Million) Forecast, by Application 2019 & 2032
- Table 100: China BP Monitoring Device Industry Volume (K Units) Forecast, by Application 2019 & 2032
- Table 101: Japan BP Monitoring Device Industry Revenue (Million) Forecast, by Application 2019 & 2032
- Table 102: Japan BP Monitoring Device Industry Volume (K Units) Forecast, by Application 2019 & 2032
- Table 103: India BP Monitoring Device Industry Revenue (Million) Forecast, by Application 2019 & 2032
- Table 104: India BP Monitoring Device Industry Volume (K Units) Forecast, by Application 2019 & 2032
- Table 105: Australia BP Monitoring Device Industry Revenue (Million) Forecast, by Application 2019 & 2032
- Table 106: Australia BP Monitoring Device Industry Volume (K Units) Forecast, by Application 2019 & 2032
- Table 107: South Korea BP Monitoring Device Industry Revenue (Million) Forecast, by Application 2019 & 2032
- Table 108: South Korea BP Monitoring Device Industry Volume (K Units) Forecast, by Application 2019 & 2032
- Table 109: Rest of Asia Pacific BP Monitoring Device Industry Revenue (Million) Forecast, by Application 2019 & 2032
- Table 110: Rest of Asia Pacific BP Monitoring Device Industry Volume (K Units) Forecast, by Application 2019 & 2032
- Table 111: Global BP Monitoring Device Industry Revenue Million Forecast, by Product 2019 & 2032
- Table 112: Global BP Monitoring Device Industry Volume K Units Forecast, by Product 2019 & 2032
- Table 113: Global BP Monitoring Device Industry Revenue Million Forecast, by End User 2019 & 2032
- Table 114: Global BP Monitoring Device Industry Volume K Units Forecast, by End User 2019 & 2032
- Table 115: Global BP Monitoring Device Industry Revenue Million Forecast, by Country 2019 & 2032
- Table 116: Global BP Monitoring Device Industry Volume K Units Forecast, by Country 2019 & 2032
- Table 117: GCC BP Monitoring Device Industry Revenue (Million) Forecast, by Application 2019 & 2032
- Table 118: GCC BP Monitoring Device Industry Volume (K Units) Forecast, by Application 2019 & 2032
- Table 119: South Africa BP Monitoring Device Industry Revenue (Million) Forecast, by Application 2019 & 2032
- Table 120: South Africa BP Monitoring Device Industry Volume (K Units) Forecast, by Application 2019 & 2032
- Table 121: Rest of Middle East and Africa BP Monitoring Device Industry Revenue (Million) Forecast, by Application 2019 & 2032
- Table 122: Rest of Middle East and Africa BP Monitoring Device Industry Volume (K Units) Forecast, by Application 2019 & 2032
- Table 123: Global BP Monitoring Device Industry Revenue Million Forecast, by Product 2019 & 2032
- Table 124: Global BP Monitoring Device Industry Volume K Units Forecast, by Product 2019 & 2032
- Table 125: Global BP Monitoring Device Industry Revenue Million Forecast, by End User 2019 & 2032
- Table 126: Global BP Monitoring Device Industry Volume K Units Forecast, by End User 2019 & 2032
- Table 127: Global BP Monitoring Device Industry Revenue Million Forecast, by Country 2019 & 2032
- Table 128: Global BP Monitoring Device Industry Volume K Units Forecast, by Country 2019 & 2032
- Table 129: Brazil BP Monitoring Device Industry Revenue (Million) Forecast, by Application 2019 & 2032
- Table 130: Brazil BP Monitoring Device Industry Volume (K Units) Forecast, by Application 2019 & 2032
- Table 131: Argentina BP Monitoring Device Industry Revenue (Million) Forecast, by Application 2019 & 2032
- Table 132: Argentina BP Monitoring Device Industry Volume (K Units) Forecast, by Application 2019 & 2032
- Table 133: Rest of South America BP Monitoring Device Industry Revenue (Million) Forecast, by Application 2019 & 2032
- Table 134: Rest of South America BP Monitoring Device Industry Volume (K Units) Forecast, by Application 2019 & 2032
Frequently Asked Questions
1. What is the projected Compound Annual Growth Rate (CAGR) of the BP Monitoring Device Industry?
The projected CAGR is approximately 10.32%.
2. Which companies are prominent players in the BP Monitoring Device Industry?
Key companies in the market include GF Health Products Inc, Rossmax International Ltd, Kaz Inc, American Diagnostics Corporation, Koninklijke Philips N V, Withings*List Not Exhaustive, A&D Medical Inc, Microlife AG, General Electric Company (GE Healthcare), Omron Healthcare Inc.
3. What are the main segments of the BP Monitoring Device Industry?
The market segments include Product, End User.
4. Can you provide details about the market size?
The market size is estimated to be USD 4.88 Million as of 2022.
5. What are some drivers contributing to market growth?
Surging Burden of Cardiovascular Disorders; Technological Advancements.
6. What are the notable trends driving market growth?
Automated/Digital Blood Pressure Monitor is Expected to Witness a Growth Over the Forecast Period.
7. Are there any restraints impacting market growth?
Excessive Cost for Technological Developments.
8. Can you provide examples of recent developments in the market?
In May 2021, Biobeat announced the launch of its new wearable and continuous ambulatory blood pressure monitoring (ABPM) chest-monitoring device.
9. What pricing options are available for accessing the report?
Pricing options include single-user, multi-user, and enterprise licenses priced at USD 4750, USD 5250, and USD 8750 respectively.
10. Is the market size provided in terms of value or volume?
The market size is provided in terms of value, measured in Million and volume, measured in K Units.
11. Are there any specific market keywords associated with the report?
Yes, the market keyword associated with the report is "BP Monitoring Device Industry," which aids in identifying and referencing the specific market segment covered.
12. How do I determine which pricing option suits my needs best?
The pricing options vary based on user requirements and access needs. Individual users may opt for single-user licenses, while businesses requiring broader access may choose multi-user or enterprise licenses for cost-effective access to the report.
13. Are there any additional resources or data provided in the BP Monitoring Device Industry report?
While the report offers comprehensive insights, it's advisable to review the specific contents or supplementary materials provided to ascertain if additional resources or data are available.
14. How can I stay updated on further developments or reports in the BP Monitoring Device Industry?
To stay informed about further developments, trends, and reports in the BP Monitoring Device Industry, consider subscribing to industry newsletters, following relevant companies and organizations, or regularly checking reputable industry news sources and publications.
Methodology
Step 1 - Identification of Relevant Samples Size from Population Database


Step 2 - Approaches for Defining Global Market Size (Value, Volume* & Price*)

Note*: In applicable scenarios
Step 3 - Data Sources
Primary Research
- Web Analytics
- Survey Reports
- Research Institute
- Latest Research Reports
- Opinion Leaders
Secondary Research
- Annual Reports
- White Paper
- Latest Press Release
- Industry Association
- Paid Database
- Investor Presentations

Step 4 - Data Triangulation
Involves using different sources of information in order to increase the validity of a study
These sources are likely to be stakeholders in a program - participants, other researchers, program staff, other community members, and so on.
Then we put all data in single framework & apply various statistical tools to find out the dynamic on the market.
During the analysis stage, feedback from the stakeholder groups would be compared to determine areas of agreement as well as areas of divergence


