
Key Insights
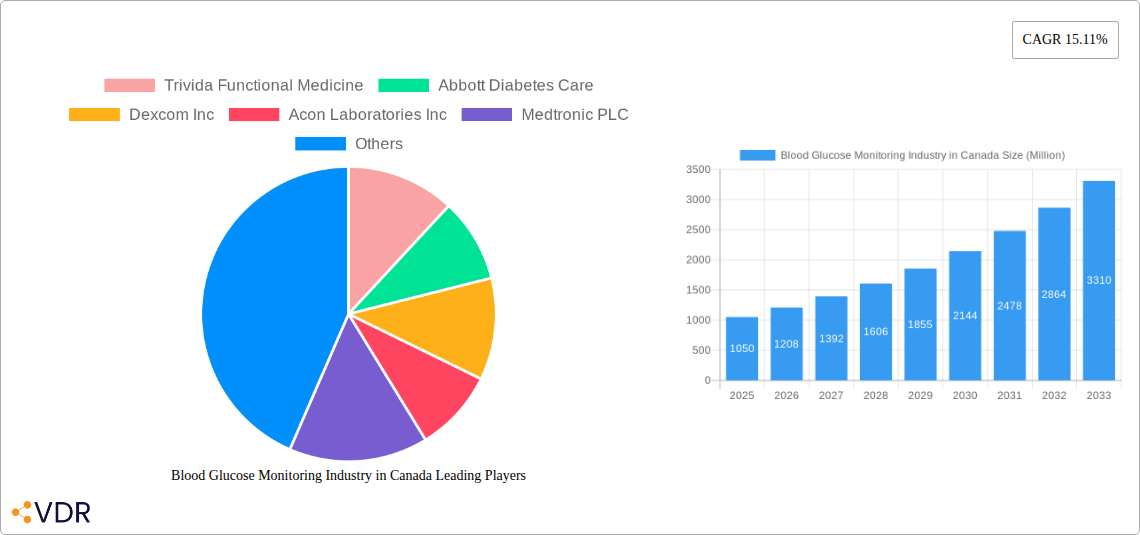
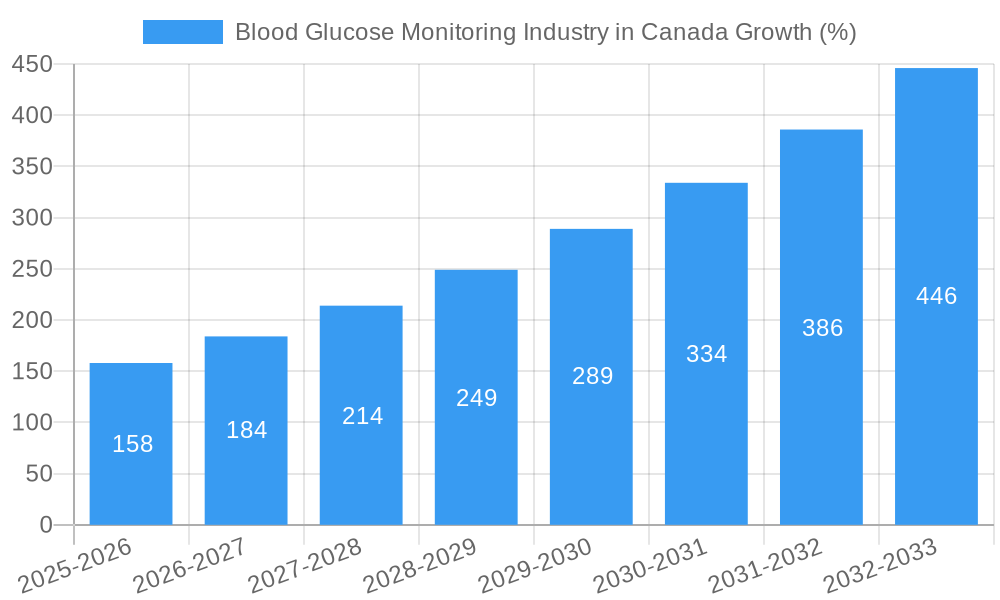
The Canadian blood glucose monitoring (BGM) market, valued at $1.05 billion in 2025, is experiencing robust growth, projected to expand at a Compound Annual Growth Rate (CAGR) of 15.11% from 2025 to 2033. This surge is driven by the rising prevalence of diabetes, an aging population, and increasing awareness of the importance of proactive diabetes management. Technological advancements, particularly in continuous glucose monitoring (CGM) systems offering real-time data and improved accuracy, are significant market drivers. The convenience and reduced burden of finger-prick testing associated with CGM are leading to increased adoption among both type 1 and type 2 diabetes patients. While the self-monitoring blood glucose (SMBG) segment, encompassing glucometers, test strips, and lancets, remains substantial, the CGM segment is experiencing the fastest growth due to its superior capabilities. Competition in the market is intense, with major players like Abbott Diabetes Care, Dexcom Inc., Medtronic PLC, and Roche Holding AG vying for market share through innovation and strategic partnerships. Regional variations exist within Canada, with potentially higher market penetration in urban areas compared to rural regions, reflecting differences in access to healthcare and technological adoption. However, government initiatives aimed at improving diabetes care across the country are expected to mitigate these regional disparities. The market faces restraints including the high cost of CGMs and the need for continuous calibration and maintenance of the devices.
The forecast period of 2025-2033 promises substantial growth opportunities, fueled by ongoing technological advancements and expanding healthcare infrastructure in Canada. Manufacturers are focusing on developing more user-friendly, accurate, and affordable devices to cater to the growing demand. The integration of BGM devices with digital health platforms and mobile applications further enhances patient engagement and management. Furthermore, increasing government support and insurance coverage for diabetes management technologies are expected to drive market expansion. The continued focus on improving patient outcomes and reducing complications associated with diabetes will continue to fuel growth in this crucial segment of the healthcare market.
Blood Glucose Monitoring Industry in Canada: A Comprehensive Market Report (2019-2033)
This comprehensive report provides an in-depth analysis of the Canadian blood glucose monitoring market, encompassing both self-monitoring blood glucose (SMBG) devices and continuous glucose monitoring (CGM) systems. The report covers the period 2019-2033, with a focus on the 2025-2033 forecast period. It offers invaluable insights for industry professionals, investors, and stakeholders seeking to understand the market dynamics, growth drivers, and future opportunities in this vital healthcare sector. The market is segmented into parent markets (Blood Glucose Monitoring Devices) and child markets (Self-Monitoring Blood Glucose Devices and Continuous Glucose Monitoring Devices), enabling granular analysis.
The report analyzes a market valued at xx Million in 2025, projected to reach xx Million by 2033, exhibiting a robust CAGR of xx%.
Blood Glucose Monitoring Industry in Canada Market Dynamics & Structure
This section delves into the intricate structure of the Canadian blood glucose monitoring market, analyzing factors influencing its growth trajectory. The market is characterized by a moderate level of concentration, with key players holding significant market share. Technological innovation, particularly in CGM technology, is a key driver, pushing the industry towards improved accuracy, ease of use, and data integration capabilities. The Canadian regulatory framework, while stringent, encourages innovation while prioritizing patient safety. Competition from alternative diabetes management strategies is relatively low. The end-user demographic is largely comprised of individuals diagnosed with type 1 and type 2 diabetes, with an aging population contributing to market expansion. Consolidation through mergers and acquisitions (M&A) is also observed, with a projected xx M&A deals in the forecast period, influencing market structure and competition.
- Market Concentration: Moderately concentrated, with top 5 players holding approximately xx% market share in 2025.
- Technological Innovation: Focus on miniaturization, improved accuracy, and seamless data integration with mobile health applications.
- Regulatory Framework: Stringent regulations ensuring product safety and efficacy, fostering a regulated but innovative environment.
- Competitive Substitutes: Limited direct substitutes; however, lifestyle changes and alternative therapies influence market adoption.
- End-User Demographics: Primarily individuals with type 1 and type 2 diabetes, with a growing elderly population driving demand.
- M&A Trends: Moderate M&A activity, driven by strategic expansion and technological consolidation.
Blood Glucose Monitoring Industry in Canada Growth Trends & Insights
The Canadian blood glucose monitoring market has witnessed significant growth over the historical period (2019-2024). This growth is primarily driven by the increasing prevalence of diabetes, coupled with advancements in CGM technology. The market size has expanded from xx Million in 2019 to xx Million in 2024, reflecting a strong CAGR of xx%. Increased adoption of CGM systems, driven by their enhanced accuracy and convenience compared to SMBG, has accelerated market growth. Technological disruptions, such as the introduction of smaller, more user-friendly devices with improved data analytics, have further fueled this expansion. Consumer behavior shifts towards proactive health management and a preference for non-invasive monitoring methods have also contributed to market growth.
Dominant Regions, Countries, or Segments in Blood Glucose Monitoring Industry in Canada
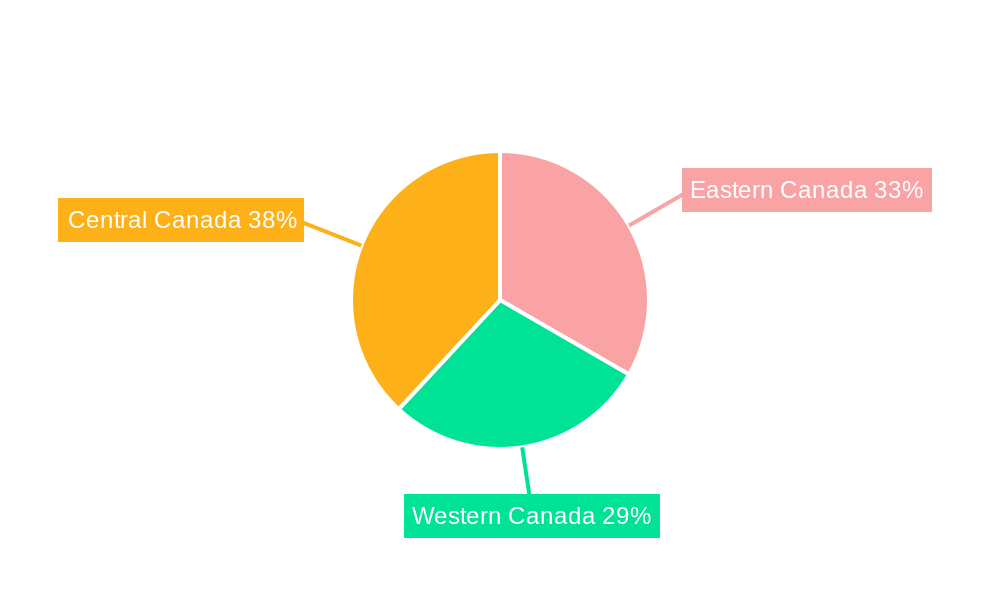
The Canadian blood glucose monitoring market shows geographically even distribution across provinces, influenced by population density and diabetes prevalence. However, urban centers experience higher market penetration due to better healthcare access. Within segments, CGM devices are exhibiting faster growth than SMBG, reflecting increased consumer preference for continuous monitoring.
- Self-monitoring blood glucose devices: Glucometer devices dominate this segment, with test strips and lancets being essential consumables. The mature nature of this segment leads to a slower growth rate compared to CGM.
- Continuous blood glucose monitoring devices: Sensors are the primary driver of CGM market growth, followed by the increasing adoption of more advanced receivers and transmitters. This segment is experiencing significant growth due to technological advancements and improved patient outcomes.
- Key Drivers: Increased diabetes prevalence, improved healthcare infrastructure, and government initiatives supporting diabetes management.
Blood Glucose Monitoring Industry in Canada Product Landscape
The Canadian market offers a diverse range of blood glucose monitoring products, including traditional SMBG devices and increasingly sophisticated CGM systems. Recent innovations focus on smaller, more comfortable devices with improved accuracy and longer sensor lifespans. CGM systems with advanced data analytics and integration with mobile applications are gaining popularity. Key features like real-time glucose readings, customizable alerts, and remote data sharing differentiate products and cater to evolving patient needs.
Key Drivers, Barriers & Challenges in Blood Glucose Monitoring Industry in Canada
Key Drivers:
- Rising prevalence of diabetes across all age groups.
- Technological advancements leading to smaller, more accurate, and user-friendly devices.
- Growing awareness about the importance of proactive diabetes management.
- Increased government funding and initiatives for diabetes care.
Challenges:
- High cost of CGM devices, limiting accessibility for some patients.
- Reimbursement challenges and insurance coverage variations across provinces.
- Potential for sensor malfunction or inaccurate readings.
- Intense competition among established and emerging players.
Emerging Opportunities in Blood Glucose Monitoring Industry in Canada
The Canadian market presents significant growth opportunities, including the expansion of CGM usage amongst younger diabetic populations, further integration with other digital health technologies, and the development of closed-loop systems to automate insulin delivery. Untapped markets include improved patient education and remote monitoring programs, leveraging technological advances for better patient outcomes and convenience.
Growth Accelerators in the Blood Glucose Monitoring Industry in Canada Industry
Long-term growth will be fueled by continuous technological innovation, strategic partnerships between device manufacturers and healthcare providers, and market expansion strategies targeting under-served populations. Government initiatives promoting early diabetes detection and proactive management will also contribute to sustained growth.
Key Players Shaping the Blood Glucose Monitoring Industry in Canada Market
- Trivida Functional Medicine
- Abbott Diabetes Care
- Dexcom Inc
- Acon Laboratories Inc
- Medtronic PLC
- Agamatrix Inc
- Senseonics
- Self-monitoring Blood Glucose Devices
- Bionime Corporation
- LifeScan
- Roche Holding AG
- Arkray Inc
- Ascensia Diabetes Care
Notable Milestones in Blood Glucose Monitoring Industry in Canada Sector
- July 2023: Dexcom G7 authorized for use in Canada for individuals aged two and above with any type of diabetes.
- March 2022: Dexcom G7 receives CE Mark in Europe, expanding its reach to a wider population including pregnant women.
In-Depth Blood Glucose Monitoring Industry in Canada Market Outlook
The Canadian blood glucose monitoring market exhibits strong future potential, driven by continuous technological advancements, increasing diabetes prevalence, and supportive government initiatives. Strategic opportunities lie in expanding CGM adoption, developing innovative solutions for data integration and remote patient management, and focusing on improving affordability and accessibility for all patients. The market is poised for robust growth, making it an attractive sector for investment and innovation.
Blood Glucose Monitoring Industry in Canada Segmentation
-
1. Self-monitoring blood glucose devices
- 1.1. Glucometer Devices
- 1.2. Test Strips
- 1.3. Lancets
-
2. Continuous blood glucose monitoring devices
- 2.1. Sensors
- 2.2. Durables (Receivers and Transmitters)
Blood Glucose Monitoring Industry in Canada Segmentation By Geography
-
1. North America
- 1.1. United States
- 1.2. Canada
- 1.3. Mexico
-
2. South America
- 2.1. Brazil
- 2.2. Argentina
- 2.3. Rest of South America
-
3. Europe
- 3.1. United Kingdom
- 3.2. Germany
- 3.3. France
- 3.4. Italy
- 3.5. Spain
- 3.6. Russia
- 3.7. Benelux
- 3.8. Nordics
- 3.9. Rest of Europe
-
4. Middle East & Africa
- 4.1. Turkey
- 4.2. Israel
- 4.3. GCC
- 4.4. North Africa
- 4.5. South Africa
- 4.6. Rest of Middle East & Africa
-
5. Asia Pacific
- 5.1. China
- 5.2. India
- 5.3. Japan
- 5.4. South Korea
- 5.5. ASEAN
- 5.6. Oceania
- 5.7. Rest of Asia Pacific
Blood Glucose Monitoring Industry in Canada REPORT HIGHLIGHTS
| Aspects | Details |
|---|---|
| Study Period | 2019-2033 |
| Base Year | 2024 |
| Estimated Year | 2025 |
| Forecast Period | 2025-2033 |
| Historical Period | 2019-2024 |
| Growth Rate | CAGR of 15.11% from 2019-2033 |
| Segmentation |
|
Table of Contents
- 1. Introduction
- 1.1. Research Scope
- 1.2. Market Segmentation
- 1.3. Research Methodology
- 1.4. Definitions and Assumptions
- 2. Executive Summary
- 2.1. Introduction
- 3. Market Dynamics
- 3.1. Introduction
- 3.2. Market Drivers
- 3.2.1. Rising Prevalence of Cancer Worldwide; Technological Advancements in Diagnostic Testing; Increasing Demand for Point-of-care Treatment
- 3.3. Market Restrains
- 3.3.1. High Cost of Molecular Diagnostic Tests; Lack of Skilled Workforce and Stringent Regulatory Framework
- 3.4. Market Trends
- 3.4.1. Increasing Type-1 diabetes population across Canada
- 4. Market Factor Analysis
- 4.1. Porters Five Forces
- 4.2. Supply/Value Chain
- 4.3. PESTEL analysis
- 4.4. Market Entropy
- 4.5. Patent/Trademark Analysis
- 5. Global Blood Glucose Monitoring Industry in Canada Analysis, Insights and Forecast, 2019-2031
- 5.1. Market Analysis, Insights and Forecast - by Self-monitoring blood glucose devices
- 5.1.1. Glucometer Devices
- 5.1.2. Test Strips
- 5.1.3. Lancets
- 5.2. Market Analysis, Insights and Forecast - by Continuous blood glucose monitoring devices
- 5.2.1. Sensors
- 5.2.2. Durables (Receivers and Transmitters)
- 5.3. Market Analysis, Insights and Forecast - by Region
- 5.3.1. North America
- 5.3.2. South America
- 5.3.3. Europe
- 5.3.4. Middle East & Africa
- 5.3.5. Asia Pacific
- 5.1. Market Analysis, Insights and Forecast - by Self-monitoring blood glucose devices
- 6. North America Blood Glucose Monitoring Industry in Canada Analysis, Insights and Forecast, 2019-2031
- 6.1. Market Analysis, Insights and Forecast - by Self-monitoring blood glucose devices
- 6.1.1. Glucometer Devices
- 6.1.2. Test Strips
- 6.1.3. Lancets
- 6.2. Market Analysis, Insights and Forecast - by Continuous blood glucose monitoring devices
- 6.2.1. Sensors
- 6.2.2. Durables (Receivers and Transmitters)
- 6.1. Market Analysis, Insights and Forecast - by Self-monitoring blood glucose devices
- 7. South America Blood Glucose Monitoring Industry in Canada Analysis, Insights and Forecast, 2019-2031
- 7.1. Market Analysis, Insights and Forecast - by Self-monitoring blood glucose devices
- 7.1.1. Glucometer Devices
- 7.1.2. Test Strips
- 7.1.3. Lancets
- 7.2. Market Analysis, Insights and Forecast - by Continuous blood glucose monitoring devices
- 7.2.1. Sensors
- 7.2.2. Durables (Receivers and Transmitters)
- 7.1. Market Analysis, Insights and Forecast - by Self-monitoring blood glucose devices
- 8. Europe Blood Glucose Monitoring Industry in Canada Analysis, Insights and Forecast, 2019-2031
- 8.1. Market Analysis, Insights and Forecast - by Self-monitoring blood glucose devices
- 8.1.1. Glucometer Devices
- 8.1.2. Test Strips
- 8.1.3. Lancets
- 8.2. Market Analysis, Insights and Forecast - by Continuous blood glucose monitoring devices
- 8.2.1. Sensors
- 8.2.2. Durables (Receivers and Transmitters)
- 8.1. Market Analysis, Insights and Forecast - by Self-monitoring blood glucose devices
- 9. Middle East & Africa Blood Glucose Monitoring Industry in Canada Analysis, Insights and Forecast, 2019-2031
- 9.1. Market Analysis, Insights and Forecast - by Self-monitoring blood glucose devices
- 9.1.1. Glucometer Devices
- 9.1.2. Test Strips
- 9.1.3. Lancets
- 9.2. Market Analysis, Insights and Forecast - by Continuous blood glucose monitoring devices
- 9.2.1. Sensors
- 9.2.2. Durables (Receivers and Transmitters)
- 9.1. Market Analysis, Insights and Forecast - by Self-monitoring blood glucose devices
- 10. Asia Pacific Blood Glucose Monitoring Industry in Canada Analysis, Insights and Forecast, 2019-2031
- 10.1. Market Analysis, Insights and Forecast - by Self-monitoring blood glucose devices
- 10.1.1. Glucometer Devices
- 10.1.2. Test Strips
- 10.1.3. Lancets
- 10.2. Market Analysis, Insights and Forecast - by Continuous blood glucose monitoring devices
- 10.2.1. Sensors
- 10.2.2. Durables (Receivers and Transmitters)
- 10.1. Market Analysis, Insights and Forecast - by Self-monitoring blood glucose devices
- 11. Eastern Canada Blood Glucose Monitoring Industry in Canada Analysis, Insights and Forecast, 2019-2031
- 12. Western Canada Blood Glucose Monitoring Industry in Canada Analysis, Insights and Forecast, 2019-2031
- 13. Central Canada Blood Glucose Monitoring Industry in Canada Analysis, Insights and Forecast, 2019-2031
- 14. Competitive Analysis
- 14.1. Global Market Share Analysis 2024
- 14.2. Company Profiles
- 14.2.1 Trivida Functional Medicine
- 14.2.1.1. Overview
- 14.2.1.2. Products
- 14.2.1.3. SWOT Analysis
- 14.2.1.4. Recent Developments
- 14.2.1.5. Financials (Based on Availability)
- 14.2.2 Abbott Diabetes Care
- 14.2.2.1. Overview
- 14.2.2.2. Products
- 14.2.2.3. SWOT Analysis
- 14.2.2.4. Recent Developments
- 14.2.2.5. Financials (Based on Availability)
- 14.2.3 Dexcom Inc
- 14.2.3.1. Overview
- 14.2.3.2. Products
- 14.2.3.3. SWOT Analysis
- 14.2.3.4. Recent Developments
- 14.2.3.5. Financials (Based on Availability)
- 14.2.4 Acon Laboratories Inc
- 14.2.4.1. Overview
- 14.2.4.2. Products
- 14.2.4.3. SWOT Analysis
- 14.2.4.4. Recent Developments
- 14.2.4.5. Financials (Based on Availability)
- 14.2.5 Medtronic PLC
- 14.2.5.1. Overview
- 14.2.5.2. Products
- 14.2.5.3. SWOT Analysis
- 14.2.5.4. Recent Developments
- 14.2.5.5. Financials (Based on Availability)
- 14.2.6 Agamatrix Inc
- 14.2.6.1. Overview
- 14.2.6.2. Products
- 14.2.6.3. SWOT Analysis
- 14.2.6.4. Recent Developments
- 14.2.6.5. Financials (Based on Availability)
- 14.2.7 Senseonics
- 14.2.7.1. Overview
- 14.2.7.2. Products
- 14.2.7.3. SWOT Analysis
- 14.2.7.4. Recent Developments
- 14.2.7.5. Financials (Based on Availability)
- 14.2.8 Self-monitoring Blood Glucose Devices
- 14.2.8.1. Overview
- 14.2.8.2. Products
- 14.2.8.3. SWOT Analysis
- 14.2.8.4. Recent Developments
- 14.2.8.5. Financials (Based on Availability)
- 14.2.9 Bionime Corporation
- 14.2.9.1. Overview
- 14.2.9.2. Products
- 14.2.9.3. SWOT Analysis
- 14.2.9.4. Recent Developments
- 14.2.9.5. Financials (Based on Availability)
- 14.2.10 LifeScan
- 14.2.10.1. Overview
- 14.2.10.2. Products
- 14.2.10.3. SWOT Analysis
- 14.2.10.4. Recent Developments
- 14.2.10.5. Financials (Based on Availability)
- 14.2.11 Roche Holding AG
- 14.2.11.1. Overview
- 14.2.11.2. Products
- 14.2.11.3. SWOT Analysis
- 14.2.11.4. Recent Developments
- 14.2.11.5. Financials (Based on Availability)
- 14.2.12 Arkray Inc
- 14.2.12.1. Overview
- 14.2.12.2. Products
- 14.2.12.3. SWOT Analysis
- 14.2.12.4. Recent Developments
- 14.2.12.5. Financials (Based on Availability)
- 14.2.13 Ascensia Diabetes Care
- 14.2.13.1. Overview
- 14.2.13.2. Products
- 14.2.13.3. SWOT Analysis
- 14.2.13.4. Recent Developments
- 14.2.13.5. Financials (Based on Availability)
- 14.2.1 Trivida Functional Medicine
List of Figures
- Figure 1: Global Blood Glucose Monitoring Industry in Canada Revenue Breakdown (Million, %) by Region 2024 & 2032
- Figure 2: Global Blood Glucose Monitoring Industry in Canada Volume Breakdown (K Unit, %) by Region 2024 & 2032
- Figure 3: Canada Blood Glucose Monitoring Industry in Canada Revenue (Million), by Country 2024 & 2032
- Figure 4: Canada Blood Glucose Monitoring Industry in Canada Volume (K Unit), by Country 2024 & 2032
- Figure 5: Canada Blood Glucose Monitoring Industry in Canada Revenue Share (%), by Country 2024 & 2032
- Figure 6: Canada Blood Glucose Monitoring Industry in Canada Volume Share (%), by Country 2024 & 2032
- Figure 7: North America Blood Glucose Monitoring Industry in Canada Revenue (Million), by Self-monitoring blood glucose devices 2024 & 2032
- Figure 8: North America Blood Glucose Monitoring Industry in Canada Volume (K Unit), by Self-monitoring blood glucose devices 2024 & 2032
- Figure 9: North America Blood Glucose Monitoring Industry in Canada Revenue Share (%), by Self-monitoring blood glucose devices 2024 & 2032
- Figure 10: North America Blood Glucose Monitoring Industry in Canada Volume Share (%), by Self-monitoring blood glucose devices 2024 & 2032
- Figure 11: North America Blood Glucose Monitoring Industry in Canada Revenue (Million), by Continuous blood glucose monitoring devices 2024 & 2032
- Figure 12: North America Blood Glucose Monitoring Industry in Canada Volume (K Unit), by Continuous blood glucose monitoring devices 2024 & 2032
- Figure 13: North America Blood Glucose Monitoring Industry in Canada Revenue Share (%), by Continuous blood glucose monitoring devices 2024 & 2032
- Figure 14: North America Blood Glucose Monitoring Industry in Canada Volume Share (%), by Continuous blood glucose monitoring devices 2024 & 2032
- Figure 15: North America Blood Glucose Monitoring Industry in Canada Revenue (Million), by Country 2024 & 2032
- Figure 16: North America Blood Glucose Monitoring Industry in Canada Volume (K Unit), by Country 2024 & 2032
- Figure 17: North America Blood Glucose Monitoring Industry in Canada Revenue Share (%), by Country 2024 & 2032
- Figure 18: North America Blood Glucose Monitoring Industry in Canada Volume Share (%), by Country 2024 & 2032
- Figure 19: South America Blood Glucose Monitoring Industry in Canada Revenue (Million), by Self-monitoring blood glucose devices 2024 & 2032
- Figure 20: South America Blood Glucose Monitoring Industry in Canada Volume (K Unit), by Self-monitoring blood glucose devices 2024 & 2032
- Figure 21: South America Blood Glucose Monitoring Industry in Canada Revenue Share (%), by Self-monitoring blood glucose devices 2024 & 2032
- Figure 22: South America Blood Glucose Monitoring Industry in Canada Volume Share (%), by Self-monitoring blood glucose devices 2024 & 2032
- Figure 23: South America Blood Glucose Monitoring Industry in Canada Revenue (Million), by Continuous blood glucose monitoring devices 2024 & 2032
- Figure 24: South America Blood Glucose Monitoring Industry in Canada Volume (K Unit), by Continuous blood glucose monitoring devices 2024 & 2032
- Figure 25: South America Blood Glucose Monitoring Industry in Canada Revenue Share (%), by Continuous blood glucose monitoring devices 2024 & 2032
- Figure 26: South America Blood Glucose Monitoring Industry in Canada Volume Share (%), by Continuous blood glucose monitoring devices 2024 & 2032
- Figure 27: South America Blood Glucose Monitoring Industry in Canada Revenue (Million), by Country 2024 & 2032
- Figure 28: South America Blood Glucose Monitoring Industry in Canada Volume (K Unit), by Country 2024 & 2032
- Figure 29: South America Blood Glucose Monitoring Industry in Canada Revenue Share (%), by Country 2024 & 2032
- Figure 30: South America Blood Glucose Monitoring Industry in Canada Volume Share (%), by Country 2024 & 2032
- Figure 31: Europe Blood Glucose Monitoring Industry in Canada Revenue (Million), by Self-monitoring blood glucose devices 2024 & 2032
- Figure 32: Europe Blood Glucose Monitoring Industry in Canada Volume (K Unit), by Self-monitoring blood glucose devices 2024 & 2032
- Figure 33: Europe Blood Glucose Monitoring Industry in Canada Revenue Share (%), by Self-monitoring blood glucose devices 2024 & 2032
- Figure 34: Europe Blood Glucose Monitoring Industry in Canada Volume Share (%), by Self-monitoring blood glucose devices 2024 & 2032
- Figure 35: Europe Blood Glucose Monitoring Industry in Canada Revenue (Million), by Continuous blood glucose monitoring devices 2024 & 2032
- Figure 36: Europe Blood Glucose Monitoring Industry in Canada Volume (K Unit), by Continuous blood glucose monitoring devices 2024 & 2032
- Figure 37: Europe Blood Glucose Monitoring Industry in Canada Revenue Share (%), by Continuous blood glucose monitoring devices 2024 & 2032
- Figure 38: Europe Blood Glucose Monitoring Industry in Canada Volume Share (%), by Continuous blood glucose monitoring devices 2024 & 2032
- Figure 39: Europe Blood Glucose Monitoring Industry in Canada Revenue (Million), by Country 2024 & 2032
- Figure 40: Europe Blood Glucose Monitoring Industry in Canada Volume (K Unit), by Country 2024 & 2032
- Figure 41: Europe Blood Glucose Monitoring Industry in Canada Revenue Share (%), by Country 2024 & 2032
- Figure 42: Europe Blood Glucose Monitoring Industry in Canada Volume Share (%), by Country 2024 & 2032
- Figure 43: Middle East & Africa Blood Glucose Monitoring Industry in Canada Revenue (Million), by Self-monitoring blood glucose devices 2024 & 2032
- Figure 44: Middle East & Africa Blood Glucose Monitoring Industry in Canada Volume (K Unit), by Self-monitoring blood glucose devices 2024 & 2032
- Figure 45: Middle East & Africa Blood Glucose Monitoring Industry in Canada Revenue Share (%), by Self-monitoring blood glucose devices 2024 & 2032
- Figure 46: Middle East & Africa Blood Glucose Monitoring Industry in Canada Volume Share (%), by Self-monitoring blood glucose devices 2024 & 2032
- Figure 47: Middle East & Africa Blood Glucose Monitoring Industry in Canada Revenue (Million), by Continuous blood glucose monitoring devices 2024 & 2032
- Figure 48: Middle East & Africa Blood Glucose Monitoring Industry in Canada Volume (K Unit), by Continuous blood glucose monitoring devices 2024 & 2032
- Figure 49: Middle East & Africa Blood Glucose Monitoring Industry in Canada Revenue Share (%), by Continuous blood glucose monitoring devices 2024 & 2032
- Figure 50: Middle East & Africa Blood Glucose Monitoring Industry in Canada Volume Share (%), by Continuous blood glucose monitoring devices 2024 & 2032
- Figure 51: Middle East & Africa Blood Glucose Monitoring Industry in Canada Revenue (Million), by Country 2024 & 2032
- Figure 52: Middle East & Africa Blood Glucose Monitoring Industry in Canada Volume (K Unit), by Country 2024 & 2032
- Figure 53: Middle East & Africa Blood Glucose Monitoring Industry in Canada Revenue Share (%), by Country 2024 & 2032
- Figure 54: Middle East & Africa Blood Glucose Monitoring Industry in Canada Volume Share (%), by Country 2024 & 2032
- Figure 55: Asia Pacific Blood Glucose Monitoring Industry in Canada Revenue (Million), by Self-monitoring blood glucose devices 2024 & 2032
- Figure 56: Asia Pacific Blood Glucose Monitoring Industry in Canada Volume (K Unit), by Self-monitoring blood glucose devices 2024 & 2032
- Figure 57: Asia Pacific Blood Glucose Monitoring Industry in Canada Revenue Share (%), by Self-monitoring blood glucose devices 2024 & 2032
- Figure 58: Asia Pacific Blood Glucose Monitoring Industry in Canada Volume Share (%), by Self-monitoring blood glucose devices 2024 & 2032
- Figure 59: Asia Pacific Blood Glucose Monitoring Industry in Canada Revenue (Million), by Continuous blood glucose monitoring devices 2024 & 2032
- Figure 60: Asia Pacific Blood Glucose Monitoring Industry in Canada Volume (K Unit), by Continuous blood glucose monitoring devices 2024 & 2032
- Figure 61: Asia Pacific Blood Glucose Monitoring Industry in Canada Revenue Share (%), by Continuous blood glucose monitoring devices 2024 & 2032
- Figure 62: Asia Pacific Blood Glucose Monitoring Industry in Canada Volume Share (%), by Continuous blood glucose monitoring devices 2024 & 2032
- Figure 63: Asia Pacific Blood Glucose Monitoring Industry in Canada Revenue (Million), by Country 2024 & 2032
- Figure 64: Asia Pacific Blood Glucose Monitoring Industry in Canada Volume (K Unit), by Country 2024 & 2032
- Figure 65: Asia Pacific Blood Glucose Monitoring Industry in Canada Revenue Share (%), by Country 2024 & 2032
- Figure 66: Asia Pacific Blood Glucose Monitoring Industry in Canada Volume Share (%), by Country 2024 & 2032
List of Tables
- Table 1: Global Blood Glucose Monitoring Industry in Canada Revenue Million Forecast, by Region 2019 & 2032
- Table 2: Global Blood Glucose Monitoring Industry in Canada Volume K Unit Forecast, by Region 2019 & 2032
- Table 3: Global Blood Glucose Monitoring Industry in Canada Revenue Million Forecast, by Self-monitoring blood glucose devices 2019 & 2032
- Table 4: Global Blood Glucose Monitoring Industry in Canada Volume K Unit Forecast, by Self-monitoring blood glucose devices 2019 & 2032
- Table 5: Global Blood Glucose Monitoring Industry in Canada Revenue Million Forecast, by Continuous blood glucose monitoring devices 2019 & 2032
- Table 6: Global Blood Glucose Monitoring Industry in Canada Volume K Unit Forecast, by Continuous blood glucose monitoring devices 2019 & 2032
- Table 7: Global Blood Glucose Monitoring Industry in Canada Revenue Million Forecast, by Region 2019 & 2032
- Table 8: Global Blood Glucose Monitoring Industry in Canada Volume K Unit Forecast, by Region 2019 & 2032
- Table 9: Global Blood Glucose Monitoring Industry in Canada Revenue Million Forecast, by Country 2019 & 2032
- Table 10: Global Blood Glucose Monitoring Industry in Canada Volume K Unit Forecast, by Country 2019 & 2032
- Table 11: Eastern Canada Blood Glucose Monitoring Industry in Canada Revenue (Million) Forecast, by Application 2019 & 2032
- Table 12: Eastern Canada Blood Glucose Monitoring Industry in Canada Volume (K Unit) Forecast, by Application 2019 & 2032
- Table 13: Western Canada Blood Glucose Monitoring Industry in Canada Revenue (Million) Forecast, by Application 2019 & 2032
- Table 14: Western Canada Blood Glucose Monitoring Industry in Canada Volume (K Unit) Forecast, by Application 2019 & 2032
- Table 15: Central Canada Blood Glucose Monitoring Industry in Canada Revenue (Million) Forecast, by Application 2019 & 2032
- Table 16: Central Canada Blood Glucose Monitoring Industry in Canada Volume (K Unit) Forecast, by Application 2019 & 2032
- Table 17: Global Blood Glucose Monitoring Industry in Canada Revenue Million Forecast, by Self-monitoring blood glucose devices 2019 & 2032
- Table 18: Global Blood Glucose Monitoring Industry in Canada Volume K Unit Forecast, by Self-monitoring blood glucose devices 2019 & 2032
- Table 19: Global Blood Glucose Monitoring Industry in Canada Revenue Million Forecast, by Continuous blood glucose monitoring devices 2019 & 2032
- Table 20: Global Blood Glucose Monitoring Industry in Canada Volume K Unit Forecast, by Continuous blood glucose monitoring devices 2019 & 2032
- Table 21: Global Blood Glucose Monitoring Industry in Canada Revenue Million Forecast, by Country 2019 & 2032
- Table 22: Global Blood Glucose Monitoring Industry in Canada Volume K Unit Forecast, by Country 2019 & 2032
- Table 23: United States Blood Glucose Monitoring Industry in Canada Revenue (Million) Forecast, by Application 2019 & 2032
- Table 24: United States Blood Glucose Monitoring Industry in Canada Volume (K Unit) Forecast, by Application 2019 & 2032
- Table 25: Canada Blood Glucose Monitoring Industry in Canada Revenue (Million) Forecast, by Application 2019 & 2032
- Table 26: Canada Blood Glucose Monitoring Industry in Canada Volume (K Unit) Forecast, by Application 2019 & 2032
- Table 27: Mexico Blood Glucose Monitoring Industry in Canada Revenue (Million) Forecast, by Application 2019 & 2032
- Table 28: Mexico Blood Glucose Monitoring Industry in Canada Volume (K Unit) Forecast, by Application 2019 & 2032
- Table 29: Global Blood Glucose Monitoring Industry in Canada Revenue Million Forecast, by Self-monitoring blood glucose devices 2019 & 2032
- Table 30: Global Blood Glucose Monitoring Industry in Canada Volume K Unit Forecast, by Self-monitoring blood glucose devices 2019 & 2032
- Table 31: Global Blood Glucose Monitoring Industry in Canada Revenue Million Forecast, by Continuous blood glucose monitoring devices 2019 & 2032
- Table 32: Global Blood Glucose Monitoring Industry in Canada Volume K Unit Forecast, by Continuous blood glucose monitoring devices 2019 & 2032
- Table 33: Global Blood Glucose Monitoring Industry in Canada Revenue Million Forecast, by Country 2019 & 2032
- Table 34: Global Blood Glucose Monitoring Industry in Canada Volume K Unit Forecast, by Country 2019 & 2032
- Table 35: Brazil Blood Glucose Monitoring Industry in Canada Revenue (Million) Forecast, by Application 2019 & 2032
- Table 36: Brazil Blood Glucose Monitoring Industry in Canada Volume (K Unit) Forecast, by Application 2019 & 2032
- Table 37: Argentina Blood Glucose Monitoring Industry in Canada Revenue (Million) Forecast, by Application 2019 & 2032
- Table 38: Argentina Blood Glucose Monitoring Industry in Canada Volume (K Unit) Forecast, by Application 2019 & 2032
- Table 39: Rest of South America Blood Glucose Monitoring Industry in Canada Revenue (Million) Forecast, by Application 2019 & 2032
- Table 40: Rest of South America Blood Glucose Monitoring Industry in Canada Volume (K Unit) Forecast, by Application 2019 & 2032
- Table 41: Global Blood Glucose Monitoring Industry in Canada Revenue Million Forecast, by Self-monitoring blood glucose devices 2019 & 2032
- Table 42: Global Blood Glucose Monitoring Industry in Canada Volume K Unit Forecast, by Self-monitoring blood glucose devices 2019 & 2032
- Table 43: Global Blood Glucose Monitoring Industry in Canada Revenue Million Forecast, by Continuous blood glucose monitoring devices 2019 & 2032
- Table 44: Global Blood Glucose Monitoring Industry in Canada Volume K Unit Forecast, by Continuous blood glucose monitoring devices 2019 & 2032
- Table 45: Global Blood Glucose Monitoring Industry in Canada Revenue Million Forecast, by Country 2019 & 2032
- Table 46: Global Blood Glucose Monitoring Industry in Canada Volume K Unit Forecast, by Country 2019 & 2032
- Table 47: United Kingdom Blood Glucose Monitoring Industry in Canada Revenue (Million) Forecast, by Application 2019 & 2032
- Table 48: United Kingdom Blood Glucose Monitoring Industry in Canada Volume (K Unit) Forecast, by Application 2019 & 2032
- Table 49: Germany Blood Glucose Monitoring Industry in Canada Revenue (Million) Forecast, by Application 2019 & 2032
- Table 50: Germany Blood Glucose Monitoring Industry in Canada Volume (K Unit) Forecast, by Application 2019 & 2032
- Table 51: France Blood Glucose Monitoring Industry in Canada Revenue (Million) Forecast, by Application 2019 & 2032
- Table 52: France Blood Glucose Monitoring Industry in Canada Volume (K Unit) Forecast, by Application 2019 & 2032
- Table 53: Italy Blood Glucose Monitoring Industry in Canada Revenue (Million) Forecast, by Application 2019 & 2032
- Table 54: Italy Blood Glucose Monitoring Industry in Canada Volume (K Unit) Forecast, by Application 2019 & 2032
- Table 55: Spain Blood Glucose Monitoring Industry in Canada Revenue (Million) Forecast, by Application 2019 & 2032
- Table 56: Spain Blood Glucose Monitoring Industry in Canada Volume (K Unit) Forecast, by Application 2019 & 2032
- Table 57: Russia Blood Glucose Monitoring Industry in Canada Revenue (Million) Forecast, by Application 2019 & 2032
- Table 58: Russia Blood Glucose Monitoring Industry in Canada Volume (K Unit) Forecast, by Application 2019 & 2032
- Table 59: Benelux Blood Glucose Monitoring Industry in Canada Revenue (Million) Forecast, by Application 2019 & 2032
- Table 60: Benelux Blood Glucose Monitoring Industry in Canada Volume (K Unit) Forecast, by Application 2019 & 2032
- Table 61: Nordics Blood Glucose Monitoring Industry in Canada Revenue (Million) Forecast, by Application 2019 & 2032
- Table 62: Nordics Blood Glucose Monitoring Industry in Canada Volume (K Unit) Forecast, by Application 2019 & 2032
- Table 63: Rest of Europe Blood Glucose Monitoring Industry in Canada Revenue (Million) Forecast, by Application 2019 & 2032
- Table 64: Rest of Europe Blood Glucose Monitoring Industry in Canada Volume (K Unit) Forecast, by Application 2019 & 2032
- Table 65: Global Blood Glucose Monitoring Industry in Canada Revenue Million Forecast, by Self-monitoring blood glucose devices 2019 & 2032
- Table 66: Global Blood Glucose Monitoring Industry in Canada Volume K Unit Forecast, by Self-monitoring blood glucose devices 2019 & 2032
- Table 67: Global Blood Glucose Monitoring Industry in Canada Revenue Million Forecast, by Continuous blood glucose monitoring devices 2019 & 2032
- Table 68: Global Blood Glucose Monitoring Industry in Canada Volume K Unit Forecast, by Continuous blood glucose monitoring devices 2019 & 2032
- Table 69: Global Blood Glucose Monitoring Industry in Canada Revenue Million Forecast, by Country 2019 & 2032
- Table 70: Global Blood Glucose Monitoring Industry in Canada Volume K Unit Forecast, by Country 2019 & 2032
- Table 71: Turkey Blood Glucose Monitoring Industry in Canada Revenue (Million) Forecast, by Application 2019 & 2032
- Table 72: Turkey Blood Glucose Monitoring Industry in Canada Volume (K Unit) Forecast, by Application 2019 & 2032
- Table 73: Israel Blood Glucose Monitoring Industry in Canada Revenue (Million) Forecast, by Application 2019 & 2032
- Table 74: Israel Blood Glucose Monitoring Industry in Canada Volume (K Unit) Forecast, by Application 2019 & 2032
- Table 75: GCC Blood Glucose Monitoring Industry in Canada Revenue (Million) Forecast, by Application 2019 & 2032
- Table 76: GCC Blood Glucose Monitoring Industry in Canada Volume (K Unit) Forecast, by Application 2019 & 2032
- Table 77: North Africa Blood Glucose Monitoring Industry in Canada Revenue (Million) Forecast, by Application 2019 & 2032
- Table 78: North Africa Blood Glucose Monitoring Industry in Canada Volume (K Unit) Forecast, by Application 2019 & 2032
- Table 79: South Africa Blood Glucose Monitoring Industry in Canada Revenue (Million) Forecast, by Application 2019 & 2032
- Table 80: South Africa Blood Glucose Monitoring Industry in Canada Volume (K Unit) Forecast, by Application 2019 & 2032
- Table 81: Rest of Middle East & Africa Blood Glucose Monitoring Industry in Canada Revenue (Million) Forecast, by Application 2019 & 2032
- Table 82: Rest of Middle East & Africa Blood Glucose Monitoring Industry in Canada Volume (K Unit) Forecast, by Application 2019 & 2032
- Table 83: Global Blood Glucose Monitoring Industry in Canada Revenue Million Forecast, by Self-monitoring blood glucose devices 2019 & 2032
- Table 84: Global Blood Glucose Monitoring Industry in Canada Volume K Unit Forecast, by Self-monitoring blood glucose devices 2019 & 2032
- Table 85: Global Blood Glucose Monitoring Industry in Canada Revenue Million Forecast, by Continuous blood glucose monitoring devices 2019 & 2032
- Table 86: Global Blood Glucose Monitoring Industry in Canada Volume K Unit Forecast, by Continuous blood glucose monitoring devices 2019 & 2032
- Table 87: Global Blood Glucose Monitoring Industry in Canada Revenue Million Forecast, by Country 2019 & 2032
- Table 88: Global Blood Glucose Monitoring Industry in Canada Volume K Unit Forecast, by Country 2019 & 2032
- Table 89: China Blood Glucose Monitoring Industry in Canada Revenue (Million) Forecast, by Application 2019 & 2032
- Table 90: China Blood Glucose Monitoring Industry in Canada Volume (K Unit) Forecast, by Application 2019 & 2032
- Table 91: India Blood Glucose Monitoring Industry in Canada Revenue (Million) Forecast, by Application 2019 & 2032
- Table 92: India Blood Glucose Monitoring Industry in Canada Volume (K Unit) Forecast, by Application 2019 & 2032
- Table 93: Japan Blood Glucose Monitoring Industry in Canada Revenue (Million) Forecast, by Application 2019 & 2032
- Table 94: Japan Blood Glucose Monitoring Industry in Canada Volume (K Unit) Forecast, by Application 2019 & 2032
- Table 95: South Korea Blood Glucose Monitoring Industry in Canada Revenue (Million) Forecast, by Application 2019 & 2032
- Table 96: South Korea Blood Glucose Monitoring Industry in Canada Volume (K Unit) Forecast, by Application 2019 & 2032
- Table 97: ASEAN Blood Glucose Monitoring Industry in Canada Revenue (Million) Forecast, by Application 2019 & 2032
- Table 98: ASEAN Blood Glucose Monitoring Industry in Canada Volume (K Unit) Forecast, by Application 2019 & 2032
- Table 99: Oceania Blood Glucose Monitoring Industry in Canada Revenue (Million) Forecast, by Application 2019 & 2032
- Table 100: Oceania Blood Glucose Monitoring Industry in Canada Volume (K Unit) Forecast, by Application 2019 & 2032
- Table 101: Rest of Asia Pacific Blood Glucose Monitoring Industry in Canada Revenue (Million) Forecast, by Application 2019 & 2032
- Table 102: Rest of Asia Pacific Blood Glucose Monitoring Industry in Canada Volume (K Unit) Forecast, by Application 2019 & 2032
Frequently Asked Questions
1. What is the projected Compound Annual Growth Rate (CAGR) of the Blood Glucose Monitoring Industry in Canada?
The projected CAGR is approximately 15.11%.
2. Which companies are prominent players in the Blood Glucose Monitoring Industry in Canada?
Key companies in the market include Trivida Functional Medicine, Abbott Diabetes Care, Dexcom Inc, Acon Laboratories Inc, Medtronic PLC, Agamatrix Inc, Senseonics, Self-monitoring Blood Glucose Devices, Bionime Corporation, LifeScan, Roche Holding AG, Arkray Inc, Ascensia Diabetes Care.
3. What are the main segments of the Blood Glucose Monitoring Industry in Canada?
The market segments include Self-monitoring blood glucose devices, Continuous blood glucose monitoring devices.
4. Can you provide details about the market size?
The market size is estimated to be USD 1.05 Million as of 2022.
5. What are some drivers contributing to market growth?
Rising Prevalence of Cancer Worldwide; Technological Advancements in Diagnostic Testing; Increasing Demand for Point-of-care Treatment.
6. What are the notable trends driving market growth?
Increasing Type-1 diabetes population across Canada.
7. Are there any restraints impacting market growth?
High Cost of Molecular Diagnostic Tests; Lack of Skilled Workforce and Stringent Regulatory Framework.
8. Can you provide examples of recent developments in the market?
July 2023: The Dexcom G7 has been authorized for use in Canada. This CGM system is now accessible to individuals aged two years and above who have any form of diabetes
9. What pricing options are available for accessing the report?
Pricing options include single-user, multi-user, and enterprise licenses priced at USD 3800, USD 4500, and USD 5800 respectively.
10. Is the market size provided in terms of value or volume?
The market size is provided in terms of value, measured in Million and volume, measured in K Unit.
11. Are there any specific market keywords associated with the report?
Yes, the market keyword associated with the report is "Blood Glucose Monitoring Industry in Canada," which aids in identifying and referencing the specific market segment covered.
12. How do I determine which pricing option suits my needs best?
The pricing options vary based on user requirements and access needs. Individual users may opt for single-user licenses, while businesses requiring broader access may choose multi-user or enterprise licenses for cost-effective access to the report.
13. Are there any additional resources or data provided in the Blood Glucose Monitoring Industry in Canada report?
While the report offers comprehensive insights, it's advisable to review the specific contents or supplementary materials provided to ascertain if additional resources or data are available.
14. How can I stay updated on further developments or reports in the Blood Glucose Monitoring Industry in Canada?
To stay informed about further developments, trends, and reports in the Blood Glucose Monitoring Industry in Canada, consider subscribing to industry newsletters, following relevant companies and organizations, or regularly checking reputable industry news sources and publications.
Methodology
Step 1 - Identification of Relevant Samples Size from Population Database


Step 2 - Approaches for Defining Global Market Size (Value, Volume* & Price*)

Note*: In applicable scenarios
Step 3 - Data Sources
Primary Research
- Web Analytics
- Survey Reports
- Research Institute
- Latest Research Reports
- Opinion Leaders
Secondary Research
- Annual Reports
- White Paper
- Latest Press Release
- Industry Association
- Paid Database
- Investor Presentations

Step 4 - Data Triangulation
Involves using different sources of information in order to increase the validity of a study
These sources are likely to be stakeholders in a program - participants, other researchers, program staff, other community members, and so on.
Then we put all data in single framework & apply various statistical tools to find out the dynamic on the market.
During the analysis stage, feedback from the stakeholder groups would be compared to determine areas of agreement as well as areas of divergence


