
Key Insights
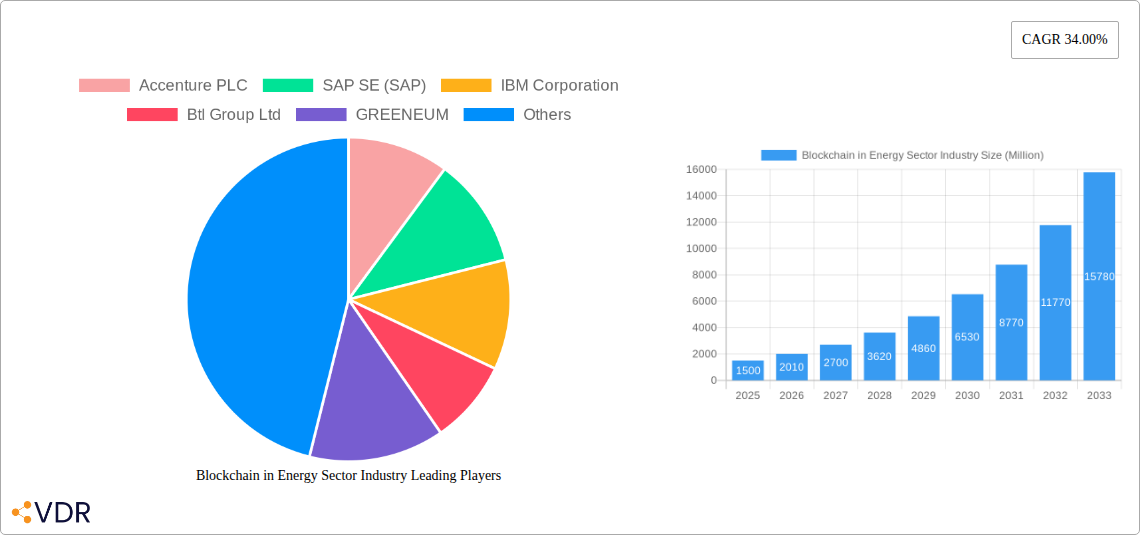
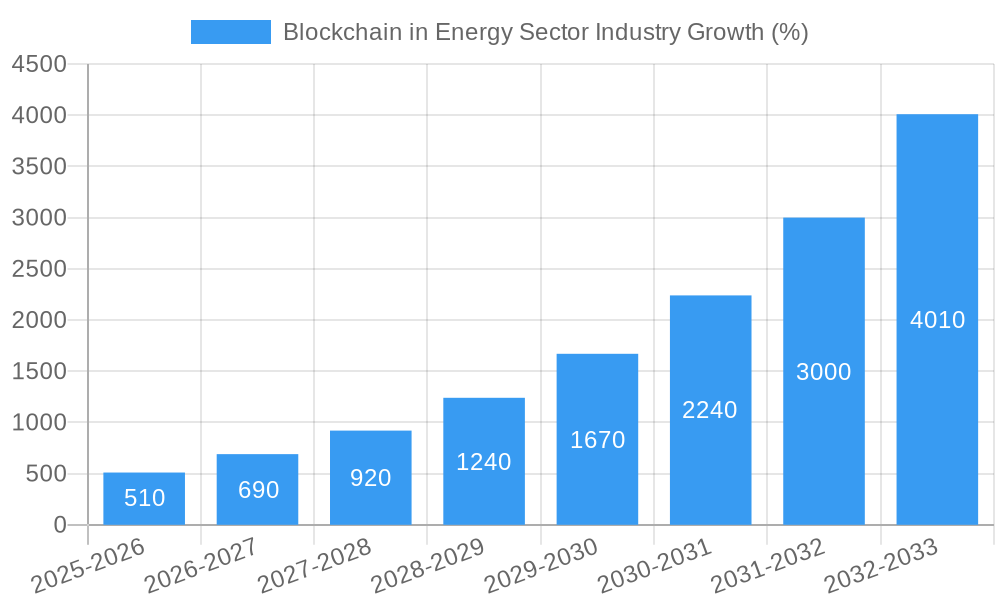
The Blockchain in Energy sector is experiencing explosive growth, projected to reach a substantial market size driven by increasing demand for decentralized and transparent energy management solutions. The compound annual growth rate (CAGR) of 34% from 2019 to 2033 indicates a rapidly expanding market, fueled by several key factors. The rising adoption of renewable energy sources necessitates efficient and secure energy trading platforms, a need perfectly addressed by blockchain technology's ability to facilitate peer-to-peer (P2P) energy transactions and microgrids. Smart contracts, a core functionality of blockchain, automate energy trading agreements, reducing operational costs and enhancing trust among participants. Furthermore, the increasing focus on improving grid reliability and reducing energy theft is driving the adoption of blockchain-based solutions for improved grid management and enhanced security. Applications within this sector encompass diverse areas, including payments for energy consumption, streamlined smart contracts for renewable energy purchase agreements, secure digital identities for energy producers and consumers, robust governance and risk management frameworks, and other emerging applications. Major players like Accenture, SAP, IBM, and others are actively investing in and developing blockchain solutions for the energy industry, further propelling market growth.
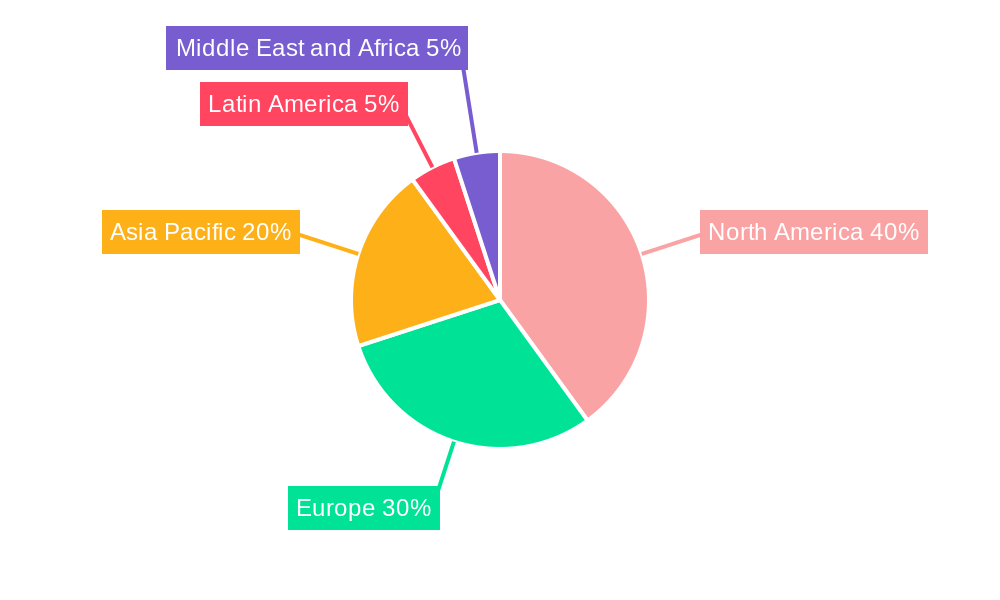
The geographical distribution of this market reflects the early adoption of innovative technologies in developed regions. North America and Europe currently hold significant market shares, benefiting from strong regulatory frameworks and substantial investments in renewable energy. However, the Asia-Pacific region shows immense potential for growth, driven by rapidly expanding renewable energy projects and increasing government support for technological advancements. While challenges such as scalability issues, regulatory uncertainties, and the need for wider public awareness persist, the overall market trajectory remains positive. The ongoing development of more efficient and scalable blockchain solutions, coupled with increasing regulatory clarity, is expected to overcome these hurdles and accelerate the market's expansion in the coming years. The next decade will witness a significant transformation in the energy sector, with blockchain playing a pivotal role in shaping a more decentralized, efficient, and sustainable energy future.
Blockchain in Energy Sector Industry: A Comprehensive Market Report (2019-2033)
This comprehensive report provides an in-depth analysis of the Blockchain in Energy Sector Industry market, encompassing market dynamics, growth trends, regional dominance, product landscape, key players, and future outlook. The study period spans from 2019 to 2033, with 2025 serving as the base and estimated year. The forecast period is 2025-2033, and the historical period covers 2019-2024. This report is invaluable for energy companies, technology providers, investors, and regulatory bodies seeking to understand and capitalize on the transformative potential of blockchain in the energy sector. The market is segmented by application: Payments, Smart Contracts, Digital Identities, Governance, Risk, and Compliance Management, and Other Applications. Key players analyzed include Accenture PLC, SAP SE (SAP), IBM Corporation, Btl Group Ltd, GREENEUM, Power Ledger Pty Ltd, Electron (Chaddenwych Services Limited), IOTA Foundation, LO3 Energy Inc, ImpactPPA, and Drift Marketplace Inc. (List Not Exhaustive). The total market size in 2025 is estimated at xx Million.
Blockchain in Energy Sector Industry Market Dynamics & Structure
The Blockchain in Energy Sector Industry market is characterized by moderate concentration, with a few major players holding significant market share (estimated at xx% combined in 2025). Technological innovation, driven by advancements in distributed ledger technology (DLT) and smart contract capabilities, is a key driver. Regulatory frameworks, while still evolving, are gradually becoming more supportive, fostering market growth. However, challenges remain, including interoperability issues between different blockchain platforms and concerns around data security and privacy. The market also faces competition from traditional energy management systems. Mergers and acquisitions (M&A) activity has been relatively moderate in recent years, with approximately xx deals recorded between 2019 and 2024. Future M&A activity is projected to increase as larger players seek to consolidate their market position and gain access to new technologies.
- Market Concentration: Moderately concentrated, with top players holding xx% market share in 2025.
- Technological Innovation: Driven by DLT and smart contract advancements.
- Regulatory Framework: Evolving but increasingly supportive.
- Competitive Substitutes: Traditional energy management systems.
- M&A Activity: Approximately xx deals between 2019-2024, with projected increase.
- Innovation Barriers: Interoperability, data security, and regulatory uncertainty.
Blockchain in Energy Sector Industry Growth Trends & Insights
The Blockchain in Energy Sector Industry market is experiencing robust growth, with a projected Compound Annual Growth Rate (CAGR) of xx% during the forecast period (2025-2033). Market size is expected to reach xx Million by 2033. This growth is fueled by increasing adoption of blockchain technology across various energy applications, driven by the need for enhanced transparency, security, and efficiency. Technological disruptions, such as the emergence of more scalable and efficient blockchain platforms, are further accelerating market expansion. Consumer behavior shifts towards greater demand for sustainable and transparent energy solutions are also playing a significant role. Market penetration is projected to reach xx% by 2033.
Dominant Regions, Countries, or Segments in Blockchain in Energy Sector Industry
North America currently holds the leading position in the Blockchain in Energy Sector Industry market, driven by early adoption of blockchain technology, robust regulatory support, and significant investments in the sector. Europe follows closely, with strong government initiatives promoting the use of blockchain for energy efficiency and grid management. Within applications, Smart Contracts are currently the dominant segment, owing to their ability to automate energy trading and optimize grid operations, followed by Payments which enables secure and transparent transactions. Other applications (e.g., supply chain management, carbon credit trading) are also showing significant growth potential.
- Key Drivers (North America): Early adoption, strong regulatory support, significant investments.
- Key Drivers (Europe): Government initiatives promoting blockchain in energy.
- Dominant Segment: Smart Contracts, followed by Payments.
- Growth Potential: Other applications (supply chain, carbon credit trading).
Blockchain in Energy Sector Industry Product Landscape
The Blockchain in Energy Sector Industry is witnessing significant innovation in blockchain platforms specifically designed for energy applications. These platforms offer enhanced scalability, security, and interoperability features, addressing limitations of earlier generations. Several platforms incorporate advanced analytics capabilities for improved energy management and optimization. Unique selling propositions include features like secure peer-to-peer energy trading, automated billing, and real-time grid monitoring. These advancements are driving wider adoption and expanding the market's overall capabilities.
Key Drivers, Barriers & Challenges in Blockchain in Energy Sector Industry
Key Drivers: Increasing demand for transparent and secure energy transactions, rising concerns about data security and grid reliability, and government initiatives supporting blockchain adoption are accelerating market growth. The potential for reduced operational costs and improved efficiency through automation further contributes to market expansion.
Key Challenges: High implementation costs, scalability issues with existing blockchain technologies, and regulatory uncertainty in certain regions create significant hurdles. Concerns around data privacy and interoperability between different blockchain platforms further complicate adoption. Supply chain disruptions can also impact the timely delivery of blockchain-based solutions, slowing down overall market growth.
Emerging Opportunities in Blockchain in Energy Sector Industry
Untapped markets in developing economies present significant opportunities for blockchain adoption. Innovative applications such as microgrids powered by renewable energy sources and blockchain-based carbon credit trading are emerging as promising avenues for market expansion. The rising consumer demand for sustainable and transparent energy solutions will further drive demand for blockchain-based energy solutions.
Growth Accelerators in the Blockchain in Energy Sector Industry Industry
Technological breakthroughs, such as the development of more scalable and energy-efficient blockchain platforms, are pivotal for accelerating market growth. Strategic partnerships between energy companies and technology providers are fostering innovation and driving wider adoption. Expansion into new markets, particularly in developing economies with growing energy demands, will further enhance market size.
Key Players Shaping the Blockchain in Energy Sector Industry Market
- Accenture PLC
- SAP SE (SAP)
- IBM Corporation
- Btl Group Ltd
- GREENEUM
- Power Ledger Pty Ltd
- Electron (Chaddenwych Services Limited)
- IOTA Foundation
- LO3 Energy Inc
- ImpactPPA
- Drift Marketplace Inc
Notable Milestones in Blockchain in Energy Sector Industry Sector
- July 2022: DIC Corporation partnered with SAP SE to pilot a blockchain-based waste plastics traceability system.
- January 2022: Indi EV launched a mobile blockchain for the EV sector at CES.
In-Depth Blockchain in Energy Sector Industry Market Outlook
The Blockchain in Energy Sector Industry market is poised for significant expansion over the next decade. Continued technological advancements, strategic partnerships, and regulatory clarity will drive adoption. The focus on sustainability and the growing demand for transparent energy solutions will create substantial opportunities for blockchain-based solutions. The market’s potential for cost reduction and improved efficiency will further accelerate its growth trajectory.
Blockchain in Energy Sector Industry Segmentation
-
1. Application
- 1.1. Payments
- 1.2. Smart Contracts
- 1.3. Digital Identities
- 1.4. Governance, Risk, and Compliance Management
- 1.5. Other Applications
Blockchain in Energy Sector Industry Segmentation By Geography
-
1. North America
- 1.1. United States
- 1.2. Canada
-
2. Europe
- 2.1. United Kingdom
- 2.2. Germany
- 2.3. Netherlands
- 2.4. Rest of Europe
-
3. Asia Pacific
- 3.1. Japan
- 3.2. Australia
- 3.3. New Zealand
- 3.4. Rest of Asia Pacific
-
4. Latin America
- 4.1. Brazil
- 4.2. Mexico
- 4.3. Rest of Latin America
-
5. Middle East and Africa
- 5.1. United Arab Emirates
- 5.2. Israel
- 5.3. Rest of Middle East and Africa
Blockchain in Energy Sector Industry REPORT HIGHLIGHTS
| Aspects | Details |
|---|---|
| Study Period | 2019-2033 |
| Base Year | 2024 |
| Estimated Year | 2025 |
| Forecast Period | 2025-2033 |
| Historical Period | 2019-2024 |
| Growth Rate | CAGR of 34.00% from 2019-2033 |
| Segmentation |
|
Table of Contents
- 1. Introduction
- 1.1. Research Scope
- 1.2. Market Segmentation
- 1.3. Research Methodology
- 1.4. Definitions and Assumptions
- 2. Executive Summary
- 2.1. Introduction
- 3. Market Dynamics
- 3.1. Introduction
- 3.2. Market Drivers
- 3.2.1. Emergence of Variable Electricity Rates and Need for Peer-to-peer Trading; Aggressive Spending by Venture Capitalists
- 3.3. Market Restrains
- 3.3.1. Scalability Constraints
- 3.4. Market Trends
- 3.4.1. Payments Hold the Largest Share in the Market
- 4. Market Factor Analysis
- 4.1. Porters Five Forces
- 4.2. Supply/Value Chain
- 4.3. PESTEL analysis
- 4.4. Market Entropy
- 4.5. Patent/Trademark Analysis
- 5. Global Blockchain in Energy Sector Industry Analysis, Insights and Forecast, 2019-2031
- 5.1. Market Analysis, Insights and Forecast - by Application
- 5.1.1. Payments
- 5.1.2. Smart Contracts
- 5.1.3. Digital Identities
- 5.1.4. Governance, Risk, and Compliance Management
- 5.1.5. Other Applications
- 5.2. Market Analysis, Insights and Forecast - by Region
- 5.2.1. North America
- 5.2.2. Europe
- 5.2.3. Asia Pacific
- 5.2.4. Latin America
- 5.2.5. Middle East and Africa
- 5.1. Market Analysis, Insights and Forecast - by Application
- 6. North America Blockchain in Energy Sector Industry Analysis, Insights and Forecast, 2019-2031
- 6.1. Market Analysis, Insights and Forecast - by Application
- 6.1.1. Payments
- 6.1.2. Smart Contracts
- 6.1.3. Digital Identities
- 6.1.4. Governance, Risk, and Compliance Management
- 6.1.5. Other Applications
- 6.1. Market Analysis, Insights and Forecast - by Application
- 7. Europe Blockchain in Energy Sector Industry Analysis, Insights and Forecast, 2019-2031
- 7.1. Market Analysis, Insights and Forecast - by Application
- 7.1.1. Payments
- 7.1.2. Smart Contracts
- 7.1.3. Digital Identities
- 7.1.4. Governance, Risk, and Compliance Management
- 7.1.5. Other Applications
- 7.1. Market Analysis, Insights and Forecast - by Application
- 8. Asia Pacific Blockchain in Energy Sector Industry Analysis, Insights and Forecast, 2019-2031
- 8.1. Market Analysis, Insights and Forecast - by Application
- 8.1.1. Payments
- 8.1.2. Smart Contracts
- 8.1.3. Digital Identities
- 8.1.4. Governance, Risk, and Compliance Management
- 8.1.5. Other Applications
- 8.1. Market Analysis, Insights and Forecast - by Application
- 9. Latin America Blockchain in Energy Sector Industry Analysis, Insights and Forecast, 2019-2031
- 9.1. Market Analysis, Insights and Forecast - by Application
- 9.1.1. Payments
- 9.1.2. Smart Contracts
- 9.1.3. Digital Identities
- 9.1.4. Governance, Risk, and Compliance Management
- 9.1.5. Other Applications
- 9.1. Market Analysis, Insights and Forecast - by Application
- 10. Middle East and Africa Blockchain in Energy Sector Industry Analysis, Insights and Forecast, 2019-2031
- 10.1. Market Analysis, Insights and Forecast - by Application
- 10.1.1. Payments
- 10.1.2. Smart Contracts
- 10.1.3. Digital Identities
- 10.1.4. Governance, Risk, and Compliance Management
- 10.1.5. Other Applications
- 10.1. Market Analysis, Insights and Forecast - by Application
- 11. North America Blockchain in Energy Sector Industry Analysis, Insights and Forecast, 2019-2031
- 11.1. Market Analysis, Insights and Forecast - By Country/Sub-region
- 11.1.1 United States
- 11.1.2 Canada
- 12. Europe Blockchain in Energy Sector Industry Analysis, Insights and Forecast, 2019-2031
- 12.1. Market Analysis, Insights and Forecast - By Country/Sub-region
- 12.1.1 United Kingdom
- 12.1.2 Germany
- 12.1.3 Netherlands
- 12.1.4 Rest of Europe
- 13. Asia Pacific Blockchain in Energy Sector Industry Analysis, Insights and Forecast, 2019-2031
- 13.1. Market Analysis, Insights and Forecast - By Country/Sub-region
- 13.1.1 Japan
- 13.1.2 Australia
- 13.1.3 New Zealand
- 13.1.4 Rest of Asia Pacific
- 14. Latin America Blockchain in Energy Sector Industry Analysis, Insights and Forecast, 2019-2031
- 14.1. Market Analysis, Insights and Forecast - By Country/Sub-region
- 14.1.1 Brazil
- 14.1.2 Mexico
- 14.1.3 Rest of Latin America
- 15. Middle East and Africa Blockchain in Energy Sector Industry Analysis, Insights and Forecast, 2019-2031
- 15.1. Market Analysis, Insights and Forecast - By Country/Sub-region
- 15.1.1 United Arab Emirates
- 15.1.2 Israel
- 15.1.3 Rest of Middle East and Africa
- 16. Competitive Analysis
- 16.1. Global Market Share Analysis 2024
- 16.2. Company Profiles
- 16.2.1 Accenture PLC
- 16.2.1.1. Overview
- 16.2.1.2. Products
- 16.2.1.3. SWOT Analysis
- 16.2.1.4. Recent Developments
- 16.2.1.5. Financials (Based on Availability)
- 16.2.2 SAP SE (SAP)
- 16.2.2.1. Overview
- 16.2.2.2. Products
- 16.2.2.3. SWOT Analysis
- 16.2.2.4. Recent Developments
- 16.2.2.5. Financials (Based on Availability)
- 16.2.3 IBM Corporation
- 16.2.3.1. Overview
- 16.2.3.2. Products
- 16.2.3.3. SWOT Analysis
- 16.2.3.4. Recent Developments
- 16.2.3.5. Financials (Based on Availability)
- 16.2.4 Btl Group Ltd
- 16.2.4.1. Overview
- 16.2.4.2. Products
- 16.2.4.3. SWOT Analysis
- 16.2.4.4. Recent Developments
- 16.2.4.5. Financials (Based on Availability)
- 16.2.5 GREENEUM
- 16.2.5.1. Overview
- 16.2.5.2. Products
- 16.2.5.3. SWOT Analysis
- 16.2.5.4. Recent Developments
- 16.2.5.5. Financials (Based on Availability)
- 16.2.6 Power Ledger Pty Ltd
- 16.2.6.1. Overview
- 16.2.6.2. Products
- 16.2.6.3. SWOT Analysis
- 16.2.6.4. Recent Developments
- 16.2.6.5. Financials (Based on Availability)
- 16.2.7 Electron (Chaddenwych Services Limited)
- 16.2.7.1. Overview
- 16.2.7.2. Products
- 16.2.7.3. SWOT Analysis
- 16.2.7.4. Recent Developments
- 16.2.7.5. Financials (Based on Availability)
- 16.2.8 IOTA Foundation
- 16.2.8.1. Overview
- 16.2.8.2. Products
- 16.2.8.3. SWOT Analysis
- 16.2.8.4. Recent Developments
- 16.2.8.5. Financials (Based on Availability)
- 16.2.9 LO3 Energy Inc
- 16.2.9.1. Overview
- 16.2.9.2. Products
- 16.2.9.3. SWOT Analysis
- 16.2.9.4. Recent Developments
- 16.2.9.5. Financials (Based on Availability)
- 16.2.10 ImpactPPA*List Not Exhaustive
- 16.2.10.1. Overview
- 16.2.10.2. Products
- 16.2.10.3. SWOT Analysis
- 16.2.10.4. Recent Developments
- 16.2.10.5. Financials (Based on Availability)
- 16.2.11 Drift Marketplace Inc
- 16.2.11.1. Overview
- 16.2.11.2. Products
- 16.2.11.3. SWOT Analysis
- 16.2.11.4. Recent Developments
- 16.2.11.5. Financials (Based on Availability)
- 16.2.1 Accenture PLC
List of Figures
- Figure 1: Global Blockchain in Energy Sector Industry Revenue Breakdown (Million, %) by Region 2024 & 2032
- Figure 2: North America Blockchain in Energy Sector Industry Revenue (Million), by Country 2024 & 2032
- Figure 3: North America Blockchain in Energy Sector Industry Revenue Share (%), by Country 2024 & 2032
- Figure 4: Europe Blockchain in Energy Sector Industry Revenue (Million), by Country 2024 & 2032
- Figure 5: Europe Blockchain in Energy Sector Industry Revenue Share (%), by Country 2024 & 2032
- Figure 6: Asia Pacific Blockchain in Energy Sector Industry Revenue (Million), by Country 2024 & 2032
- Figure 7: Asia Pacific Blockchain in Energy Sector Industry Revenue Share (%), by Country 2024 & 2032
- Figure 8: Latin America Blockchain in Energy Sector Industry Revenue (Million), by Country 2024 & 2032
- Figure 9: Latin America Blockchain in Energy Sector Industry Revenue Share (%), by Country 2024 & 2032
- Figure 10: Middle East and Africa Blockchain in Energy Sector Industry Revenue (Million), by Country 2024 & 2032
- Figure 11: Middle East and Africa Blockchain in Energy Sector Industry Revenue Share (%), by Country 2024 & 2032
- Figure 12: North America Blockchain in Energy Sector Industry Revenue (Million), by Application 2024 & 2032
- Figure 13: North America Blockchain in Energy Sector Industry Revenue Share (%), by Application 2024 & 2032
- Figure 14: North America Blockchain in Energy Sector Industry Revenue (Million), by Country 2024 & 2032
- Figure 15: North America Blockchain in Energy Sector Industry Revenue Share (%), by Country 2024 & 2032
- Figure 16: Europe Blockchain in Energy Sector Industry Revenue (Million), by Application 2024 & 2032
- Figure 17: Europe Blockchain in Energy Sector Industry Revenue Share (%), by Application 2024 & 2032
- Figure 18: Europe Blockchain in Energy Sector Industry Revenue (Million), by Country 2024 & 2032
- Figure 19: Europe Blockchain in Energy Sector Industry Revenue Share (%), by Country 2024 & 2032
- Figure 20: Asia Pacific Blockchain in Energy Sector Industry Revenue (Million), by Application 2024 & 2032
- Figure 21: Asia Pacific Blockchain in Energy Sector Industry Revenue Share (%), by Application 2024 & 2032
- Figure 22: Asia Pacific Blockchain in Energy Sector Industry Revenue (Million), by Country 2024 & 2032
- Figure 23: Asia Pacific Blockchain in Energy Sector Industry Revenue Share (%), by Country 2024 & 2032
- Figure 24: Latin America Blockchain in Energy Sector Industry Revenue (Million), by Application 2024 & 2032
- Figure 25: Latin America Blockchain in Energy Sector Industry Revenue Share (%), by Application 2024 & 2032
- Figure 26: Latin America Blockchain in Energy Sector Industry Revenue (Million), by Country 2024 & 2032
- Figure 27: Latin America Blockchain in Energy Sector Industry Revenue Share (%), by Country 2024 & 2032
- Figure 28: Middle East and Africa Blockchain in Energy Sector Industry Revenue (Million), by Application 2024 & 2032
- Figure 29: Middle East and Africa Blockchain in Energy Sector Industry Revenue Share (%), by Application 2024 & 2032
- Figure 30: Middle East and Africa Blockchain in Energy Sector Industry Revenue (Million), by Country 2024 & 2032
- Figure 31: Middle East and Africa Blockchain in Energy Sector Industry Revenue Share (%), by Country 2024 & 2032
List of Tables
- Table 1: Global Blockchain in Energy Sector Industry Revenue Million Forecast, by Region 2019 & 2032
- Table 2: Global Blockchain in Energy Sector Industry Revenue Million Forecast, by Application 2019 & 2032
- Table 3: Global Blockchain in Energy Sector Industry Revenue Million Forecast, by Region 2019 & 2032
- Table 4: Global Blockchain in Energy Sector Industry Revenue Million Forecast, by Country 2019 & 2032
- Table 5: United States Blockchain in Energy Sector Industry Revenue (Million) Forecast, by Application 2019 & 2032
- Table 6: Canada Blockchain in Energy Sector Industry Revenue (Million) Forecast, by Application 2019 & 2032
- Table 7: Global Blockchain in Energy Sector Industry Revenue Million Forecast, by Country 2019 & 2032
- Table 8: United Kingdom Blockchain in Energy Sector Industry Revenue (Million) Forecast, by Application 2019 & 2032
- Table 9: Germany Blockchain in Energy Sector Industry Revenue (Million) Forecast, by Application 2019 & 2032
- Table 10: Netherlands Blockchain in Energy Sector Industry Revenue (Million) Forecast, by Application 2019 & 2032
- Table 11: Rest of Europe Blockchain in Energy Sector Industry Revenue (Million) Forecast, by Application 2019 & 2032
- Table 12: Global Blockchain in Energy Sector Industry Revenue Million Forecast, by Country 2019 & 2032
- Table 13: Japan Blockchain in Energy Sector Industry Revenue (Million) Forecast, by Application 2019 & 2032
- Table 14: Australia Blockchain in Energy Sector Industry Revenue (Million) Forecast, by Application 2019 & 2032
- Table 15: New Zealand Blockchain in Energy Sector Industry Revenue (Million) Forecast, by Application 2019 & 2032
- Table 16: Rest of Asia Pacific Blockchain in Energy Sector Industry Revenue (Million) Forecast, by Application 2019 & 2032
- Table 17: Global Blockchain in Energy Sector Industry Revenue Million Forecast, by Country 2019 & 2032
- Table 18: Brazil Blockchain in Energy Sector Industry Revenue (Million) Forecast, by Application 2019 & 2032
- Table 19: Mexico Blockchain in Energy Sector Industry Revenue (Million) Forecast, by Application 2019 & 2032
- Table 20: Rest of Latin America Blockchain in Energy Sector Industry Revenue (Million) Forecast, by Application 2019 & 2032
- Table 21: Global Blockchain in Energy Sector Industry Revenue Million Forecast, by Country 2019 & 2032
- Table 22: United Arab Emirates Blockchain in Energy Sector Industry Revenue (Million) Forecast, by Application 2019 & 2032
- Table 23: Israel Blockchain in Energy Sector Industry Revenue (Million) Forecast, by Application 2019 & 2032
- Table 24: Rest of Middle East and Africa Blockchain in Energy Sector Industry Revenue (Million) Forecast, by Application 2019 & 2032
- Table 25: Global Blockchain in Energy Sector Industry Revenue Million Forecast, by Application 2019 & 2032
- Table 26: Global Blockchain in Energy Sector Industry Revenue Million Forecast, by Country 2019 & 2032
- Table 27: United States Blockchain in Energy Sector Industry Revenue (Million) Forecast, by Application 2019 & 2032
- Table 28: Canada Blockchain in Energy Sector Industry Revenue (Million) Forecast, by Application 2019 & 2032
- Table 29: Global Blockchain in Energy Sector Industry Revenue Million Forecast, by Application 2019 & 2032
- Table 30: Global Blockchain in Energy Sector Industry Revenue Million Forecast, by Country 2019 & 2032
- Table 31: United Kingdom Blockchain in Energy Sector Industry Revenue (Million) Forecast, by Application 2019 & 2032
- Table 32: Germany Blockchain in Energy Sector Industry Revenue (Million) Forecast, by Application 2019 & 2032
- Table 33: Netherlands Blockchain in Energy Sector Industry Revenue (Million) Forecast, by Application 2019 & 2032
- Table 34: Rest of Europe Blockchain in Energy Sector Industry Revenue (Million) Forecast, by Application 2019 & 2032
- Table 35: Global Blockchain in Energy Sector Industry Revenue Million Forecast, by Application 2019 & 2032
- Table 36: Global Blockchain in Energy Sector Industry Revenue Million Forecast, by Country 2019 & 2032
- Table 37: Japan Blockchain in Energy Sector Industry Revenue (Million) Forecast, by Application 2019 & 2032
- Table 38: Australia Blockchain in Energy Sector Industry Revenue (Million) Forecast, by Application 2019 & 2032
- Table 39: New Zealand Blockchain in Energy Sector Industry Revenue (Million) Forecast, by Application 2019 & 2032
- Table 40: Rest of Asia Pacific Blockchain in Energy Sector Industry Revenue (Million) Forecast, by Application 2019 & 2032
- Table 41: Global Blockchain in Energy Sector Industry Revenue Million Forecast, by Application 2019 & 2032
- Table 42: Global Blockchain in Energy Sector Industry Revenue Million Forecast, by Country 2019 & 2032
- Table 43: Brazil Blockchain in Energy Sector Industry Revenue (Million) Forecast, by Application 2019 & 2032
- Table 44: Mexico Blockchain in Energy Sector Industry Revenue (Million) Forecast, by Application 2019 & 2032
- Table 45: Rest of Latin America Blockchain in Energy Sector Industry Revenue (Million) Forecast, by Application 2019 & 2032
- Table 46: Global Blockchain in Energy Sector Industry Revenue Million Forecast, by Application 2019 & 2032
- Table 47: Global Blockchain in Energy Sector Industry Revenue Million Forecast, by Country 2019 & 2032
- Table 48: United Arab Emirates Blockchain in Energy Sector Industry Revenue (Million) Forecast, by Application 2019 & 2032
- Table 49: Israel Blockchain in Energy Sector Industry Revenue (Million) Forecast, by Application 2019 & 2032
- Table 50: Rest of Middle East and Africa Blockchain in Energy Sector Industry Revenue (Million) Forecast, by Application 2019 & 2032
Frequently Asked Questions
1. What is the projected Compound Annual Growth Rate (CAGR) of the Blockchain in Energy Sector Industry?
The projected CAGR is approximately 34.00%.
2. Which companies are prominent players in the Blockchain in Energy Sector Industry?
Key companies in the market include Accenture PLC, SAP SE (SAP), IBM Corporation, Btl Group Ltd, GREENEUM, Power Ledger Pty Ltd, Electron (Chaddenwych Services Limited), IOTA Foundation, LO3 Energy Inc, ImpactPPA*List Not Exhaustive, Drift Marketplace Inc.
3. What are the main segments of the Blockchain in Energy Sector Industry?
The market segments include Application.
4. Can you provide details about the market size?
The market size is estimated to be USD XX Million as of 2022.
5. What are some drivers contributing to market growth?
Emergence of Variable Electricity Rates and Need for Peer-to-peer Trading; Aggressive Spending by Venture Capitalists.
6. What are the notable trends driving market growth?
Payments Hold the Largest Share in the Market.
7. Are there any restraints impacting market growth?
Scalability Constraints.
8. Can you provide examples of recent developments in the market?
July 2022: DIC Corporation partnered with SAPSE to undertake a pilot project using blockchain technology to construct a waste plastics traceability system. The system aimed to advance the recycling of plastic resources.
9. What pricing options are available for accessing the report?
Pricing options include single-user, multi-user, and enterprise licenses priced at USD 4750, USD 5250, and USD 8750 respectively.
10. Is the market size provided in terms of value or volume?
The market size is provided in terms of value, measured in Million.
11. Are there any specific market keywords associated with the report?
Yes, the market keyword associated with the report is "Blockchain in Energy Sector Industry," which aids in identifying and referencing the specific market segment covered.
12. How do I determine which pricing option suits my needs best?
The pricing options vary based on user requirements and access needs. Individual users may opt for single-user licenses, while businesses requiring broader access may choose multi-user or enterprise licenses for cost-effective access to the report.
13. Are there any additional resources or data provided in the Blockchain in Energy Sector Industry report?
While the report offers comprehensive insights, it's advisable to review the specific contents or supplementary materials provided to ascertain if additional resources or data are available.
14. How can I stay updated on further developments or reports in the Blockchain in Energy Sector Industry?
To stay informed about further developments, trends, and reports in the Blockchain in Energy Sector Industry, consider subscribing to industry newsletters, following relevant companies and organizations, or regularly checking reputable industry news sources and publications.
Methodology
Step 1 - Identification of Relevant Samples Size from Population Database


Step 2 - Approaches for Defining Global Market Size (Value, Volume* & Price*)

Note*: In applicable scenarios
Step 3 - Data Sources
Primary Research
- Web Analytics
- Survey Reports
- Research Institute
- Latest Research Reports
- Opinion Leaders
Secondary Research
- Annual Reports
- White Paper
- Latest Press Release
- Industry Association
- Paid Database
- Investor Presentations

Step 4 - Data Triangulation
Involves using different sources of information in order to increase the validity of a study
These sources are likely to be stakeholders in a program - participants, other researchers, program staff, other community members, and so on.
Then we put all data in single framework & apply various statistical tools to find out the dynamic on the market.
During the analysis stage, feedback from the stakeholder groups would be compared to determine areas of agreement as well as areas of divergence


