
Key Insights
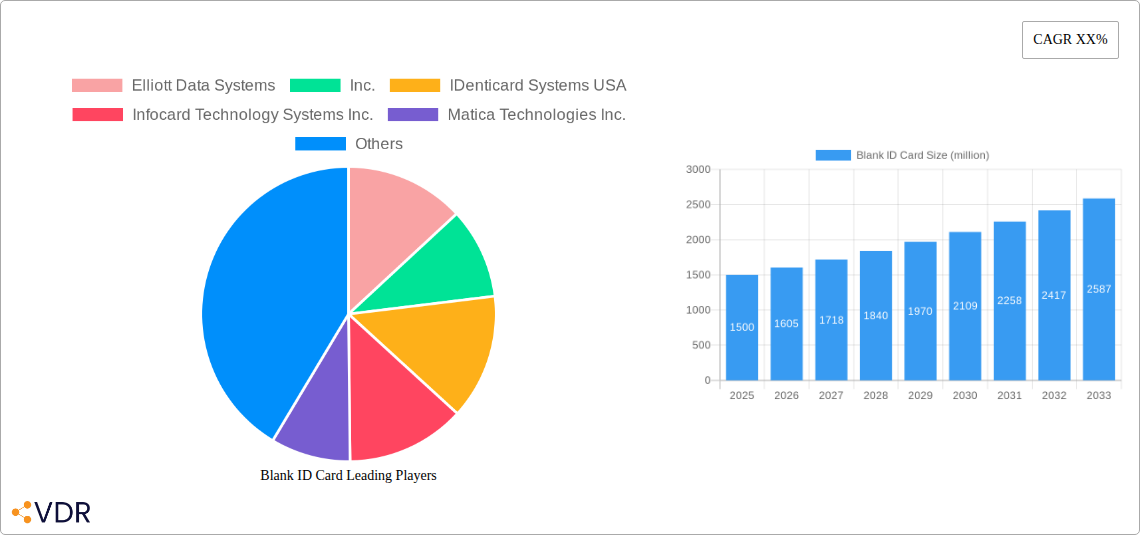
The blank ID card market is experiencing robust growth, driven by the increasing demand for secure identification across various sectors. The market, estimated at $1.5 billion in 2025, is projected to exhibit a Compound Annual Growth Rate (CAGR) of 7% from 2025 to 2033, reaching approximately $2.8 billion by the end of the forecast period. This expansion is fueled by several key factors. Government initiatives promoting digital identity and national ID programs are significantly boosting demand. Furthermore, the rising adoption of contactless technologies, such as RFID and NFC, in identification cards is creating new opportunities. The expanding use of blank ID cards in sectors like healthcare, education, and corporate access control contributes to market growth. While supply chain disruptions and fluctuating raw material prices pose potential challenges, the long-term outlook remains positive. The market is segmented based on card material (PVC, PET, etc.), technology (magnetic stripe, smart card, etc.), and application (government, corporate, etc.). Key players such as Elliott Data Systems, Inc., Matica Technologies Inc., and CPI Card Group, Inc. are driving innovation and competition within the market. Geographic expansion, particularly in developing economies with growing populations and increasing urbanization, is expected to further accelerate market growth in the coming years.
This growth is further supported by the increasing adoption of sophisticated security features within blank ID cards, such as holograms and UV printing, to prevent counterfeiting and fraud. The rising demand for personalized and customized ID cards is also creating niche opportunities. However, stringent regulations concerning data privacy and security present a restraint. The market is witnessing a shift towards environmentally friendly materials and sustainable manufacturing practices, reflecting growing environmental concerns. Competitive pricing strategies and the emergence of new technologies are impacting market dynamics. Future growth will hinge on the successful integration of blank ID card technology with emerging technologies like blockchain and biometric authentication systems. The market's segmentation provides opportunities for specialized players to cater to specific industry needs, fostering innovation and specialization.
Blank ID Card Market Report: 2019-2033
This comprehensive report provides an in-depth analysis of the global Blank ID Card market, encompassing historical data (2019-2024), current estimations (2025), and future projections (2025-2033). The report segments the market by various factors, offering a granular understanding of this dynamic industry. Key players like Elliott Data Systems, Inc., IDenticard Systems USA, and Matica Technologies Inc., among others, are analyzed to provide a complete market overview. This report is essential for industry professionals, investors, and stakeholders seeking to navigate the complexities of the blank ID card landscape.
Blank ID Card Market Dynamics & Structure
The global blank ID card market, valued at $xx million in 2025, exhibits a moderately concentrated structure with several key players commanding significant market share. Technological innovation, particularly in smart card technology and RFID integration, is a crucial driver. Stringent government regulations regarding data security and privacy influence market dynamics significantly. Competitive substitutes, such as digital identity solutions, pose a challenge. The end-user demographic is broad, encompassing government agencies, businesses, and individuals, contributing to market diversity. M&A activity within the sector remains moderate, with xx deals recorded in the past five years, primarily focused on expanding product portfolios and geographical reach.
- Market Concentration: Moderately concentrated, with top 5 players holding approximately xx% market share in 2025.
- Technological Innovation: Focus on embedded security features, biometric integration, and contactless technology.
- Regulatory Frameworks: Compliance with data privacy regulations (e.g., GDPR, CCPA) is paramount.
- Competitive Substitutes: Growing adoption of digital identity solutions presents a challenge.
- End-User Demographics: Government agencies (xx%), businesses (xx%), individuals (xx%).
- M&A Trends: xx M&A deals between 2020 and 2025, focusing on expansion and diversification.
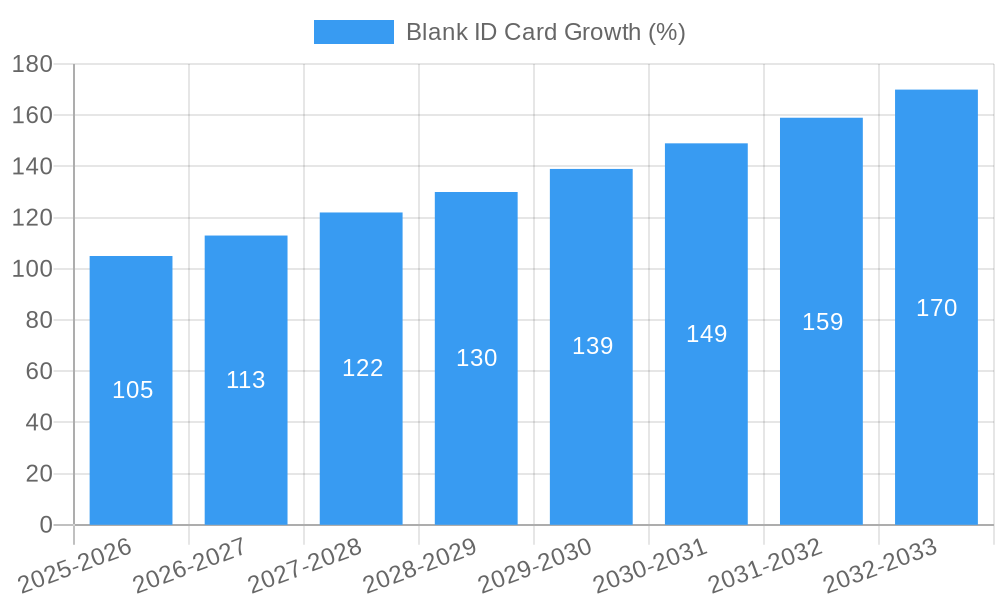
Blank ID Card Growth Trends & Insights
The blank ID card market experienced substantial growth during the historical period (2019-2024), driven by increasing demand across various sectors. The market size is projected to reach $xx million by 2033, exhibiting a CAGR of xx% during the forecast period (2025-2033). This growth is fueled by rising adoption rates across both developed and developing economies. Technological advancements, such as the integration of NFC and biometric features, are further driving market expansion. Consumer behavior shifts towards secure and convenient identification methods contribute to the market’s upward trajectory. Specific market segments, like government-issued IDs, are demonstrating higher growth rates compared to others, primarily due to government initiatives and security concerns. The market penetration rate is currently estimated at xx% and is expected to reach xx% by 2033.
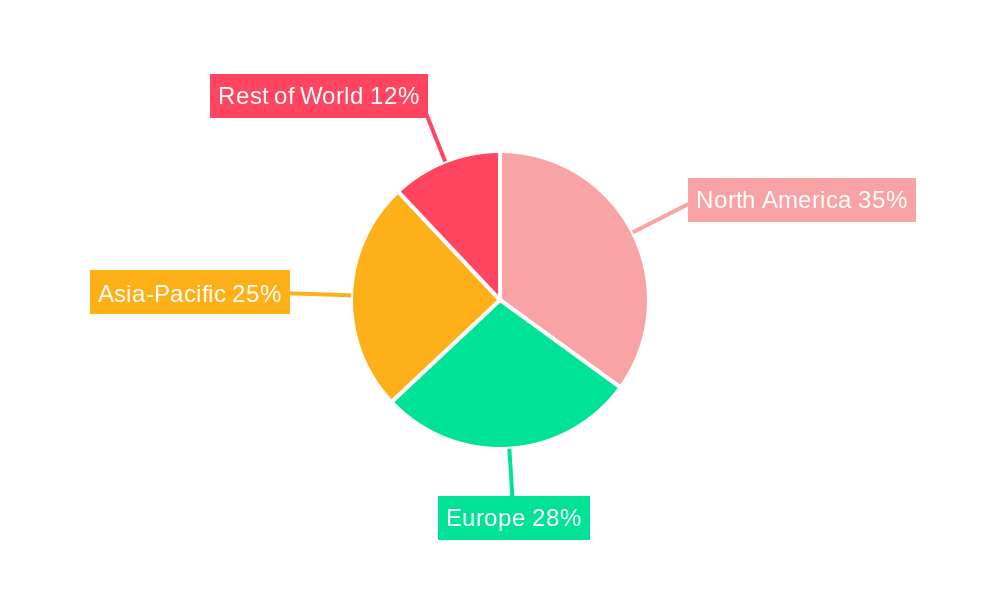
Dominant Regions, Countries, or Segments in Blank ID Card
North America currently holds the dominant position in the blank ID card market, with a market share of approximately xx% in 2025. This dominance is attributed to robust economic growth, advanced technological infrastructure, and stringent security regulations promoting the adoption of secure identification solutions. Europe also represents a significant market, fueled by government initiatives focused on improving citizen security and streamlined identification processes. The Asia-Pacific region is experiencing rapid growth due to increasing urbanization, expanding economies, and government investments in identity management systems.
- North America: Strong economic growth, advanced technological infrastructure, stringent security regulations.
- Europe: Government initiatives promoting secure identification, high adoption of contactless technologies.
- Asia-Pacific: Rapid economic growth, increasing urbanization, government investments in identity management.
Blank ID Card Product Landscape
The blank ID card market encompasses a wide range of products, including PVC cards, polycarbonate cards, and smart cards with embedded microchips. Product innovation focuses on enhancing security features, such as laser engraving, holographic elements, and embedded microprocessors. These advancements cater to diverse applications, ranging from employee identification to secure access control and national identification programs. Performance metrics are primarily focused on durability, security features, and ease of personalization. Unique selling propositions often revolve around advanced security features and cost-effectiveness.
Key Drivers, Barriers & Challenges in Blank ID Card
Key Drivers:
- Increasing government regulations demanding secure identification solutions.
- Rising demand for contactless and secure payment systems.
- Growth of the travel and tourism industry, requiring robust identity verification.
Key Challenges & Restraints:
- High initial investment costs associated with advanced technologies.
- Concerns regarding data security and privacy breaches.
- Intense competition among established players and emerging entrants.
- Supply chain disruptions impacting production and distribution.
Emerging Opportunities in Blank ID Card
- Expanding adoption of biometric technologies for enhanced security.
- Growth in the digital identity space, integrating blank ID cards with mobile applications.
- Untapped markets in developing economies with burgeoning identification needs.
- Increasing demand for specialized ID cards, such as those with embedded health information.
Growth Accelerators in the Blank ID Card Industry
Technological advancements, particularly in microchip technology and biometric integration, are key growth accelerators. Strategic partnerships between ID card manufacturers and technology providers are facilitating innovation. Government initiatives promoting secure identification systems are driving market expansion globally. Expansion into new geographical markets, particularly in developing economies, offers significant growth potential.
Key Players Shaping the Blank ID Card Market
- Elliott Data Systems, Inc.
- IDenticard Systems USA
- Infocard Technology Systems Inc.
- Matica Technologies Inc.
- NBS Technologies, Inc.
- Plasco, Inc.
- Radio Tactics Limited
- Able Card, LLC
- Alpha Card Systems
- Bristol ID Technologies
- Comtrex Systems Corporation
- CPI Card Group, Inc.
- DocuCopy Products
- ECR Sales & Service, Inc.
- Securetech Peripherals, Inc.
- SHANGHAI RFIDHY TECH. CO.,LTD
- Shenzhen Zhenghongsheng Intelligence Technology Co., Ltd.
- Vanguard ID Systems
- Wanda Lam Factory Direct
- Z-Fine Smart Card Co., Ltd.
Notable Milestones in Blank ID Card Sector
- 2020: Introduction of new polycarbonate blank ID cards with enhanced durability by Matica Technologies.
- 2021: CPI Card Group acquires a smaller competitor, expanding its market reach.
- 2022: Several major players invest heavily in RFID technology integration into blank ID cards.
- 2023: New regulations in several countries mandate the use of more secure blank ID card technologies.
- 2024: Several key players launch new contactless blank ID cards.
In-Depth Blank ID Card Market Outlook
The blank ID card market is poised for continued growth, driven by ongoing technological advancements and increasing demand for secure identification solutions across diverse sectors. Strategic partnerships, expansion into emerging markets, and the development of innovative product offerings will further fuel market expansion. The market's potential is substantial, with opportunities for both established players and new entrants to capitalize on the growing demand for secure and efficient identification technologies.
Blank ID Card Segmentation
-
1. Application
- 1.1. Office Building
- 1.2. Residential
- 1.3. Others
-
2. Types
- 2.1. Personal
- 2.2. Enterprise
Blank ID Card Segmentation By Geography
-
1. North America
- 1.1. United States
- 1.2. Canada
- 1.3. Mexico
-
2. South America
- 2.1. Brazil
- 2.2. Argentina
- 2.3. Rest of South America
-
3. Europe
- 3.1. United Kingdom
- 3.2. Germany
- 3.3. France
- 3.4. Italy
- 3.5. Spain
- 3.6. Russia
- 3.7. Benelux
- 3.8. Nordics
- 3.9. Rest of Europe
-
4. Middle East & Africa
- 4.1. Turkey
- 4.2. Israel
- 4.3. GCC
- 4.4. North Africa
- 4.5. South Africa
- 4.6. Rest of Middle East & Africa
-
5. Asia Pacific
- 5.1. China
- 5.2. India
- 5.3. Japan
- 5.4. South Korea
- 5.5. ASEAN
- 5.6. Oceania
- 5.7. Rest of Asia Pacific
Blank ID Card REPORT HIGHLIGHTS
| Aspects | Details |
|---|---|
| Study Period | 2019-2033 |
| Base Year | 2024 |
| Estimated Year | 2025 |
| Forecast Period | 2025-2033 |
| Historical Period | 2019-2024 |
| Growth Rate | CAGR of XX% from 2019-2033 |
| Segmentation |
|
Table of Contents
- 1. Introduction
- 1.1. Research Scope
- 1.2. Market Segmentation
- 1.3. Research Methodology
- 1.4. Definitions and Assumptions
- 2. Executive Summary
- 2.1. Introduction
- 3. Market Dynamics
- 3.1. Introduction
- 3.2. Market Drivers
- 3.3. Market Restrains
- 3.4. Market Trends
- 4. Market Factor Analysis
- 4.1. Porters Five Forces
- 4.2. Supply/Value Chain
- 4.3. PESTEL analysis
- 4.4. Market Entropy
- 4.5. Patent/Trademark Analysis
- 5. Global Blank ID Card Analysis, Insights and Forecast, 2019-2031
- 5.1. Market Analysis, Insights and Forecast - by Application
- 5.1.1. Office Building
- 5.1.2. Residential
- 5.1.3. Others
- 5.2. Market Analysis, Insights and Forecast - by Types
- 5.2.1. Personal
- 5.2.2. Enterprise
- 5.3. Market Analysis, Insights and Forecast - by Region
- 5.3.1. North America
- 5.3.2. South America
- 5.3.3. Europe
- 5.3.4. Middle East & Africa
- 5.3.5. Asia Pacific
- 5.1. Market Analysis, Insights and Forecast - by Application
- 6. North America Blank ID Card Analysis, Insights and Forecast, 2019-2031
- 6.1. Market Analysis, Insights and Forecast - by Application
- 6.1.1. Office Building
- 6.1.2. Residential
- 6.1.3. Others
- 6.2. Market Analysis, Insights and Forecast - by Types
- 6.2.1. Personal
- 6.2.2. Enterprise
- 6.1. Market Analysis, Insights and Forecast - by Application
- 7. South America Blank ID Card Analysis, Insights and Forecast, 2019-2031
- 7.1. Market Analysis, Insights and Forecast - by Application
- 7.1.1. Office Building
- 7.1.2. Residential
- 7.1.3. Others
- 7.2. Market Analysis, Insights and Forecast - by Types
- 7.2.1. Personal
- 7.2.2. Enterprise
- 7.1. Market Analysis, Insights and Forecast - by Application
- 8. Europe Blank ID Card Analysis, Insights and Forecast, 2019-2031
- 8.1. Market Analysis, Insights and Forecast - by Application
- 8.1.1. Office Building
- 8.1.2. Residential
- 8.1.3. Others
- 8.2. Market Analysis, Insights and Forecast - by Types
- 8.2.1. Personal
- 8.2.2. Enterprise
- 8.1. Market Analysis, Insights and Forecast - by Application
- 9. Middle East & Africa Blank ID Card Analysis, Insights and Forecast, 2019-2031
- 9.1. Market Analysis, Insights and Forecast - by Application
- 9.1.1. Office Building
- 9.1.2. Residential
- 9.1.3. Others
- 9.2. Market Analysis, Insights and Forecast - by Types
- 9.2.1. Personal
- 9.2.2. Enterprise
- 9.1. Market Analysis, Insights and Forecast - by Application
- 10. Asia Pacific Blank ID Card Analysis, Insights and Forecast, 2019-2031
- 10.1. Market Analysis, Insights and Forecast - by Application
- 10.1.1. Office Building
- 10.1.2. Residential
- 10.1.3. Others
- 10.2. Market Analysis, Insights and Forecast - by Types
- 10.2.1. Personal
- 10.2.2. Enterprise
- 10.1. Market Analysis, Insights and Forecast - by Application
- 11. Competitive Analysis
- 11.1. Global Market Share Analysis 2024
- 11.2. Company Profiles
- 11.2.1 Elliott Data Systems
- 11.2.1.1. Overview
- 11.2.1.2. Products
- 11.2.1.3. SWOT Analysis
- 11.2.1.4. Recent Developments
- 11.2.1.5. Financials (Based on Availability)
- 11.2.2 Inc.
- 11.2.2.1. Overview
- 11.2.2.2. Products
- 11.2.2.3. SWOT Analysis
- 11.2.2.4. Recent Developments
- 11.2.2.5. Financials (Based on Availability)
- 11.2.3 IDenticard Systems USA
- 11.2.3.1. Overview
- 11.2.3.2. Products
- 11.2.3.3. SWOT Analysis
- 11.2.3.4. Recent Developments
- 11.2.3.5. Financials (Based on Availability)
- 11.2.4 Infocard Technology Systems Inc.
- 11.2.4.1. Overview
- 11.2.4.2. Products
- 11.2.4.3. SWOT Analysis
- 11.2.4.4. Recent Developments
- 11.2.4.5. Financials (Based on Availability)
- 11.2.5 Matica Technologies Inc.
- 11.2.5.1. Overview
- 11.2.5.2. Products
- 11.2.5.3. SWOT Analysis
- 11.2.5.4. Recent Developments
- 11.2.5.5. Financials (Based on Availability)
- 11.2.6 NBS Technologies
- 11.2.6.1. Overview
- 11.2.6.2. Products
- 11.2.6.3. SWOT Analysis
- 11.2.6.4. Recent Developments
- 11.2.6.5. Financials (Based on Availability)
- 11.2.7 Inc.
- 11.2.7.1. Overview
- 11.2.7.2. Products
- 11.2.7.3. SWOT Analysis
- 11.2.7.4. Recent Developments
- 11.2.7.5. Financials (Based on Availability)
- 11.2.8 Plasco
- 11.2.8.1. Overview
- 11.2.8.2. Products
- 11.2.8.3. SWOT Analysis
- 11.2.8.4. Recent Developments
- 11.2.8.5. Financials (Based on Availability)
- 11.2.9 Inc.
- 11.2.9.1. Overview
- 11.2.9.2. Products
- 11.2.9.3. SWOT Analysis
- 11.2.9.4. Recent Developments
- 11.2.9.5. Financials (Based on Availability)
- 11.2.10 Radio Tactics Limited
- 11.2.10.1. Overview
- 11.2.10.2. Products
- 11.2.10.3. SWOT Analysis
- 11.2.10.4. Recent Developments
- 11.2.10.5. Financials (Based on Availability)
- 11.2.11 Able Card
- 11.2.11.1. Overview
- 11.2.11.2. Products
- 11.2.11.3. SWOT Analysis
- 11.2.11.4. Recent Developments
- 11.2.11.5. Financials (Based on Availability)
- 11.2.12 LLC
- 11.2.12.1. Overview
- 11.2.12.2. Products
- 11.2.12.3. SWOT Analysis
- 11.2.12.4. Recent Developments
- 11.2.12.5. Financials (Based on Availability)
- 11.2.13 Alpha Card Systems
- 11.2.13.1. Overview
- 11.2.13.2. Products
- 11.2.13.3. SWOT Analysis
- 11.2.13.4. Recent Developments
- 11.2.13.5. Financials (Based on Availability)
- 11.2.14 Bristol ID Technologies
- 11.2.14.1. Overview
- 11.2.14.2. Products
- 11.2.14.3. SWOT Analysis
- 11.2.14.4. Recent Developments
- 11.2.14.5. Financials (Based on Availability)
- 11.2.15 Comtrex Systems Corporation
- 11.2.15.1. Overview
- 11.2.15.2. Products
- 11.2.15.3. SWOT Analysis
- 11.2.15.4. Recent Developments
- 11.2.15.5. Financials (Based on Availability)
- 11.2.16 CPI Card Group
- 11.2.16.1. Overview
- 11.2.16.2. Products
- 11.2.16.3. SWOT Analysis
- 11.2.16.4. Recent Developments
- 11.2.16.5. Financials (Based on Availability)
- 11.2.17 Inc.
- 11.2.17.1. Overview
- 11.2.17.2. Products
- 11.2.17.3. SWOT Analysis
- 11.2.17.4. Recent Developments
- 11.2.17.5. Financials (Based on Availability)
- 11.2.18 DocuCopy Products
- 11.2.18.1. Overview
- 11.2.18.2. Products
- 11.2.18.3. SWOT Analysis
- 11.2.18.4. Recent Developments
- 11.2.18.5. Financials (Based on Availability)
- 11.2.19 ECR Sales & Service
- 11.2.19.1. Overview
- 11.2.19.2. Products
- 11.2.19.3. SWOT Analysis
- 11.2.19.4. Recent Developments
- 11.2.19.5. Financials (Based on Availability)
- 11.2.20 Inc.
- 11.2.20.1. Overview
- 11.2.20.2. Products
- 11.2.20.3. SWOT Analysis
- 11.2.20.4. Recent Developments
- 11.2.20.5. Financials (Based on Availability)
- 11.2.21 Securetech Peripherals
- 11.2.21.1. Overview
- 11.2.21.2. Products
- 11.2.21.3. SWOT Analysis
- 11.2.21.4. Recent Developments
- 11.2.21.5. Financials (Based on Availability)
- 11.2.22 Inc.
- 11.2.22.1. Overview
- 11.2.22.2. Products
- 11.2.22.3. SWOT Analysis
- 11.2.22.4. Recent Developments
- 11.2.22.5. Financials (Based on Availability)
- 11.2.23 SHANGHAI RFIDHY TECH. CO.
- 11.2.23.1. Overview
- 11.2.23.2. Products
- 11.2.23.3. SWOT Analysis
- 11.2.23.4. Recent Developments
- 11.2.23.5. Financials (Based on Availability)
- 11.2.24 LTD
- 11.2.24.1. Overview
- 11.2.24.2. Products
- 11.2.24.3. SWOT Analysis
- 11.2.24.4. Recent Developments
- 11.2.24.5. Financials (Based on Availability)
- 11.2.25 Shenzhen Zhenghongsheng Intelligence Technology Co.
- 11.2.25.1. Overview
- 11.2.25.2. Products
- 11.2.25.3. SWOT Analysis
- 11.2.25.4. Recent Developments
- 11.2.25.5. Financials (Based on Availability)
- 11.2.26 Ltd.
- 11.2.26.1. Overview
- 11.2.26.2. Products
- 11.2.26.3. SWOT Analysis
- 11.2.26.4. Recent Developments
- 11.2.26.5. Financials (Based on Availability)
- 11.2.27 Vanguard ID Systems
- 11.2.27.1. Overview
- 11.2.27.2. Products
- 11.2.27.3. SWOT Analysis
- 11.2.27.4. Recent Developments
- 11.2.27.5. Financials (Based on Availability)
- 11.2.28 Wanda Lam Factory Direct
- 11.2.28.1. Overview
- 11.2.28.2. Products
- 11.2.28.3. SWOT Analysis
- 11.2.28.4. Recent Developments
- 11.2.28.5. Financials (Based on Availability)
- 11.2.29 Z-Fine Smart Card Co.
- 11.2.29.1. Overview
- 11.2.29.2. Products
- 11.2.29.3. SWOT Analysis
- 11.2.29.4. Recent Developments
- 11.2.29.5. Financials (Based on Availability)
- 11.2.30 Ltd.
- 11.2.30.1. Overview
- 11.2.30.2. Products
- 11.2.30.3. SWOT Analysis
- 11.2.30.4. Recent Developments
- 11.2.30.5. Financials (Based on Availability)
- 11.2.1 Elliott Data Systems
List of Figures
- Figure 1: Global Blank ID Card Revenue Breakdown (million, %) by Region 2024 & 2032
- Figure 2: Global Blank ID Card Volume Breakdown (K, %) by Region 2024 & 2032
- Figure 3: North America Blank ID Card Revenue (million), by Application 2024 & 2032
- Figure 4: North America Blank ID Card Volume (K), by Application 2024 & 2032
- Figure 5: North America Blank ID Card Revenue Share (%), by Application 2024 & 2032
- Figure 6: North America Blank ID Card Volume Share (%), by Application 2024 & 2032
- Figure 7: North America Blank ID Card Revenue (million), by Types 2024 & 2032
- Figure 8: North America Blank ID Card Volume (K), by Types 2024 & 2032
- Figure 9: North America Blank ID Card Revenue Share (%), by Types 2024 & 2032
- Figure 10: North America Blank ID Card Volume Share (%), by Types 2024 & 2032
- Figure 11: North America Blank ID Card Revenue (million), by Country 2024 & 2032
- Figure 12: North America Blank ID Card Volume (K), by Country 2024 & 2032
- Figure 13: North America Blank ID Card Revenue Share (%), by Country 2024 & 2032
- Figure 14: North America Blank ID Card Volume Share (%), by Country 2024 & 2032
- Figure 15: South America Blank ID Card Revenue (million), by Application 2024 & 2032
- Figure 16: South America Blank ID Card Volume (K), by Application 2024 & 2032
- Figure 17: South America Blank ID Card Revenue Share (%), by Application 2024 & 2032
- Figure 18: South America Blank ID Card Volume Share (%), by Application 2024 & 2032
- Figure 19: South America Blank ID Card Revenue (million), by Types 2024 & 2032
- Figure 20: South America Blank ID Card Volume (K), by Types 2024 & 2032
- Figure 21: South America Blank ID Card Revenue Share (%), by Types 2024 & 2032
- Figure 22: South America Blank ID Card Volume Share (%), by Types 2024 & 2032
- Figure 23: South America Blank ID Card Revenue (million), by Country 2024 & 2032
- Figure 24: South America Blank ID Card Volume (K), by Country 2024 & 2032
- Figure 25: South America Blank ID Card Revenue Share (%), by Country 2024 & 2032
- Figure 26: South America Blank ID Card Volume Share (%), by Country 2024 & 2032
- Figure 27: Europe Blank ID Card Revenue (million), by Application 2024 & 2032
- Figure 28: Europe Blank ID Card Volume (K), by Application 2024 & 2032
- Figure 29: Europe Blank ID Card Revenue Share (%), by Application 2024 & 2032
- Figure 30: Europe Blank ID Card Volume Share (%), by Application 2024 & 2032
- Figure 31: Europe Blank ID Card Revenue (million), by Types 2024 & 2032
- Figure 32: Europe Blank ID Card Volume (K), by Types 2024 & 2032
- Figure 33: Europe Blank ID Card Revenue Share (%), by Types 2024 & 2032
- Figure 34: Europe Blank ID Card Volume Share (%), by Types 2024 & 2032
- Figure 35: Europe Blank ID Card Revenue (million), by Country 2024 & 2032
- Figure 36: Europe Blank ID Card Volume (K), by Country 2024 & 2032
- Figure 37: Europe Blank ID Card Revenue Share (%), by Country 2024 & 2032
- Figure 38: Europe Blank ID Card Volume Share (%), by Country 2024 & 2032
- Figure 39: Middle East & Africa Blank ID Card Revenue (million), by Application 2024 & 2032
- Figure 40: Middle East & Africa Blank ID Card Volume (K), by Application 2024 & 2032
- Figure 41: Middle East & Africa Blank ID Card Revenue Share (%), by Application 2024 & 2032
- Figure 42: Middle East & Africa Blank ID Card Volume Share (%), by Application 2024 & 2032
- Figure 43: Middle East & Africa Blank ID Card Revenue (million), by Types 2024 & 2032
- Figure 44: Middle East & Africa Blank ID Card Volume (K), by Types 2024 & 2032
- Figure 45: Middle East & Africa Blank ID Card Revenue Share (%), by Types 2024 & 2032
- Figure 46: Middle East & Africa Blank ID Card Volume Share (%), by Types 2024 & 2032
- Figure 47: Middle East & Africa Blank ID Card Revenue (million), by Country 2024 & 2032
- Figure 48: Middle East & Africa Blank ID Card Volume (K), by Country 2024 & 2032
- Figure 49: Middle East & Africa Blank ID Card Revenue Share (%), by Country 2024 & 2032
- Figure 50: Middle East & Africa Blank ID Card Volume Share (%), by Country 2024 & 2032
- Figure 51: Asia Pacific Blank ID Card Revenue (million), by Application 2024 & 2032
- Figure 52: Asia Pacific Blank ID Card Volume (K), by Application 2024 & 2032
- Figure 53: Asia Pacific Blank ID Card Revenue Share (%), by Application 2024 & 2032
- Figure 54: Asia Pacific Blank ID Card Volume Share (%), by Application 2024 & 2032
- Figure 55: Asia Pacific Blank ID Card Revenue (million), by Types 2024 & 2032
- Figure 56: Asia Pacific Blank ID Card Volume (K), by Types 2024 & 2032
- Figure 57: Asia Pacific Blank ID Card Revenue Share (%), by Types 2024 & 2032
- Figure 58: Asia Pacific Blank ID Card Volume Share (%), by Types 2024 & 2032
- Figure 59: Asia Pacific Blank ID Card Revenue (million), by Country 2024 & 2032
- Figure 60: Asia Pacific Blank ID Card Volume (K), by Country 2024 & 2032
- Figure 61: Asia Pacific Blank ID Card Revenue Share (%), by Country 2024 & 2032
- Figure 62: Asia Pacific Blank ID Card Volume Share (%), by Country 2024 & 2032
List of Tables
- Table 1: Global Blank ID Card Revenue million Forecast, by Region 2019 & 2032
- Table 2: Global Blank ID Card Volume K Forecast, by Region 2019 & 2032
- Table 3: Global Blank ID Card Revenue million Forecast, by Application 2019 & 2032
- Table 4: Global Blank ID Card Volume K Forecast, by Application 2019 & 2032
- Table 5: Global Blank ID Card Revenue million Forecast, by Types 2019 & 2032
- Table 6: Global Blank ID Card Volume K Forecast, by Types 2019 & 2032
- Table 7: Global Blank ID Card Revenue million Forecast, by Region 2019 & 2032
- Table 8: Global Blank ID Card Volume K Forecast, by Region 2019 & 2032
- Table 9: Global Blank ID Card Revenue million Forecast, by Application 2019 & 2032
- Table 10: Global Blank ID Card Volume K Forecast, by Application 2019 & 2032
- Table 11: Global Blank ID Card Revenue million Forecast, by Types 2019 & 2032
- Table 12: Global Blank ID Card Volume K Forecast, by Types 2019 & 2032
- Table 13: Global Blank ID Card Revenue million Forecast, by Country 2019 & 2032
- Table 14: Global Blank ID Card Volume K Forecast, by Country 2019 & 2032
- Table 15: United States Blank ID Card Revenue (million) Forecast, by Application 2019 & 2032
- Table 16: United States Blank ID Card Volume (K) Forecast, by Application 2019 & 2032
- Table 17: Canada Blank ID Card Revenue (million) Forecast, by Application 2019 & 2032
- Table 18: Canada Blank ID Card Volume (K) Forecast, by Application 2019 & 2032
- Table 19: Mexico Blank ID Card Revenue (million) Forecast, by Application 2019 & 2032
- Table 20: Mexico Blank ID Card Volume (K) Forecast, by Application 2019 & 2032
- Table 21: Global Blank ID Card Revenue million Forecast, by Application 2019 & 2032
- Table 22: Global Blank ID Card Volume K Forecast, by Application 2019 & 2032
- Table 23: Global Blank ID Card Revenue million Forecast, by Types 2019 & 2032
- Table 24: Global Blank ID Card Volume K Forecast, by Types 2019 & 2032
- Table 25: Global Blank ID Card Revenue million Forecast, by Country 2019 & 2032
- Table 26: Global Blank ID Card Volume K Forecast, by Country 2019 & 2032
- Table 27: Brazil Blank ID Card Revenue (million) Forecast, by Application 2019 & 2032
- Table 28: Brazil Blank ID Card Volume (K) Forecast, by Application 2019 & 2032
- Table 29: Argentina Blank ID Card Revenue (million) Forecast, by Application 2019 & 2032
- Table 30: Argentina Blank ID Card Volume (K) Forecast, by Application 2019 & 2032
- Table 31: Rest of South America Blank ID Card Revenue (million) Forecast, by Application 2019 & 2032
- Table 32: Rest of South America Blank ID Card Volume (K) Forecast, by Application 2019 & 2032
- Table 33: Global Blank ID Card Revenue million Forecast, by Application 2019 & 2032
- Table 34: Global Blank ID Card Volume K Forecast, by Application 2019 & 2032
- Table 35: Global Blank ID Card Revenue million Forecast, by Types 2019 & 2032
- Table 36: Global Blank ID Card Volume K Forecast, by Types 2019 & 2032
- Table 37: Global Blank ID Card Revenue million Forecast, by Country 2019 & 2032
- Table 38: Global Blank ID Card Volume K Forecast, by Country 2019 & 2032
- Table 39: United Kingdom Blank ID Card Revenue (million) Forecast, by Application 2019 & 2032
- Table 40: United Kingdom Blank ID Card Volume (K) Forecast, by Application 2019 & 2032
- Table 41: Germany Blank ID Card Revenue (million) Forecast, by Application 2019 & 2032
- Table 42: Germany Blank ID Card Volume (K) Forecast, by Application 2019 & 2032
- Table 43: France Blank ID Card Revenue (million) Forecast, by Application 2019 & 2032
- Table 44: France Blank ID Card Volume (K) Forecast, by Application 2019 & 2032
- Table 45: Italy Blank ID Card Revenue (million) Forecast, by Application 2019 & 2032
- Table 46: Italy Blank ID Card Volume (K) Forecast, by Application 2019 & 2032
- Table 47: Spain Blank ID Card Revenue (million) Forecast, by Application 2019 & 2032
- Table 48: Spain Blank ID Card Volume (K) Forecast, by Application 2019 & 2032
- Table 49: Russia Blank ID Card Revenue (million) Forecast, by Application 2019 & 2032
- Table 50: Russia Blank ID Card Volume (K) Forecast, by Application 2019 & 2032
- Table 51: Benelux Blank ID Card Revenue (million) Forecast, by Application 2019 & 2032
- Table 52: Benelux Blank ID Card Volume (K) Forecast, by Application 2019 & 2032
- Table 53: Nordics Blank ID Card Revenue (million) Forecast, by Application 2019 & 2032
- Table 54: Nordics Blank ID Card Volume (K) Forecast, by Application 2019 & 2032
- Table 55: Rest of Europe Blank ID Card Revenue (million) Forecast, by Application 2019 & 2032
- Table 56: Rest of Europe Blank ID Card Volume (K) Forecast, by Application 2019 & 2032
- Table 57: Global Blank ID Card Revenue million Forecast, by Application 2019 & 2032
- Table 58: Global Blank ID Card Volume K Forecast, by Application 2019 & 2032
- Table 59: Global Blank ID Card Revenue million Forecast, by Types 2019 & 2032
- Table 60: Global Blank ID Card Volume K Forecast, by Types 2019 & 2032
- Table 61: Global Blank ID Card Revenue million Forecast, by Country 2019 & 2032
- Table 62: Global Blank ID Card Volume K Forecast, by Country 2019 & 2032
- Table 63: Turkey Blank ID Card Revenue (million) Forecast, by Application 2019 & 2032
- Table 64: Turkey Blank ID Card Volume (K) Forecast, by Application 2019 & 2032
- Table 65: Israel Blank ID Card Revenue (million) Forecast, by Application 2019 & 2032
- Table 66: Israel Blank ID Card Volume (K) Forecast, by Application 2019 & 2032
- Table 67: GCC Blank ID Card Revenue (million) Forecast, by Application 2019 & 2032
- Table 68: GCC Blank ID Card Volume (K) Forecast, by Application 2019 & 2032
- Table 69: North Africa Blank ID Card Revenue (million) Forecast, by Application 2019 & 2032
- Table 70: North Africa Blank ID Card Volume (K) Forecast, by Application 2019 & 2032
- Table 71: South Africa Blank ID Card Revenue (million) Forecast, by Application 2019 & 2032
- Table 72: South Africa Blank ID Card Volume (K) Forecast, by Application 2019 & 2032
- Table 73: Rest of Middle East & Africa Blank ID Card Revenue (million) Forecast, by Application 2019 & 2032
- Table 74: Rest of Middle East & Africa Blank ID Card Volume (K) Forecast, by Application 2019 & 2032
- Table 75: Global Blank ID Card Revenue million Forecast, by Application 2019 & 2032
- Table 76: Global Blank ID Card Volume K Forecast, by Application 2019 & 2032
- Table 77: Global Blank ID Card Revenue million Forecast, by Types 2019 & 2032
- Table 78: Global Blank ID Card Volume K Forecast, by Types 2019 & 2032
- Table 79: Global Blank ID Card Revenue million Forecast, by Country 2019 & 2032
- Table 80: Global Blank ID Card Volume K Forecast, by Country 2019 & 2032
- Table 81: China Blank ID Card Revenue (million) Forecast, by Application 2019 & 2032
- Table 82: China Blank ID Card Volume (K) Forecast, by Application 2019 & 2032
- Table 83: India Blank ID Card Revenue (million) Forecast, by Application 2019 & 2032
- Table 84: India Blank ID Card Volume (K) Forecast, by Application 2019 & 2032
- Table 85: Japan Blank ID Card Revenue (million) Forecast, by Application 2019 & 2032
- Table 86: Japan Blank ID Card Volume (K) Forecast, by Application 2019 & 2032
- Table 87: South Korea Blank ID Card Revenue (million) Forecast, by Application 2019 & 2032
- Table 88: South Korea Blank ID Card Volume (K) Forecast, by Application 2019 & 2032
- Table 89: ASEAN Blank ID Card Revenue (million) Forecast, by Application 2019 & 2032
- Table 90: ASEAN Blank ID Card Volume (K) Forecast, by Application 2019 & 2032
- Table 91: Oceania Blank ID Card Revenue (million) Forecast, by Application 2019 & 2032
- Table 92: Oceania Blank ID Card Volume (K) Forecast, by Application 2019 & 2032
- Table 93: Rest of Asia Pacific Blank ID Card Revenue (million) Forecast, by Application 2019 & 2032
- Table 94: Rest of Asia Pacific Blank ID Card Volume (K) Forecast, by Application 2019 & 2032
Frequently Asked Questions
1. What is the projected Compound Annual Growth Rate (CAGR) of the Blank ID Card?
The projected CAGR is approximately XX%.
2. Which companies are prominent players in the Blank ID Card?
Key companies in the market include Elliott Data Systems, Inc., IDenticard Systems USA, Infocard Technology Systems Inc., Matica Technologies Inc., NBS Technologies, Inc., Plasco, Inc., Radio Tactics Limited, Able Card, LLC, Alpha Card Systems, Bristol ID Technologies, Comtrex Systems Corporation, CPI Card Group, Inc., DocuCopy Products, ECR Sales & Service, Inc., Securetech Peripherals, Inc., SHANGHAI RFIDHY TECH. CO., LTD, Shenzhen Zhenghongsheng Intelligence Technology Co., Ltd., Vanguard ID Systems, Wanda Lam Factory Direct, Z-Fine Smart Card Co., Ltd..
3. What are the main segments of the Blank ID Card?
The market segments include Application, Types.
4. Can you provide details about the market size?
The market size is estimated to be USD XXX million as of 2022.
5. What are some drivers contributing to market growth?
N/A
6. What are the notable trends driving market growth?
N/A
7. Are there any restraints impacting market growth?
N/A
8. Can you provide examples of recent developments in the market?
N/A
9. What pricing options are available for accessing the report?
Pricing options include single-user, multi-user, and enterprise licenses priced at USD 3350.00, USD 5025.00, and USD 6700.00 respectively.
10. Is the market size provided in terms of value or volume?
The market size is provided in terms of value, measured in million and volume, measured in K.
11. Are there any specific market keywords associated with the report?
Yes, the market keyword associated with the report is "Blank ID Card," which aids in identifying and referencing the specific market segment covered.
12. How do I determine which pricing option suits my needs best?
The pricing options vary based on user requirements and access needs. Individual users may opt for single-user licenses, while businesses requiring broader access may choose multi-user or enterprise licenses for cost-effective access to the report.
13. Are there any additional resources or data provided in the Blank ID Card report?
While the report offers comprehensive insights, it's advisable to review the specific contents or supplementary materials provided to ascertain if additional resources or data are available.
14. How can I stay updated on further developments or reports in the Blank ID Card?
To stay informed about further developments, trends, and reports in the Blank ID Card, consider subscribing to industry newsletters, following relevant companies and organizations, or regularly checking reputable industry news sources and publications.
Methodology
Step 1 - Identification of Relevant Samples Size from Population Database


Step 2 - Approaches for Defining Global Market Size (Value, Volume* & Price*)

Note*: In applicable scenarios
Step 3 - Data Sources
Primary Research
- Web Analytics
- Survey Reports
- Research Institute
- Latest Research Reports
- Opinion Leaders
Secondary Research
- Annual Reports
- White Paper
- Latest Press Release
- Industry Association
- Paid Database
- Investor Presentations

Step 4 - Data Triangulation
Involves using different sources of information in order to increase the validity of a study
These sources are likely to be stakeholders in a program - participants, other researchers, program staff, other community members, and so on.
Then we put all data in single framework & apply various statistical tools to find out the dynamic on the market.
During the analysis stage, feedback from the stakeholder groups would be compared to determine areas of agreement as well as areas of divergence


