
Key Insights
The bioliquid heat and power generation market is experiencing robust growth, driven by increasing demand for renewable energy sources and stringent environmental regulations aimed at reducing carbon emissions. The market's Compound Annual Growth Rate (CAGR) exceeding 7.10% from 2019-2024 indicates a significant upward trajectory, projected to continue through 2033. Key drivers include government incentives promoting renewable energy adoption, rising energy prices, and the increasing availability of sustainable feedstocks for bioliquid production. Technological advancements in engine and turbine technologies are further enhancing efficiency and reducing the cost of bioliquid-based power generation. The market is segmented by fuel type (bio-ethanol, biodiesel, and others) and technology (engine, turbine, and others), with bio-ethanol and engine technologies currently dominating. North America and Europe are major regional markets, reflecting early adoption of renewable energy policies and a strong industrial base. However, growth opportunities are emerging in Asia-Pacific and South America, driven by increasing energy demand and supportive government initiatives. Despite these positive trends, challenges remain, including the fluctuating cost of feedstocks, technological limitations in certain applications, and the need for further infrastructure development to support wider bioliquid adoption.
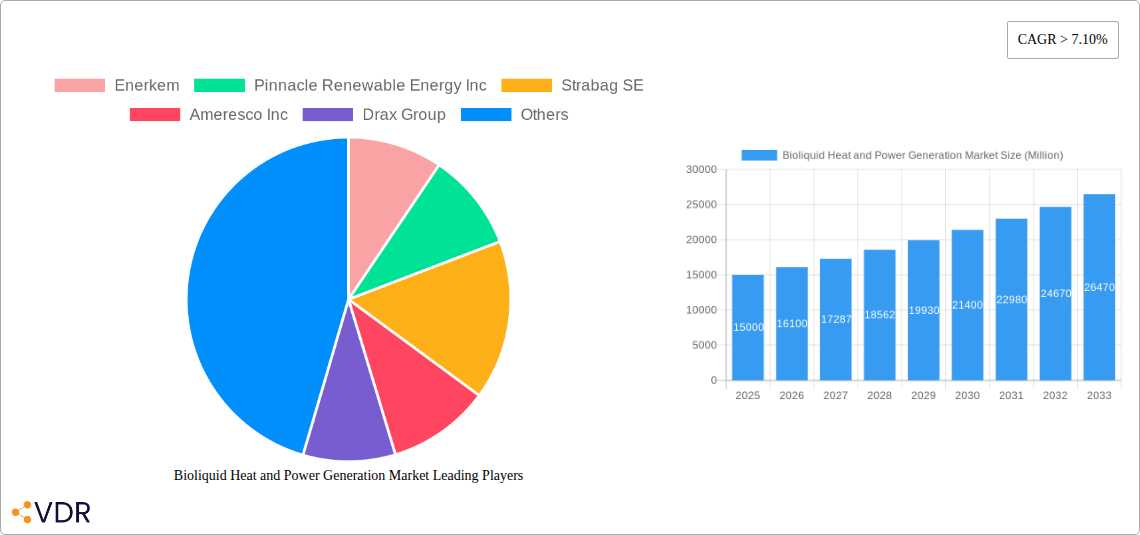
The competitive landscape is characterized by a mix of established energy companies, specialized bioliquid producers, and engineering firms. Companies like Enerkem, Pinnacle Renewable Energy, Strabag SE, and Drax Group are leading the market, leveraging their expertise in bioenergy production and infrastructure development. Future growth will depend on factors such as technological innovation, policy support, and the ability of companies to secure sustainable feedstock supplies at competitive prices. The market is poised for significant expansion, with opportunities for companies to capitalize on the growing demand for sustainable and decentralized energy solutions. Further research and development into cost-effective bioliquid production technologies and improved energy storage solutions will be crucial in realizing the full potential of this market.
Bioliquid Heat and Power Generation Market: A Comprehensive Report (2019-2033)
This comprehensive report provides a detailed analysis of the Bioliquid Heat and Power Generation market, encompassing market dynamics, growth trends, regional dominance, product landscape, key players, and future outlook. The study period spans from 2019 to 2033, with 2025 serving as the base and estimated year. This report is an essential resource for industry professionals, investors, and stakeholders seeking a deep understanding of this rapidly evolving sector. The parent market is the Renewable Energy market, while the child market is specifically Bioliquid based Heat and Power Generation.
Bioliquid Heat and Power Generation Market Dynamics & Structure
The Bioliquid Heat and Power Generation market is characterized by moderate concentration, with key players such as Enerkem, Pinnacle Renewable Energy Inc, Strabag SE, Ameresco Inc, Drax Group, Enviva Inc, Green Plains Inc, Archer-Daniels-Midland Co, Envitec Biogas AG, and Albioma SA shaping the competitive landscape. Technological innovation, particularly in engine and turbine technologies, is a major driver, alongside supportive regulatory frameworks like the biodiesel tax credit (BTC) extension in the US. However, challenges remain, including the availability of sustainable feedstock and the cost-competitiveness with fossil fuels.
- Market Concentration: Moderately concentrated, with the top 10 players holding an estimated xx% market share in 2025.
- Technological Innovation: Strong focus on improving engine and turbine efficiency, reducing emissions, and exploring novel bioliquid feedstocks.
- Regulatory Landscape: Favorable policies in several regions, particularly regarding renewable energy mandates and tax incentives. The BTC extension is a significant positive factor.
- Competitive Substitutes: Fossil fuels remain a significant competitive threat, especially concerning price fluctuations.
- End-User Demographics: Diverse end-users, including industrial facilities, power plants, and district heating systems.
- M&A Trends: A moderate level of M&A activity is observed, driven by efforts to expand capacity and secure feedstock supplies. An estimated xx M&A deals were recorded between 2019 and 2024. Innovation barriers include high R&D costs and the complexity of integrating new technologies.
Bioliquid Heat and Power Generation Market Growth Trends & Insights
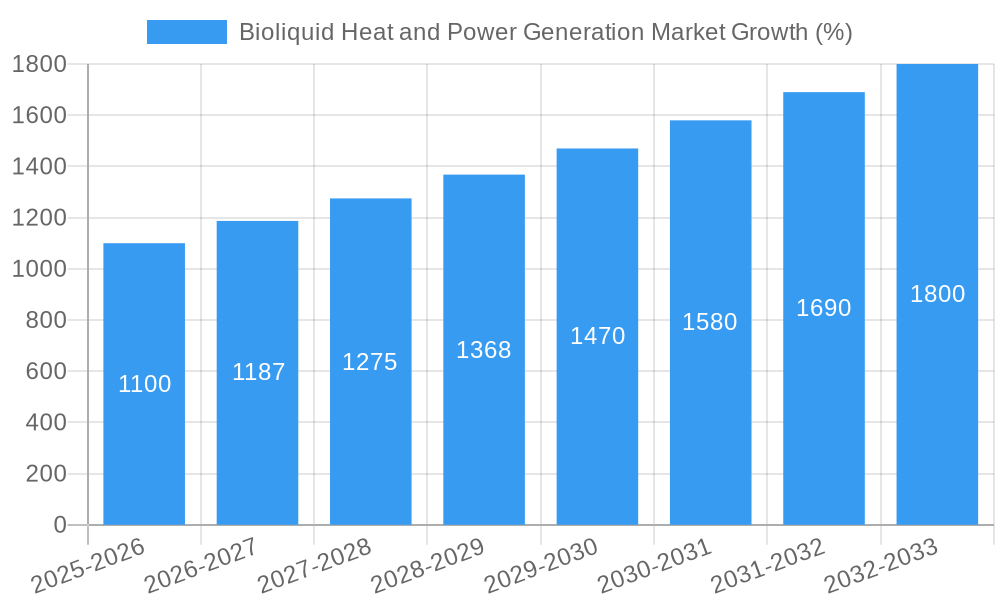
The Bioliquid Heat and Power Generation market exhibited steady growth between 2019 and 2024, with a Compound Annual Growth Rate (CAGR) of xx%. This growth is driven by rising demand for renewable energy, increasing environmental concerns, and supportive government policies. Market penetration remains relatively low compared to fossil fuels, but adoption rates are projected to accelerate during the forecast period (2025-2033). Technological disruptions, such as advancements in bioliquid production and conversion technologies, are further accelerating market growth. Consumer behavior is shifting towards environmentally friendly energy solutions. The market size is projected to reach xx Million units by 2033, representing a CAGR of xx% from 2025 to 2033.
Dominant Regions, Countries, or Segments in Bioliquid Heat and Power Generation Market
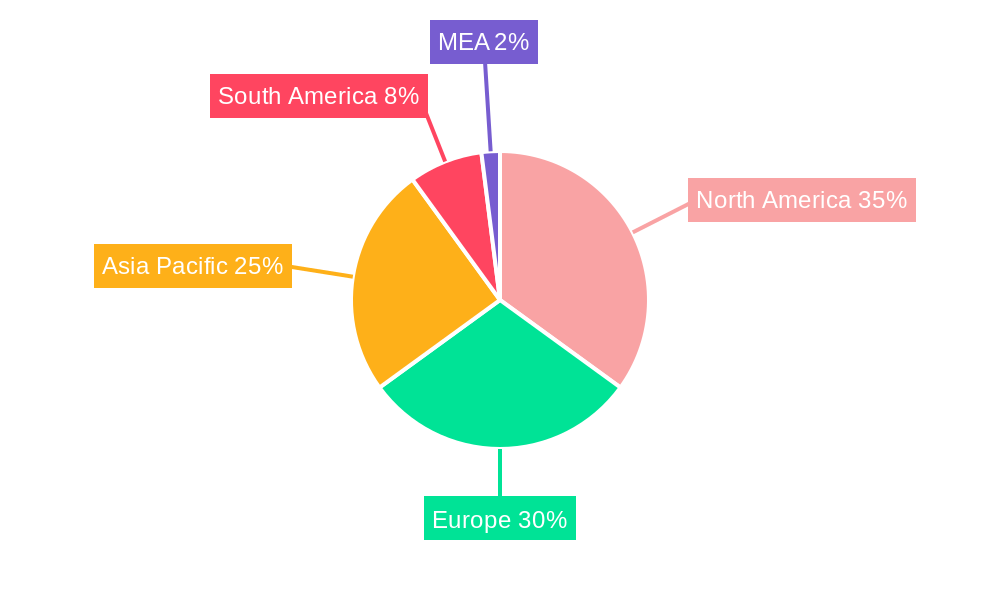
North America, particularly the United States, is currently the dominant region in the Bioliquid Heat and Power Generation market, driven by supportive government policies like the BTC and a relatively mature infrastructure for biofuel production. Europe also holds a significant share, with strong emphasis on renewable energy targets. Within the fuel type segments, Biodiesel is currently the leading segment due to its established market and existing infrastructure. Engine technology currently dominates the technology segment.
- Key Drivers (North America): Biodiesel Tax Credit (BTC), robust renewable energy mandates, and well-established biofuel production infrastructure.
- Key Drivers (Europe): Stringent emission regulations, supportive government policies promoting renewable energy adoption, and increasing awareness of environmental sustainability.
- Market Share & Growth Potential (Biodiesel): Biodiesel currently holds the largest market share in the fuel type segment, with strong growth potential fueled by existing infrastructure and improving production efficiency.
- Market Share & Growth Potential (Engine Technology): Engine technology dominates the technology segment due to its relative maturity, cost-effectiveness and proven performance. However, turbine technology is poised for growth due to increased efficiency at large scales.
Bioliquid Heat and Power Generation Market Product Landscape
The Bioliquid Heat and Power Generation market offers a variety of products catering to diverse applications and performance requirements. Innovations focus on improving efficiency, reducing emissions, and expanding the range of suitable bioliquids. Key advancements include enhanced engine designs, advanced turbine technologies, and more efficient heat recovery systems. Unique selling propositions include reduced greenhouse gas emissions compared to fossil fuels and the potential for decentralized energy generation.
Key Drivers, Barriers & Challenges in Bioliquid Heat and Power Generation Market
Key Drivers: Increasing demand for renewable energy, stringent environmental regulations, government incentives (e.g., the BTC), and technological advancements leading to cost reduction and efficiency improvements.
Key Challenges: High initial capital investment costs for new plants, competition from fossil fuels (especially concerning price volatility), and the need for a stable and sustainable supply chain for feedstocks. Supply chain disruptions due to geopolitical factors can significantly impact production and cost, with an estimated xx% increase in price observed during periods of supply chain instability. Regulatory hurdles vary across regions and can cause delays in project implementation. Intense competition among existing players also acts as a challenge.
Emerging Opportunities in Bioliquid Heat and Power Generation Market
Emerging opportunities lie in untapped markets in developing economies, the integration of bioliquid technology with other renewable energy sources (e.g., solar, wind), and the exploration of advanced bioliquid feedstocks derived from waste materials. Innovative applications in off-grid power generation and decentralized heating systems also present significant growth potential.
Growth Accelerators in the Bioliquid Heat and Power Generation Market Industry
Technological breakthroughs in bioliquid production and conversion technologies are accelerating market growth. Strategic partnerships between biofuel producers, energy companies, and technology providers are fostering innovation and market expansion. Government initiatives promoting the adoption of renewable energy are creating favorable market conditions.
Key Players Shaping the Bioliquid Heat and Power Generation Market Market
- Enerkem
- Pinnacle Renewable Energy Inc
- Strabag SE
- Ameresco Inc
- Drax Group
- Enviva Inc
- Green Plains Inc
- Archer-Daniels-Midland Co
- Envitec Biogas AG
- Albioma SA
Notable Milestones in Bioliquid Heat and Power Generation Market Sector
- 2020: The United States government renewed the biodiesel tax credit (BTC) through 2022, boosting biodiesel production and market growth.
- [Insert other relevant milestones with dates and brief descriptions of their impact]
In-Depth Bioliquid Heat and Power Generation Market Market Outlook
The Bioliquid Heat and Power Generation market is poised for substantial growth in the coming years, driven by a confluence of factors including supportive government policies, technological advancements, and growing consumer demand for sustainable energy solutions. Strategic investments in research and development, expansion into new markets, and the development of innovative applications will be crucial for companies to capitalize on the significant opportunities in this sector. The market is expected to see significant growth in the adoption of turbine technologies, particularly in larger scale applications.
Bioliquid Heat and Power Generation Market Segmentation
-
1. Fuel Type
- 1.1. Bio-ethanol
- 1.2. Biodiesel
- 1.3. Others
-
2. Technoligy
- 2.1. Engine
- 2.2. Turbine
- 2.3. Others
Bioliquid Heat and Power Generation Market Segmentation By Geography
- 1. North America
- 2. Europe
- 3. Asia Pacific
- 4. South America
- 5. Middle East and Africa
Bioliquid Heat and Power Generation Market REPORT HIGHLIGHTS
| Aspects | Details |
|---|---|
| Study Period | 2019-2033 |
| Base Year | 2024 |
| Estimated Year | 2025 |
| Forecast Period | 2025-2033 |
| Historical Period | 2019-2024 |
| Growth Rate | CAGR of > 7.10% from 2019-2033 |
| Segmentation |
|
Table of Contents
- 1. Introduction
- 1.1. Research Scope
- 1.2. Market Segmentation
- 1.3. Research Methodology
- 1.4. Definitions and Assumptions
- 2. Executive Summary
- 2.1. Introduction
- 3. Market Dynamics
- 3.1. Introduction
- 3.2. Market Drivers
- 3.2.1. 4.; Improved Viability Of Offshore Oil And Gas Projects
- 3.3. Market Restrains
- 3.3.1. 4.; Ban On Offshore Exploration And Production Activities In Multiple Regions
- 3.4. Market Trends
- 3.4.1. Bioethanol Segment is to Dominate the Market
- 4. Market Factor Analysis
- 4.1. Porters Five Forces
- 4.2. Supply/Value Chain
- 4.3. PESTEL analysis
- 4.4. Market Entropy
- 4.5. Patent/Trademark Analysis
- 5. Global Bioliquid Heat and Power Generation Market Analysis, Insights and Forecast, 2019-2031
- 5.1. Market Analysis, Insights and Forecast - by Fuel Type
- 5.1.1. Bio-ethanol
- 5.1.2. Biodiesel
- 5.1.3. Others
- 5.2. Market Analysis, Insights and Forecast - by Technoligy
- 5.2.1. Engine
- 5.2.2. Turbine
- 5.2.3. Others
- 5.3. Market Analysis, Insights and Forecast - by Region
- 5.3.1. North America
- 5.3.2. Europe
- 5.3.3. Asia Pacific
- 5.3.4. South America
- 5.3.5. Middle East and Africa
- 5.1. Market Analysis, Insights and Forecast - by Fuel Type
- 6. North America Bioliquid Heat and Power Generation Market Analysis, Insights and Forecast, 2019-2031
- 6.1. Market Analysis, Insights and Forecast - by Fuel Type
- 6.1.1. Bio-ethanol
- 6.1.2. Biodiesel
- 6.1.3. Others
- 6.2. Market Analysis, Insights and Forecast - by Technoligy
- 6.2.1. Engine
- 6.2.2. Turbine
- 6.2.3. Others
- 6.1. Market Analysis, Insights and Forecast - by Fuel Type
- 7. Europe Bioliquid Heat and Power Generation Market Analysis, Insights and Forecast, 2019-2031
- 7.1. Market Analysis, Insights and Forecast - by Fuel Type
- 7.1.1. Bio-ethanol
- 7.1.2. Biodiesel
- 7.1.3. Others
- 7.2. Market Analysis, Insights and Forecast - by Technoligy
- 7.2.1. Engine
- 7.2.2. Turbine
- 7.2.3. Others
- 7.1. Market Analysis, Insights and Forecast - by Fuel Type
- 8. Asia Pacific Bioliquid Heat and Power Generation Market Analysis, Insights and Forecast, 2019-2031
- 8.1. Market Analysis, Insights and Forecast - by Fuel Type
- 8.1.1. Bio-ethanol
- 8.1.2. Biodiesel
- 8.1.3. Others
- 8.2. Market Analysis, Insights and Forecast - by Technoligy
- 8.2.1. Engine
- 8.2.2. Turbine
- 8.2.3. Others
- 8.1. Market Analysis, Insights and Forecast - by Fuel Type
- 9. South America Bioliquid Heat and Power Generation Market Analysis, Insights and Forecast, 2019-2031
- 9.1. Market Analysis, Insights and Forecast - by Fuel Type
- 9.1.1. Bio-ethanol
- 9.1.2. Biodiesel
- 9.1.3. Others
- 9.2. Market Analysis, Insights and Forecast - by Technoligy
- 9.2.1. Engine
- 9.2.2. Turbine
- 9.2.3. Others
- 9.1. Market Analysis, Insights and Forecast - by Fuel Type
- 10. Middle East and Africa Bioliquid Heat and Power Generation Market Analysis, Insights and Forecast, 2019-2031
- 10.1. Market Analysis, Insights and Forecast - by Fuel Type
- 10.1.1. Bio-ethanol
- 10.1.2. Biodiesel
- 10.1.3. Others
- 10.2. Market Analysis, Insights and Forecast - by Technoligy
- 10.2.1. Engine
- 10.2.2. Turbine
- 10.2.3. Others
- 10.1. Market Analysis, Insights and Forecast - by Fuel Type
- 11. North America Bioliquid Heat and Power Generation Market Analysis, Insights and Forecast, 2019-2031
- 11.1. Market Analysis, Insights and Forecast - By Country/Sub-region
- 11.1.1 United States
- 11.1.2 Canada
- 11.1.3 Mexico
- 12. Europe Bioliquid Heat and Power Generation Market Analysis, Insights and Forecast, 2019-2031
- 12.1. Market Analysis, Insights and Forecast - By Country/Sub-region
- 12.1.1 Germany
- 12.1.2 United Kingdom
- 12.1.3 France
- 12.1.4 Spain
- 12.1.5 Italy
- 12.1.6 Spain
- 12.1.7 Belgium
- 12.1.8 Netherland
- 12.1.9 Nordics
- 12.1.10 Rest of Europe
- 13. Asia Pacific Bioliquid Heat and Power Generation Market Analysis, Insights and Forecast, 2019-2031
- 13.1. Market Analysis, Insights and Forecast - By Country/Sub-region
- 13.1.1 China
- 13.1.2 Japan
- 13.1.3 India
- 13.1.4 South Korea
- 13.1.5 Southeast Asia
- 13.1.6 Australia
- 13.1.7 Indonesia
- 13.1.8 Phillipes
- 13.1.9 Singapore
- 13.1.10 Thailandc
- 13.1.11 Rest of Asia Pacific
- 14. South America Bioliquid Heat and Power Generation Market Analysis, Insights and Forecast, 2019-2031
- 14.1. Market Analysis, Insights and Forecast - By Country/Sub-region
- 14.1.1 Brazil
- 14.1.2 Argentina
- 14.1.3 Peru
- 14.1.4 Chile
- 14.1.5 Colombia
- 14.1.6 Ecuador
- 14.1.7 Venezuela
- 14.1.8 Rest of South America
- 15. North America Bioliquid Heat and Power Generation Market Analysis, Insights and Forecast, 2019-2031
- 15.1. Market Analysis, Insights and Forecast - By Country/Sub-region
- 15.1.1 United States
- 15.1.2 Canada
- 15.1.3 Mexico
- 16. MEA Bioliquid Heat and Power Generation Market Analysis, Insights and Forecast, 2019-2031
- 16.1. Market Analysis, Insights and Forecast - By Country/Sub-region
- 16.1.1 United Arab Emirates
- 16.1.2 Saudi Arabia
- 16.1.3 South Africa
- 16.1.4 Rest of Middle East and Africa
- 17. Competitive Analysis
- 17.1. Global Market Share Analysis 2024
- 17.2. Company Profiles
- 17.2.1 Enerkem
- 17.2.1.1. Overview
- 17.2.1.2. Products
- 17.2.1.3. SWOT Analysis
- 17.2.1.4. Recent Developments
- 17.2.1.5. Financials (Based on Availability)
- 17.2.2 Pinnacle Renewable Energy Inc
- 17.2.2.1. Overview
- 17.2.2.2. Products
- 17.2.2.3. SWOT Analysis
- 17.2.2.4. Recent Developments
- 17.2.2.5. Financials (Based on Availability)
- 17.2.3 Strabag SE
- 17.2.3.1. Overview
- 17.2.3.2. Products
- 17.2.3.3. SWOT Analysis
- 17.2.3.4. Recent Developments
- 17.2.3.5. Financials (Based on Availability)
- 17.2.4 Ameresco Inc
- 17.2.4.1. Overview
- 17.2.4.2. Products
- 17.2.4.3. SWOT Analysis
- 17.2.4.4. Recent Developments
- 17.2.4.5. Financials (Based on Availability)
- 17.2.5 Drax Group
- 17.2.5.1. Overview
- 17.2.5.2. Products
- 17.2.5.3. SWOT Analysis
- 17.2.5.4. Recent Developments
- 17.2.5.5. Financials (Based on Availability)
- 17.2.6 Enviva Inc
- 17.2.6.1. Overview
- 17.2.6.2. Products
- 17.2.6.3. SWOT Analysis
- 17.2.6.4. Recent Developments
- 17.2.6.5. Financials (Based on Availability)
- 17.2.7 Green Plains Inc *List Not Exhaustive
- 17.2.7.1. Overview
- 17.2.7.2. Products
- 17.2.7.3. SWOT Analysis
- 17.2.7.4. Recent Developments
- 17.2.7.5. Financials (Based on Availability)
- 17.2.8 Archer-Daniels-Midland Co
- 17.2.8.1. Overview
- 17.2.8.2. Products
- 17.2.8.3. SWOT Analysis
- 17.2.8.4. Recent Developments
- 17.2.8.5. Financials (Based on Availability)
- 17.2.9 Envitec Biogas AG
- 17.2.9.1. Overview
- 17.2.9.2. Products
- 17.2.9.3. SWOT Analysis
- 17.2.9.4. Recent Developments
- 17.2.9.5. Financials (Based on Availability)
- 17.2.10 Albioma SA
- 17.2.10.1. Overview
- 17.2.10.2. Products
- 17.2.10.3. SWOT Analysis
- 17.2.10.4. Recent Developments
- 17.2.10.5. Financials (Based on Availability)
- 17.2.1 Enerkem
List of Figures
- Figure 1: Global Bioliquid Heat and Power Generation Market Revenue Breakdown (Million, %) by Region 2024 & 2032
- Figure 2: North America Bioliquid Heat and Power Generation Market Revenue (Million), by Country 2024 & 2032
- Figure 3: North America Bioliquid Heat and Power Generation Market Revenue Share (%), by Country 2024 & 2032
- Figure 4: Europe Bioliquid Heat and Power Generation Market Revenue (Million), by Country 2024 & 2032
- Figure 5: Europe Bioliquid Heat and Power Generation Market Revenue Share (%), by Country 2024 & 2032
- Figure 6: Asia Pacific Bioliquid Heat and Power Generation Market Revenue (Million), by Country 2024 & 2032
- Figure 7: Asia Pacific Bioliquid Heat and Power Generation Market Revenue Share (%), by Country 2024 & 2032
- Figure 8: South America Bioliquid Heat and Power Generation Market Revenue (Million), by Country 2024 & 2032
- Figure 9: South America Bioliquid Heat and Power Generation Market Revenue Share (%), by Country 2024 & 2032
- Figure 10: North America Bioliquid Heat and Power Generation Market Revenue (Million), by Country 2024 & 2032
- Figure 11: North America Bioliquid Heat and Power Generation Market Revenue Share (%), by Country 2024 & 2032
- Figure 12: MEA Bioliquid Heat and Power Generation Market Revenue (Million), by Country 2024 & 2032
- Figure 13: MEA Bioliquid Heat and Power Generation Market Revenue Share (%), by Country 2024 & 2032
- Figure 14: North America Bioliquid Heat and Power Generation Market Revenue (Million), by Fuel Type 2024 & 2032
- Figure 15: North America Bioliquid Heat and Power Generation Market Revenue Share (%), by Fuel Type 2024 & 2032
- Figure 16: North America Bioliquid Heat and Power Generation Market Revenue (Million), by Technoligy 2024 & 2032
- Figure 17: North America Bioliquid Heat and Power Generation Market Revenue Share (%), by Technoligy 2024 & 2032
- Figure 18: North America Bioliquid Heat and Power Generation Market Revenue (Million), by Country 2024 & 2032
- Figure 19: North America Bioliquid Heat and Power Generation Market Revenue Share (%), by Country 2024 & 2032
- Figure 20: Europe Bioliquid Heat and Power Generation Market Revenue (Million), by Fuel Type 2024 & 2032
- Figure 21: Europe Bioliquid Heat and Power Generation Market Revenue Share (%), by Fuel Type 2024 & 2032
- Figure 22: Europe Bioliquid Heat and Power Generation Market Revenue (Million), by Technoligy 2024 & 2032
- Figure 23: Europe Bioliquid Heat and Power Generation Market Revenue Share (%), by Technoligy 2024 & 2032
- Figure 24: Europe Bioliquid Heat and Power Generation Market Revenue (Million), by Country 2024 & 2032
- Figure 25: Europe Bioliquid Heat and Power Generation Market Revenue Share (%), by Country 2024 & 2032
- Figure 26: Asia Pacific Bioliquid Heat and Power Generation Market Revenue (Million), by Fuel Type 2024 & 2032
- Figure 27: Asia Pacific Bioliquid Heat and Power Generation Market Revenue Share (%), by Fuel Type 2024 & 2032
- Figure 28: Asia Pacific Bioliquid Heat and Power Generation Market Revenue (Million), by Technoligy 2024 & 2032
- Figure 29: Asia Pacific Bioliquid Heat and Power Generation Market Revenue Share (%), by Technoligy 2024 & 2032
- Figure 30: Asia Pacific Bioliquid Heat and Power Generation Market Revenue (Million), by Country 2024 & 2032
- Figure 31: Asia Pacific Bioliquid Heat and Power Generation Market Revenue Share (%), by Country 2024 & 2032
- Figure 32: South America Bioliquid Heat and Power Generation Market Revenue (Million), by Fuel Type 2024 & 2032
- Figure 33: South America Bioliquid Heat and Power Generation Market Revenue Share (%), by Fuel Type 2024 & 2032
- Figure 34: South America Bioliquid Heat and Power Generation Market Revenue (Million), by Technoligy 2024 & 2032
- Figure 35: South America Bioliquid Heat and Power Generation Market Revenue Share (%), by Technoligy 2024 & 2032
- Figure 36: South America Bioliquid Heat and Power Generation Market Revenue (Million), by Country 2024 & 2032
- Figure 37: South America Bioliquid Heat and Power Generation Market Revenue Share (%), by Country 2024 & 2032
- Figure 38: Middle East and Africa Bioliquid Heat and Power Generation Market Revenue (Million), by Fuel Type 2024 & 2032
- Figure 39: Middle East and Africa Bioliquid Heat and Power Generation Market Revenue Share (%), by Fuel Type 2024 & 2032
- Figure 40: Middle East and Africa Bioliquid Heat and Power Generation Market Revenue (Million), by Technoligy 2024 & 2032
- Figure 41: Middle East and Africa Bioliquid Heat and Power Generation Market Revenue Share (%), by Technoligy 2024 & 2032
- Figure 42: Middle East and Africa Bioliquid Heat and Power Generation Market Revenue (Million), by Country 2024 & 2032
- Figure 43: Middle East and Africa Bioliquid Heat and Power Generation Market Revenue Share (%), by Country 2024 & 2032
List of Tables
- Table 1: Global Bioliquid Heat and Power Generation Market Revenue Million Forecast, by Region 2019 & 2032
- Table 2: Global Bioliquid Heat and Power Generation Market Revenue Million Forecast, by Fuel Type 2019 & 2032
- Table 3: Global Bioliquid Heat and Power Generation Market Revenue Million Forecast, by Technoligy 2019 & 2032
- Table 4: Global Bioliquid Heat and Power Generation Market Revenue Million Forecast, by Region 2019 & 2032
- Table 5: Global Bioliquid Heat and Power Generation Market Revenue Million Forecast, by Country 2019 & 2032
- Table 6: United States Bioliquid Heat and Power Generation Market Revenue (Million) Forecast, by Application 2019 & 2032
- Table 7: Canada Bioliquid Heat and Power Generation Market Revenue (Million) Forecast, by Application 2019 & 2032
- Table 8: Mexico Bioliquid Heat and Power Generation Market Revenue (Million) Forecast, by Application 2019 & 2032
- Table 9: Global Bioliquid Heat and Power Generation Market Revenue Million Forecast, by Country 2019 & 2032
- Table 10: Germany Bioliquid Heat and Power Generation Market Revenue (Million) Forecast, by Application 2019 & 2032
- Table 11: United Kingdom Bioliquid Heat and Power Generation Market Revenue (Million) Forecast, by Application 2019 & 2032
- Table 12: France Bioliquid Heat and Power Generation Market Revenue (Million) Forecast, by Application 2019 & 2032
- Table 13: Spain Bioliquid Heat and Power Generation Market Revenue (Million) Forecast, by Application 2019 & 2032
- Table 14: Italy Bioliquid Heat and Power Generation Market Revenue (Million) Forecast, by Application 2019 & 2032
- Table 15: Spain Bioliquid Heat and Power Generation Market Revenue (Million) Forecast, by Application 2019 & 2032
- Table 16: Belgium Bioliquid Heat and Power Generation Market Revenue (Million) Forecast, by Application 2019 & 2032
- Table 17: Netherland Bioliquid Heat and Power Generation Market Revenue (Million) Forecast, by Application 2019 & 2032
- Table 18: Nordics Bioliquid Heat and Power Generation Market Revenue (Million) Forecast, by Application 2019 & 2032
- Table 19: Rest of Europe Bioliquid Heat and Power Generation Market Revenue (Million) Forecast, by Application 2019 & 2032
- Table 20: Global Bioliquid Heat and Power Generation Market Revenue Million Forecast, by Country 2019 & 2032
- Table 21: China Bioliquid Heat and Power Generation Market Revenue (Million) Forecast, by Application 2019 & 2032
- Table 22: Japan Bioliquid Heat and Power Generation Market Revenue (Million) Forecast, by Application 2019 & 2032
- Table 23: India Bioliquid Heat and Power Generation Market Revenue (Million) Forecast, by Application 2019 & 2032
- Table 24: South Korea Bioliquid Heat and Power Generation Market Revenue (Million) Forecast, by Application 2019 & 2032
- Table 25: Southeast Asia Bioliquid Heat and Power Generation Market Revenue (Million) Forecast, by Application 2019 & 2032
- Table 26: Australia Bioliquid Heat and Power Generation Market Revenue (Million) Forecast, by Application 2019 & 2032
- Table 27: Indonesia Bioliquid Heat and Power Generation Market Revenue (Million) Forecast, by Application 2019 & 2032
- Table 28: Phillipes Bioliquid Heat and Power Generation Market Revenue (Million) Forecast, by Application 2019 & 2032
- Table 29: Singapore Bioliquid Heat and Power Generation Market Revenue (Million) Forecast, by Application 2019 & 2032
- Table 30: Thailandc Bioliquid Heat and Power Generation Market Revenue (Million) Forecast, by Application 2019 & 2032
- Table 31: Rest of Asia Pacific Bioliquid Heat and Power Generation Market Revenue (Million) Forecast, by Application 2019 & 2032
- Table 32: Global Bioliquid Heat and Power Generation Market Revenue Million Forecast, by Country 2019 & 2032
- Table 33: Brazil Bioliquid Heat and Power Generation Market Revenue (Million) Forecast, by Application 2019 & 2032
- Table 34: Argentina Bioliquid Heat and Power Generation Market Revenue (Million) Forecast, by Application 2019 & 2032
- Table 35: Peru Bioliquid Heat and Power Generation Market Revenue (Million) Forecast, by Application 2019 & 2032
- Table 36: Chile Bioliquid Heat and Power Generation Market Revenue (Million) Forecast, by Application 2019 & 2032
- Table 37: Colombia Bioliquid Heat and Power Generation Market Revenue (Million) Forecast, by Application 2019 & 2032
- Table 38: Ecuador Bioliquid Heat and Power Generation Market Revenue (Million) Forecast, by Application 2019 & 2032
- Table 39: Venezuela Bioliquid Heat and Power Generation Market Revenue (Million) Forecast, by Application 2019 & 2032
- Table 40: Rest of South America Bioliquid Heat and Power Generation Market Revenue (Million) Forecast, by Application 2019 & 2032
- Table 41: Global Bioliquid Heat and Power Generation Market Revenue Million Forecast, by Country 2019 & 2032
- Table 42: United States Bioliquid Heat and Power Generation Market Revenue (Million) Forecast, by Application 2019 & 2032
- Table 43: Canada Bioliquid Heat and Power Generation Market Revenue (Million) Forecast, by Application 2019 & 2032
- Table 44: Mexico Bioliquid Heat and Power Generation Market Revenue (Million) Forecast, by Application 2019 & 2032
- Table 45: Global Bioliquid Heat and Power Generation Market Revenue Million Forecast, by Country 2019 & 2032
- Table 46: United Arab Emirates Bioliquid Heat and Power Generation Market Revenue (Million) Forecast, by Application 2019 & 2032
- Table 47: Saudi Arabia Bioliquid Heat and Power Generation Market Revenue (Million) Forecast, by Application 2019 & 2032
- Table 48: South Africa Bioliquid Heat and Power Generation Market Revenue (Million) Forecast, by Application 2019 & 2032
- Table 49: Rest of Middle East and Africa Bioliquid Heat and Power Generation Market Revenue (Million) Forecast, by Application 2019 & 2032
- Table 50: Global Bioliquid Heat and Power Generation Market Revenue Million Forecast, by Fuel Type 2019 & 2032
- Table 51: Global Bioliquid Heat and Power Generation Market Revenue Million Forecast, by Technoligy 2019 & 2032
- Table 52: Global Bioliquid Heat and Power Generation Market Revenue Million Forecast, by Country 2019 & 2032
- Table 53: Global Bioliquid Heat and Power Generation Market Revenue Million Forecast, by Fuel Type 2019 & 2032
- Table 54: Global Bioliquid Heat and Power Generation Market Revenue Million Forecast, by Technoligy 2019 & 2032
- Table 55: Global Bioliquid Heat and Power Generation Market Revenue Million Forecast, by Country 2019 & 2032
- Table 56: Global Bioliquid Heat and Power Generation Market Revenue Million Forecast, by Fuel Type 2019 & 2032
- Table 57: Global Bioliquid Heat and Power Generation Market Revenue Million Forecast, by Technoligy 2019 & 2032
- Table 58: Global Bioliquid Heat and Power Generation Market Revenue Million Forecast, by Country 2019 & 2032
- Table 59: Global Bioliquid Heat and Power Generation Market Revenue Million Forecast, by Fuel Type 2019 & 2032
- Table 60: Global Bioliquid Heat and Power Generation Market Revenue Million Forecast, by Technoligy 2019 & 2032
- Table 61: Global Bioliquid Heat and Power Generation Market Revenue Million Forecast, by Country 2019 & 2032
- Table 62: Global Bioliquid Heat and Power Generation Market Revenue Million Forecast, by Fuel Type 2019 & 2032
- Table 63: Global Bioliquid Heat and Power Generation Market Revenue Million Forecast, by Technoligy 2019 & 2032
- Table 64: Global Bioliquid Heat and Power Generation Market Revenue Million Forecast, by Country 2019 & 2032
Frequently Asked Questions
1. What is the projected Compound Annual Growth Rate (CAGR) of the Bioliquid Heat and Power Generation Market?
The projected CAGR is approximately > 7.10%.
2. Which companies are prominent players in the Bioliquid Heat and Power Generation Market?
Key companies in the market include Enerkem, Pinnacle Renewable Energy Inc, Strabag SE, Ameresco Inc, Drax Group, Enviva Inc, Green Plains Inc *List Not Exhaustive, Archer-Daniels-Midland Co, Envitec Biogas AG, Albioma SA.
3. What are the main segments of the Bioliquid Heat and Power Generation Market?
The market segments include Fuel Type, Technoligy.
4. Can you provide details about the market size?
The market size is estimated to be USD XX Million as of 2022.
5. What are some drivers contributing to market growth?
4.; Improved Viability Of Offshore Oil And Gas Projects.
6. What are the notable trends driving market growth?
Bioethanol Segment is to Dominate the Market.
7. Are there any restraints impacting market growth?
4.; Ban On Offshore Exploration And Production Activities In Multiple Regions.
8. Can you provide examples of recent developments in the market?
In 2020, the United States government decided to renew the provision of tax credit for the production of biodiesel and renewable diesel production. In order to increase the production levels of the fuels for the application in various sectors, the biodiesel tax credit (BTC) is expected to continue through 2022 also.
9. What pricing options are available for accessing the report?
Pricing options include single-user, multi-user, and enterprise licenses priced at USD 4750, USD 5250, and USD 8750 respectively.
10. Is the market size provided in terms of value or volume?
The market size is provided in terms of value, measured in Million.
11. Are there any specific market keywords associated with the report?
Yes, the market keyword associated with the report is "Bioliquid Heat and Power Generation Market," which aids in identifying and referencing the specific market segment covered.
12. How do I determine which pricing option suits my needs best?
The pricing options vary based on user requirements and access needs. Individual users may opt for single-user licenses, while businesses requiring broader access may choose multi-user or enterprise licenses for cost-effective access to the report.
13. Are there any additional resources or data provided in the Bioliquid Heat and Power Generation Market report?
While the report offers comprehensive insights, it's advisable to review the specific contents or supplementary materials provided to ascertain if additional resources or data are available.
14. How can I stay updated on further developments or reports in the Bioliquid Heat and Power Generation Market?
To stay informed about further developments, trends, and reports in the Bioliquid Heat and Power Generation Market, consider subscribing to industry newsletters, following relevant companies and organizations, or regularly checking reputable industry news sources and publications.
Methodology
Step 1 - Identification of Relevant Samples Size from Population Database


Step 2 - Approaches for Defining Global Market Size (Value, Volume* & Price*)

Note*: In applicable scenarios
Step 3 - Data Sources
Primary Research
- Web Analytics
- Survey Reports
- Research Institute
- Latest Research Reports
- Opinion Leaders
Secondary Research
- Annual Reports
- White Paper
- Latest Press Release
- Industry Association
- Paid Database
- Investor Presentations

Step 4 - Data Triangulation
Involves using different sources of information in order to increase the validity of a study
These sources are likely to be stakeholders in a program - participants, other researchers, program staff, other community members, and so on.
Then we put all data in single framework & apply various statistical tools to find out the dynamic on the market.
During the analysis stage, feedback from the stakeholder groups would be compared to determine areas of agreement as well as areas of divergence


