
Key Insights
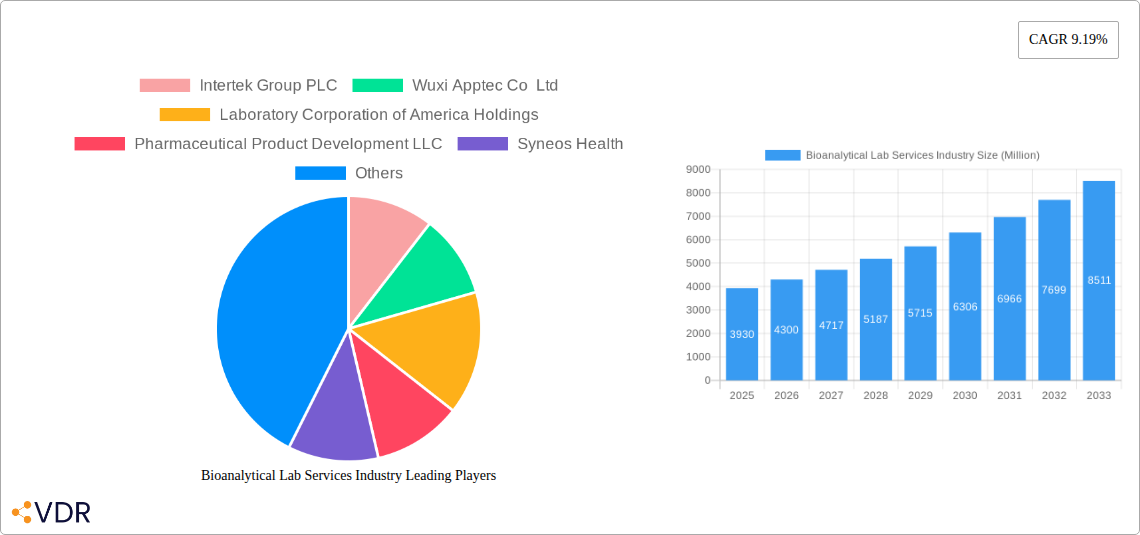
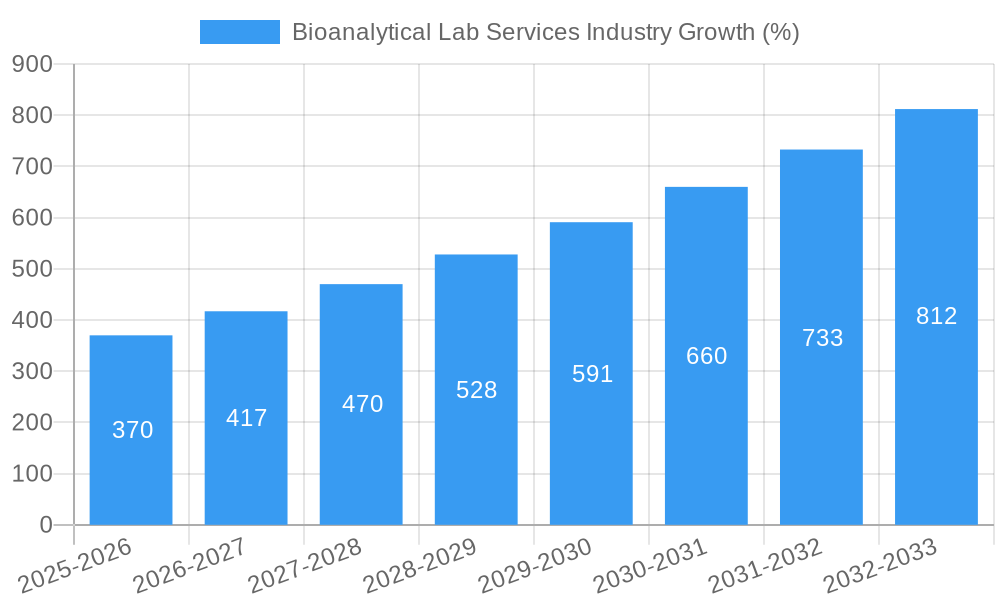
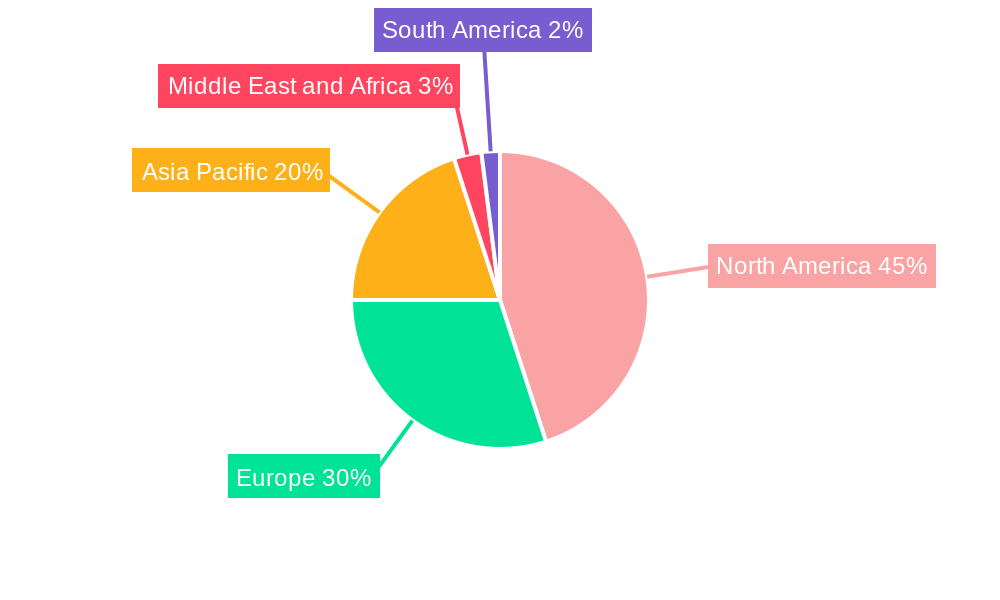
The bioanalytical lab services market, valued at $3.93 billion in 2025, is projected to experience robust growth, driven by the increasing demand for drug development and approval processes. A Compound Annual Growth Rate (CAGR) of 9.19% from 2025 to 2033 indicates a significant expansion, reaching an estimated $8.5 billion by 2033. This growth is fueled by several factors. The rising prevalence of chronic diseases necessitates the development of novel therapeutics, increasing the need for bioanalytical testing. Advancements in technology, such as mass spectrometry and liquid chromatography, are enhancing the speed, accuracy, and efficiency of these services. Furthermore, the increasing outsourcing of bioanalytical testing by pharmaceutical and biotechnology companies to specialized labs contributes to market expansion. The market is segmented by molecule type (small and large molecules) and test type (bioavailability and bioequivalence studies, pharmacokinetics, pharmacodynamics, and others), reflecting the diverse analytical needs within drug development. North America currently holds a significant market share, owing to its well-established pharmaceutical industry and regulatory frameworks. However, the Asia-Pacific region is expected to witness rapid growth due to increasing healthcare spending and a burgeoning pharmaceutical sector.
Competitive intensity within the bioanalytical lab services market is high, with established players like Intertek, Wuxi Apptec, and Charles River Laboratories vying for market share alongside smaller specialized firms. The market faces challenges such as stringent regulatory requirements and the need for continuous technological upgrades to maintain competitiveness. Nevertheless, the overall outlook remains positive, driven by persistent demand for efficient and reliable bioanalytical services across the pharmaceutical value chain. The continuous influx of new drugs and the growing emphasis on personalized medicine will further propel market growth in the coming years, making it an attractive investment opportunity for stakeholders in the healthcare industry.
Bioanalytical Lab Services Industry Market Report: 2019-2033
This comprehensive report provides an in-depth analysis of the Bioanalytical Lab Services industry, encompassing market dynamics, growth trends, regional performance, key players, and future outlook. The study period covers 2019-2033, with 2025 as the base and estimated year. The report segments the market by molecule type (small molecules, large molecules) and test type (bioavailability and bioequivalence studies, pharmacokinetics, pharmacodynamics, other test types), offering a granular understanding of this crucial sector within the broader pharmaceutical and biotechnology industries. The total market value in 2025 is estimated at xx Million.
Bioanalytical Lab Services Industry Market Dynamics & Structure
The bioanalytical lab services market is characterized by moderate concentration, with several large players commanding significant market share. Market leader Intertek Group PLC holds an estimated xx% market share in 2025, followed by Wuxi Apptec Co Ltd with xx%. However, the market also features numerous smaller specialized labs, creating a dynamic competitive landscape. Technological innovation, particularly in areas like mass spectrometry and chromatography, is a key driver, while regulatory compliance (e.g., FDA guidelines) heavily influences operational procedures and investment decisions. The industry faces competitive pressures from substitute technologies and the increasing adoption of in-house testing capabilities by larger pharmaceutical companies. M&A activity has been moderate, with xx deals recorded between 2019-2024, mostly focused on expanding service offerings and geographical reach. End-user demographics are primarily pharmaceutical and biotechnology companies, with increasing contributions from Contract Research Organizations (CROs).
- Market Concentration: Moderately concentrated, with top 5 players holding xx% of the market share in 2025.
- Technological Innovation: Driven by advancements in mass spectrometry, liquid chromatography, and automation.
- Regulatory Framework: Stringent regulatory compliance (FDA, EMA) significantly impacts operational costs and strategies.
- Competitive Substitutes: In-house testing capabilities, alternative analytical methods pose competitive threats.
- M&A Trends: Moderate activity, primarily focused on geographic expansion and service diversification (xx deals between 2019-2024).
- End-User Demographics: Primarily pharmaceutical and biotechnology companies, CROs.
Bioanalytical Lab Services Industry Growth Trends & Insights
The bioanalytical lab services market experienced steady growth between 2019 and 2024, with a CAGR of xx%. This growth is attributed to the rising demand for biopharmaceuticals, increasing clinical trials, and the outsourcing trend within the pharmaceutical industry. Technological advancements, such as automation and high-throughput screening, have further enhanced efficiency and reduced costs, driving market expansion. The adoption rate of advanced bioanalytical techniques is increasing steadily, with a projected penetration rate of xx% by 2033. Consumer behavior shifts toward personalized medicine and targeted therapies are also influencing market growth, necessitating more sophisticated bioanalytical testing capabilities. The market is projected to grow at a CAGR of xx% during the forecast period (2025-2033), reaching an estimated value of xx Million by 2033.
Dominant Regions, Countries, or Segments in Bioanalytical Lab Services Industry
North America currently dominates the bioanalytical lab services market, holding the largest market share in 2025 at approximately xx%, driven by the strong presence of major pharmaceutical companies and advanced research infrastructure. Europe follows with a market share of xx%, while Asia-Pacific is witnessing significant growth potential due to expanding pharmaceutical industries and increasing investments in healthcare infrastructure. Within segments, the Small Molecules segment holds a larger market share compared to Large Molecules, primarily because of the greater volume of small molecule drugs in development and on the market. Similarly, Pharmacokinetics testing constitutes a larger portion of the overall test types, followed by Bioavailability and Bioequivalence Studies.
- North America: Strong presence of pharmaceutical companies, advanced research infrastructure, and high adoption rate of advanced technologies.
- Europe: Well-established regulatory frameworks and a strong presence of CROs.
- Asia-Pacific: Rapid growth potential driven by expanding pharmaceutical industries and increased healthcare investments.
- Small Molecules Segment: Larger market share due to higher volume of small molecule drug development.
- Pharmacokinetics Testing: Highest demand among test types due to its critical role in drug development.
Bioanalytical Lab Services Industry Product Landscape
The bioanalytical lab services product landscape is characterized by a wide range of analytical techniques, including mass spectrometry, liquid chromatography, and immunoassays. Continuous innovations focus on improving accuracy, sensitivity, and throughput. Unique selling propositions include faster turnaround times, customized service offerings, and expertise in specialized testing areas. Technological advancements, like automated sample preparation and data analysis software, enhance efficiency and reduce operational costs. The increasing demand for high-throughput screening and sophisticated data analysis is driving further product innovation.
Key Drivers, Barriers & Challenges in Bioanalytical Lab Services Industry
Key Drivers: The rising demand for biopharmaceuticals, increased clinical trials, outsourcing trends in the pharmaceutical industry, technological advancements (automation, high-throughput screening), and the shift towards personalized medicine are key drivers.
Challenges: Stringent regulatory requirements create significant hurdles. Competition from in-house testing capabilities and the price pressure from budget-conscious clients create challenges. Supply chain disruptions can impact testing availability, while retaining skilled personnel poses ongoing challenges. The estimated impact of regulatory hurdles on market growth is approximately xx% between 2025-2033.
Emerging Opportunities in Bioanalytical Lab Services Industry
Untapped markets in emerging economies, growing demand for personalized medicine testing, expansion into novel therapeutic areas (e.g., gene therapy, cell therapy), and the development of novel bioanalytical techniques (e.g., advanced imaging techniques) present significant opportunities for growth. The increasing adoption of AI and machine learning in data analysis also opens up new avenues for innovation.
Growth Accelerators in the Bioanalytical Lab Services Industry
Technological breakthroughs in mass spectrometry and automation are key growth accelerators, along with strategic partnerships between bioanalytical labs and pharmaceutical companies. Expansion into emerging markets and the development of specialized services cater to specific therapeutic areas, fostering long-term growth.
Key Players Shaping the Bioanalytical Lab Services Industry Market
- Intertek Group PLC
- Wuxi Apptec Co Ltd
- Laboratory Corporation of America Holdings
- Pharmaceutical Product Development LLC
- Syneos Health
- ICON PLC
- Charles River Laboratories International Inc
- SGS SA
- Toxikon Corporation
Notable Milestones in Bioanalytical Lab Services Industry Sector
- 2021: Increased FDA emphasis on data integrity leads to widespread adoption of enhanced quality control measures within the industry.
- 2022: Several key players launch advanced mass spectrometry platforms, boosting throughput and sensitivity.
- 2023: A major merger between two mid-sized bioanalytical labs expands service offerings and geographic reach. (Specifics not available, placeholder)
In-Depth Bioanalytical Lab Services Industry Market Outlook
The bioanalytical lab services market is poised for sustained growth driven by technological innovation, increasing demand from the biopharmaceutical industry, and expansion into emerging markets. Strategic partnerships and investments in advanced technologies will be crucial for companies to maintain a competitive edge. The long-term outlook is positive, with significant potential for growth in specialized testing areas and the integration of AI/ML in data analysis. The market is expected to reach xx Million by 2033, presenting substantial opportunities for industry players.
Bioanalytical Lab Services Industry Segmentation
-
1. Molecule Type
- 1.1. Small Molecules
- 1.2. Large Molecules
-
2. Test Type
- 2.1. Bioavailability and Bioequivalence Studies
- 2.2. Pharmacokinetics
- 2.3. Pharmacodynamics
- 2.4. Other Test Types
Bioanalytical Lab Services Industry Segmentation By Geography
-
1. North America
- 1.1. US
- 1.2. Canada
- 1.3. Mexico
-
2. Europe
- 2.1. Germany
- 2.2. UK
- 2.3. France
- 2.4. Italy
- 2.5. Spain
- 2.6. Rest of Europe
-
3. Asia Pacific
- 3.1. China
- 3.2. Japan
- 3.3. India
- 3.4. Australia
- 3.5. South Korea
- 3.6. Rest of Asia Pacific
-
4. Middle East and Africa
- 4.1. GCC
- 4.2. South Africa
- 4.3. Rest of Middle East and Africa
-
5. South America
- 5.1. Brazil
- 5.2. Argentina
- 5.3. Rest of South America
Bioanalytical Lab Services Industry REPORT HIGHLIGHTS
| Aspects | Details |
|---|---|
| Study Period | 2019-2033 |
| Base Year | 2024 |
| Estimated Year | 2025 |
| Forecast Period | 2025-2033 |
| Historical Period | 2019-2024 |
| Growth Rate | CAGR of 9.19% from 2019-2033 |
| Segmentation |
|
Table of Contents
- 1. Introduction
- 1.1. Research Scope
- 1.2. Market Segmentation
- 1.3. Research Methodology
- 1.4. Definitions and Assumptions
- 2. Executive Summary
- 2.1. Introduction
- 3. Market Dynamics
- 3.1. Introduction
- 3.2. Market Drivers
- 3.2.1. Increased Necessity of Specific Types of Tests in R&D Activities; Increased Trend of Outsourcing Laboratory Testing Services
- 3.3. Market Restrains
- 3.3.1. Complex Regulatory Framework for Maintaining Laboratories; Challenges in the Development of Proper Analytical Techniques
- 3.4. Market Trends
- 3.4.1. Small Molecule Sub-segment Expected to Show Better Growth in the Bioanalytical Testing Services Market
- 4. Market Factor Analysis
- 4.1. Porters Five Forces
- 4.2. Supply/Value Chain
- 4.3. PESTEL analysis
- 4.4. Market Entropy
- 4.5. Patent/Trademark Analysis
- 5. Global Bioanalytical Lab Services Industry Analysis, Insights and Forecast, 2019-2031
- 5.1. Market Analysis, Insights and Forecast - by Molecule Type
- 5.1.1. Small Molecules
- 5.1.2. Large Molecules
- 5.2. Market Analysis, Insights and Forecast - by Test Type
- 5.2.1. Bioavailability and Bioequivalence Studies
- 5.2.2. Pharmacokinetics
- 5.2.3. Pharmacodynamics
- 5.2.4. Other Test Types
- 5.3. Market Analysis, Insights and Forecast - by Region
- 5.3.1. North America
- 5.3.2. Europe
- 5.3.3. Asia Pacific
- 5.3.4. Middle East and Africa
- 5.3.5. South America
- 5.1. Market Analysis, Insights and Forecast - by Molecule Type
- 6. North America Bioanalytical Lab Services Industry Analysis, Insights and Forecast, 2019-2031
- 6.1. Market Analysis, Insights and Forecast - by Molecule Type
- 6.1.1. Small Molecules
- 6.1.2. Large Molecules
- 6.2. Market Analysis, Insights and Forecast - by Test Type
- 6.2.1. Bioavailability and Bioequivalence Studies
- 6.2.2. Pharmacokinetics
- 6.2.3. Pharmacodynamics
- 6.2.4. Other Test Types
- 6.1. Market Analysis, Insights and Forecast - by Molecule Type
- 7. Europe Bioanalytical Lab Services Industry Analysis, Insights and Forecast, 2019-2031
- 7.1. Market Analysis, Insights and Forecast - by Molecule Type
- 7.1.1. Small Molecules
- 7.1.2. Large Molecules
- 7.2. Market Analysis, Insights and Forecast - by Test Type
- 7.2.1. Bioavailability and Bioequivalence Studies
- 7.2.2. Pharmacokinetics
- 7.2.3. Pharmacodynamics
- 7.2.4. Other Test Types
- 7.1. Market Analysis, Insights and Forecast - by Molecule Type
- 8. Asia Pacific Bioanalytical Lab Services Industry Analysis, Insights and Forecast, 2019-2031
- 8.1. Market Analysis, Insights and Forecast - by Molecule Type
- 8.1.1. Small Molecules
- 8.1.2. Large Molecules
- 8.2. Market Analysis, Insights and Forecast - by Test Type
- 8.2.1. Bioavailability and Bioequivalence Studies
- 8.2.2. Pharmacokinetics
- 8.2.3. Pharmacodynamics
- 8.2.4. Other Test Types
- 8.1. Market Analysis, Insights and Forecast - by Molecule Type
- 9. Middle East and Africa Bioanalytical Lab Services Industry Analysis, Insights and Forecast, 2019-2031
- 9.1. Market Analysis, Insights and Forecast - by Molecule Type
- 9.1.1. Small Molecules
- 9.1.2. Large Molecules
- 9.2. Market Analysis, Insights and Forecast - by Test Type
- 9.2.1. Bioavailability and Bioequivalence Studies
- 9.2.2. Pharmacokinetics
- 9.2.3. Pharmacodynamics
- 9.2.4. Other Test Types
- 9.1. Market Analysis, Insights and Forecast - by Molecule Type
- 10. South America Bioanalytical Lab Services Industry Analysis, Insights and Forecast, 2019-2031
- 10.1. Market Analysis, Insights and Forecast - by Molecule Type
- 10.1.1. Small Molecules
- 10.1.2. Large Molecules
- 10.2. Market Analysis, Insights and Forecast - by Test Type
- 10.2.1. Bioavailability and Bioequivalence Studies
- 10.2.2. Pharmacokinetics
- 10.2.3. Pharmacodynamics
- 10.2.4. Other Test Types
- 10.1. Market Analysis, Insights and Forecast - by Molecule Type
- 11. North America Bioanalytical Lab Services Industry Analysis, Insights and Forecast, 2019-2031
- 11.1. Market Analysis, Insights and Forecast - By Country/Sub-region
- 11.1.1 US
- 11.1.2 Canada
- 11.1.3 Mexico
- 12. Europe Bioanalytical Lab Services Industry Analysis, Insights and Forecast, 2019-2031
- 12.1. Market Analysis, Insights and Forecast - By Country/Sub-region
- 12.1.1 Germany
- 12.1.2 UK
- 12.1.3 France
- 12.1.4 Italy
- 12.1.5 Spain
- 12.1.6 Rest of Europe
- 13. Asia Pacific Bioanalytical Lab Services Industry Analysis, Insights and Forecast, 2019-2031
- 13.1. Market Analysis, Insights and Forecast - By Country/Sub-region
- 13.1.1 China
- 13.1.2 Japan
- 13.1.3 India
- 13.1.4 Australia
- 13.1.5 South Korea
- 13.1.6 Rest of Asia Pacific
- 14. Middle East and Africa Bioanalytical Lab Services Industry Analysis, Insights and Forecast, 2019-2031
- 14.1. Market Analysis, Insights and Forecast - By Country/Sub-region
- 14.1.1 GCC
- 14.1.2 South Africa
- 14.1.3 Rest of Middle East and Africa
- 15. South America Bioanalytical Lab Services Industry Analysis, Insights and Forecast, 2019-2031
- 15.1. Market Analysis, Insights and Forecast - By Country/Sub-region
- 15.1.1 Brazil
- 15.1.2 Argentina
- 15.1.3 Rest of South America
- 16. Competitive Analysis
- 16.1. Global Market Share Analysis 2024
- 16.2. Company Profiles
- 16.2.1 Intertek Group PLC
- 16.2.1.1. Overview
- 16.2.1.2. Products
- 16.2.1.3. SWOT Analysis
- 16.2.1.4. Recent Developments
- 16.2.1.5. Financials (Based on Availability)
- 16.2.2 Wuxi Apptec Co Ltd
- 16.2.2.1. Overview
- 16.2.2.2. Products
- 16.2.2.3. SWOT Analysis
- 16.2.2.4. Recent Developments
- 16.2.2.5. Financials (Based on Availability)
- 16.2.3 Laboratory Corporation of America Holdings
- 16.2.3.1. Overview
- 16.2.3.2. Products
- 16.2.3.3. SWOT Analysis
- 16.2.3.4. Recent Developments
- 16.2.3.5. Financials (Based on Availability)
- 16.2.4 Pharmaceutical Product Development LLC
- 16.2.4.1. Overview
- 16.2.4.2. Products
- 16.2.4.3. SWOT Analysis
- 16.2.4.4. Recent Developments
- 16.2.4.5. Financials (Based on Availability)
- 16.2.5 Syneos Health
- 16.2.5.1. Overview
- 16.2.5.2. Products
- 16.2.5.3. SWOT Analysis
- 16.2.5.4. Recent Developments
- 16.2.5.5. Financials (Based on Availability)
- 16.2.6 ICON PLC
- 16.2.6.1. Overview
- 16.2.6.2. Products
- 16.2.6.3. SWOT Analysis
- 16.2.6.4. Recent Developments
- 16.2.6.5. Financials (Based on Availability)
- 16.2.7 Charles River Laboratories International Inc
- 16.2.7.1. Overview
- 16.2.7.2. Products
- 16.2.7.3. SWOT Analysis
- 16.2.7.4. Recent Developments
- 16.2.7.5. Financials (Based on Availability)
- 16.2.8 SGS SA
- 16.2.8.1. Overview
- 16.2.8.2. Products
- 16.2.8.3. SWOT Analysis
- 16.2.8.4. Recent Developments
- 16.2.8.5. Financials (Based on Availability)
- 16.2.9 Toxikon Corporation
- 16.2.9.1. Overview
- 16.2.9.2. Products
- 16.2.9.3. SWOT Analysis
- 16.2.9.4. Recent Developments
- 16.2.9.5. Financials (Based on Availability)
- 16.2.1 Intertek Group PLC
List of Figures
- Figure 1: Global Bioanalytical Lab Services Industry Revenue Breakdown (Million, %) by Region 2024 & 2032
- Figure 2: Global Bioanalytical Lab Services Industry Volume Breakdown (K Unit, %) by Region 2024 & 2032
- Figure 3: North America Bioanalytical Lab Services Industry Revenue (Million), by Country 2024 & 2032
- Figure 4: North America Bioanalytical Lab Services Industry Volume (K Unit), by Country 2024 & 2032
- Figure 5: North America Bioanalytical Lab Services Industry Revenue Share (%), by Country 2024 & 2032
- Figure 6: North America Bioanalytical Lab Services Industry Volume Share (%), by Country 2024 & 2032
- Figure 7: Europe Bioanalytical Lab Services Industry Revenue (Million), by Country 2024 & 2032
- Figure 8: Europe Bioanalytical Lab Services Industry Volume (K Unit), by Country 2024 & 2032
- Figure 9: Europe Bioanalytical Lab Services Industry Revenue Share (%), by Country 2024 & 2032
- Figure 10: Europe Bioanalytical Lab Services Industry Volume Share (%), by Country 2024 & 2032
- Figure 11: Asia Pacific Bioanalytical Lab Services Industry Revenue (Million), by Country 2024 & 2032
- Figure 12: Asia Pacific Bioanalytical Lab Services Industry Volume (K Unit), by Country 2024 & 2032
- Figure 13: Asia Pacific Bioanalytical Lab Services Industry Revenue Share (%), by Country 2024 & 2032
- Figure 14: Asia Pacific Bioanalytical Lab Services Industry Volume Share (%), by Country 2024 & 2032
- Figure 15: Middle East and Africa Bioanalytical Lab Services Industry Revenue (Million), by Country 2024 & 2032
- Figure 16: Middle East and Africa Bioanalytical Lab Services Industry Volume (K Unit), by Country 2024 & 2032
- Figure 17: Middle East and Africa Bioanalytical Lab Services Industry Revenue Share (%), by Country 2024 & 2032
- Figure 18: Middle East and Africa Bioanalytical Lab Services Industry Volume Share (%), by Country 2024 & 2032
- Figure 19: South America Bioanalytical Lab Services Industry Revenue (Million), by Country 2024 & 2032
- Figure 20: South America Bioanalytical Lab Services Industry Volume (K Unit), by Country 2024 & 2032
- Figure 21: South America Bioanalytical Lab Services Industry Revenue Share (%), by Country 2024 & 2032
- Figure 22: South America Bioanalytical Lab Services Industry Volume Share (%), by Country 2024 & 2032
- Figure 23: North America Bioanalytical Lab Services Industry Revenue (Million), by Molecule Type 2024 & 2032
- Figure 24: North America Bioanalytical Lab Services Industry Volume (K Unit), by Molecule Type 2024 & 2032
- Figure 25: North America Bioanalytical Lab Services Industry Revenue Share (%), by Molecule Type 2024 & 2032
- Figure 26: North America Bioanalytical Lab Services Industry Volume Share (%), by Molecule Type 2024 & 2032
- Figure 27: North America Bioanalytical Lab Services Industry Revenue (Million), by Test Type 2024 & 2032
- Figure 28: North America Bioanalytical Lab Services Industry Volume (K Unit), by Test Type 2024 & 2032
- Figure 29: North America Bioanalytical Lab Services Industry Revenue Share (%), by Test Type 2024 & 2032
- Figure 30: North America Bioanalytical Lab Services Industry Volume Share (%), by Test Type 2024 & 2032
- Figure 31: North America Bioanalytical Lab Services Industry Revenue (Million), by Country 2024 & 2032
- Figure 32: North America Bioanalytical Lab Services Industry Volume (K Unit), by Country 2024 & 2032
- Figure 33: North America Bioanalytical Lab Services Industry Revenue Share (%), by Country 2024 & 2032
- Figure 34: North America Bioanalytical Lab Services Industry Volume Share (%), by Country 2024 & 2032
- Figure 35: Europe Bioanalytical Lab Services Industry Revenue (Million), by Molecule Type 2024 & 2032
- Figure 36: Europe Bioanalytical Lab Services Industry Volume (K Unit), by Molecule Type 2024 & 2032
- Figure 37: Europe Bioanalytical Lab Services Industry Revenue Share (%), by Molecule Type 2024 & 2032
- Figure 38: Europe Bioanalytical Lab Services Industry Volume Share (%), by Molecule Type 2024 & 2032
- Figure 39: Europe Bioanalytical Lab Services Industry Revenue (Million), by Test Type 2024 & 2032
- Figure 40: Europe Bioanalytical Lab Services Industry Volume (K Unit), by Test Type 2024 & 2032
- Figure 41: Europe Bioanalytical Lab Services Industry Revenue Share (%), by Test Type 2024 & 2032
- Figure 42: Europe Bioanalytical Lab Services Industry Volume Share (%), by Test Type 2024 & 2032
- Figure 43: Europe Bioanalytical Lab Services Industry Revenue (Million), by Country 2024 & 2032
- Figure 44: Europe Bioanalytical Lab Services Industry Volume (K Unit), by Country 2024 & 2032
- Figure 45: Europe Bioanalytical Lab Services Industry Revenue Share (%), by Country 2024 & 2032
- Figure 46: Europe Bioanalytical Lab Services Industry Volume Share (%), by Country 2024 & 2032
- Figure 47: Asia Pacific Bioanalytical Lab Services Industry Revenue (Million), by Molecule Type 2024 & 2032
- Figure 48: Asia Pacific Bioanalytical Lab Services Industry Volume (K Unit), by Molecule Type 2024 & 2032
- Figure 49: Asia Pacific Bioanalytical Lab Services Industry Revenue Share (%), by Molecule Type 2024 & 2032
- Figure 50: Asia Pacific Bioanalytical Lab Services Industry Volume Share (%), by Molecule Type 2024 & 2032
- Figure 51: Asia Pacific Bioanalytical Lab Services Industry Revenue (Million), by Test Type 2024 & 2032
- Figure 52: Asia Pacific Bioanalytical Lab Services Industry Volume (K Unit), by Test Type 2024 & 2032
- Figure 53: Asia Pacific Bioanalytical Lab Services Industry Revenue Share (%), by Test Type 2024 & 2032
- Figure 54: Asia Pacific Bioanalytical Lab Services Industry Volume Share (%), by Test Type 2024 & 2032
- Figure 55: Asia Pacific Bioanalytical Lab Services Industry Revenue (Million), by Country 2024 & 2032
- Figure 56: Asia Pacific Bioanalytical Lab Services Industry Volume (K Unit), by Country 2024 & 2032
- Figure 57: Asia Pacific Bioanalytical Lab Services Industry Revenue Share (%), by Country 2024 & 2032
- Figure 58: Asia Pacific Bioanalytical Lab Services Industry Volume Share (%), by Country 2024 & 2032
- Figure 59: Middle East and Africa Bioanalytical Lab Services Industry Revenue (Million), by Molecule Type 2024 & 2032
- Figure 60: Middle East and Africa Bioanalytical Lab Services Industry Volume (K Unit), by Molecule Type 2024 & 2032
- Figure 61: Middle East and Africa Bioanalytical Lab Services Industry Revenue Share (%), by Molecule Type 2024 & 2032
- Figure 62: Middle East and Africa Bioanalytical Lab Services Industry Volume Share (%), by Molecule Type 2024 & 2032
- Figure 63: Middle East and Africa Bioanalytical Lab Services Industry Revenue (Million), by Test Type 2024 & 2032
- Figure 64: Middle East and Africa Bioanalytical Lab Services Industry Volume (K Unit), by Test Type 2024 & 2032
- Figure 65: Middle East and Africa Bioanalytical Lab Services Industry Revenue Share (%), by Test Type 2024 & 2032
- Figure 66: Middle East and Africa Bioanalytical Lab Services Industry Volume Share (%), by Test Type 2024 & 2032
- Figure 67: Middle East and Africa Bioanalytical Lab Services Industry Revenue (Million), by Country 2024 & 2032
- Figure 68: Middle East and Africa Bioanalytical Lab Services Industry Volume (K Unit), by Country 2024 & 2032
- Figure 69: Middle East and Africa Bioanalytical Lab Services Industry Revenue Share (%), by Country 2024 & 2032
- Figure 70: Middle East and Africa Bioanalytical Lab Services Industry Volume Share (%), by Country 2024 & 2032
- Figure 71: South America Bioanalytical Lab Services Industry Revenue (Million), by Molecule Type 2024 & 2032
- Figure 72: South America Bioanalytical Lab Services Industry Volume (K Unit), by Molecule Type 2024 & 2032
- Figure 73: South America Bioanalytical Lab Services Industry Revenue Share (%), by Molecule Type 2024 & 2032
- Figure 74: South America Bioanalytical Lab Services Industry Volume Share (%), by Molecule Type 2024 & 2032
- Figure 75: South America Bioanalytical Lab Services Industry Revenue (Million), by Test Type 2024 & 2032
- Figure 76: South America Bioanalytical Lab Services Industry Volume (K Unit), by Test Type 2024 & 2032
- Figure 77: South America Bioanalytical Lab Services Industry Revenue Share (%), by Test Type 2024 & 2032
- Figure 78: South America Bioanalytical Lab Services Industry Volume Share (%), by Test Type 2024 & 2032
- Figure 79: South America Bioanalytical Lab Services Industry Revenue (Million), by Country 2024 & 2032
- Figure 80: South America Bioanalytical Lab Services Industry Volume (K Unit), by Country 2024 & 2032
- Figure 81: South America Bioanalytical Lab Services Industry Revenue Share (%), by Country 2024 & 2032
- Figure 82: South America Bioanalytical Lab Services Industry Volume Share (%), by Country 2024 & 2032
List of Tables
- Table 1: Global Bioanalytical Lab Services Industry Revenue Million Forecast, by Region 2019 & 2032
- Table 2: Global Bioanalytical Lab Services Industry Volume K Unit Forecast, by Region 2019 & 2032
- Table 3: Global Bioanalytical Lab Services Industry Revenue Million Forecast, by Molecule Type 2019 & 2032
- Table 4: Global Bioanalytical Lab Services Industry Volume K Unit Forecast, by Molecule Type 2019 & 2032
- Table 5: Global Bioanalytical Lab Services Industry Revenue Million Forecast, by Test Type 2019 & 2032
- Table 6: Global Bioanalytical Lab Services Industry Volume K Unit Forecast, by Test Type 2019 & 2032
- Table 7: Global Bioanalytical Lab Services Industry Revenue Million Forecast, by Region 2019 & 2032
- Table 8: Global Bioanalytical Lab Services Industry Volume K Unit Forecast, by Region 2019 & 2032
- Table 9: Global Bioanalytical Lab Services Industry Revenue Million Forecast, by Country 2019 & 2032
- Table 10: Global Bioanalytical Lab Services Industry Volume K Unit Forecast, by Country 2019 & 2032
- Table 11: US Bioanalytical Lab Services Industry Revenue (Million) Forecast, by Application 2019 & 2032
- Table 12: US Bioanalytical Lab Services Industry Volume (K Unit) Forecast, by Application 2019 & 2032
- Table 13: Canada Bioanalytical Lab Services Industry Revenue (Million) Forecast, by Application 2019 & 2032
- Table 14: Canada Bioanalytical Lab Services Industry Volume (K Unit) Forecast, by Application 2019 & 2032
- Table 15: Mexico Bioanalytical Lab Services Industry Revenue (Million) Forecast, by Application 2019 & 2032
- Table 16: Mexico Bioanalytical Lab Services Industry Volume (K Unit) Forecast, by Application 2019 & 2032
- Table 17: Global Bioanalytical Lab Services Industry Revenue Million Forecast, by Country 2019 & 2032
- Table 18: Global Bioanalytical Lab Services Industry Volume K Unit Forecast, by Country 2019 & 2032
- Table 19: Germany Bioanalytical Lab Services Industry Revenue (Million) Forecast, by Application 2019 & 2032
- Table 20: Germany Bioanalytical Lab Services Industry Volume (K Unit) Forecast, by Application 2019 & 2032
- Table 21: UK Bioanalytical Lab Services Industry Revenue (Million) Forecast, by Application 2019 & 2032
- Table 22: UK Bioanalytical Lab Services Industry Volume (K Unit) Forecast, by Application 2019 & 2032
- Table 23: France Bioanalytical Lab Services Industry Revenue (Million) Forecast, by Application 2019 & 2032
- Table 24: France Bioanalytical Lab Services Industry Volume (K Unit) Forecast, by Application 2019 & 2032
- Table 25: Italy Bioanalytical Lab Services Industry Revenue (Million) Forecast, by Application 2019 & 2032
- Table 26: Italy Bioanalytical Lab Services Industry Volume (K Unit) Forecast, by Application 2019 & 2032
- Table 27: Spain Bioanalytical Lab Services Industry Revenue (Million) Forecast, by Application 2019 & 2032
- Table 28: Spain Bioanalytical Lab Services Industry Volume (K Unit) Forecast, by Application 2019 & 2032
- Table 29: Rest of Europe Bioanalytical Lab Services Industry Revenue (Million) Forecast, by Application 2019 & 2032
- Table 30: Rest of Europe Bioanalytical Lab Services Industry Volume (K Unit) Forecast, by Application 2019 & 2032
- Table 31: Global Bioanalytical Lab Services Industry Revenue Million Forecast, by Country 2019 & 2032
- Table 32: Global Bioanalytical Lab Services Industry Volume K Unit Forecast, by Country 2019 & 2032
- Table 33: China Bioanalytical Lab Services Industry Revenue (Million) Forecast, by Application 2019 & 2032
- Table 34: China Bioanalytical Lab Services Industry Volume (K Unit) Forecast, by Application 2019 & 2032
- Table 35: Japan Bioanalytical Lab Services Industry Revenue (Million) Forecast, by Application 2019 & 2032
- Table 36: Japan Bioanalytical Lab Services Industry Volume (K Unit) Forecast, by Application 2019 & 2032
- Table 37: India Bioanalytical Lab Services Industry Revenue (Million) Forecast, by Application 2019 & 2032
- Table 38: India Bioanalytical Lab Services Industry Volume (K Unit) Forecast, by Application 2019 & 2032
- Table 39: Australia Bioanalytical Lab Services Industry Revenue (Million) Forecast, by Application 2019 & 2032
- Table 40: Australia Bioanalytical Lab Services Industry Volume (K Unit) Forecast, by Application 2019 & 2032
- Table 41: South Korea Bioanalytical Lab Services Industry Revenue (Million) Forecast, by Application 2019 & 2032
- Table 42: South Korea Bioanalytical Lab Services Industry Volume (K Unit) Forecast, by Application 2019 & 2032
- Table 43: Rest of Asia Pacific Bioanalytical Lab Services Industry Revenue (Million) Forecast, by Application 2019 & 2032
- Table 44: Rest of Asia Pacific Bioanalytical Lab Services Industry Volume (K Unit) Forecast, by Application 2019 & 2032
- Table 45: Global Bioanalytical Lab Services Industry Revenue Million Forecast, by Country 2019 & 2032
- Table 46: Global Bioanalytical Lab Services Industry Volume K Unit Forecast, by Country 2019 & 2032
- Table 47: GCC Bioanalytical Lab Services Industry Revenue (Million) Forecast, by Application 2019 & 2032
- Table 48: GCC Bioanalytical Lab Services Industry Volume (K Unit) Forecast, by Application 2019 & 2032
- Table 49: South Africa Bioanalytical Lab Services Industry Revenue (Million) Forecast, by Application 2019 & 2032
- Table 50: South Africa Bioanalytical Lab Services Industry Volume (K Unit) Forecast, by Application 2019 & 2032
- Table 51: Rest of Middle East and Africa Bioanalytical Lab Services Industry Revenue (Million) Forecast, by Application 2019 & 2032
- Table 52: Rest of Middle East and Africa Bioanalytical Lab Services Industry Volume (K Unit) Forecast, by Application 2019 & 2032
- Table 53: Global Bioanalytical Lab Services Industry Revenue Million Forecast, by Country 2019 & 2032
- Table 54: Global Bioanalytical Lab Services Industry Volume K Unit Forecast, by Country 2019 & 2032
- Table 55: Brazil Bioanalytical Lab Services Industry Revenue (Million) Forecast, by Application 2019 & 2032
- Table 56: Brazil Bioanalytical Lab Services Industry Volume (K Unit) Forecast, by Application 2019 & 2032
- Table 57: Argentina Bioanalytical Lab Services Industry Revenue (Million) Forecast, by Application 2019 & 2032
- Table 58: Argentina Bioanalytical Lab Services Industry Volume (K Unit) Forecast, by Application 2019 & 2032
- Table 59: Rest of South America Bioanalytical Lab Services Industry Revenue (Million) Forecast, by Application 2019 & 2032
- Table 60: Rest of South America Bioanalytical Lab Services Industry Volume (K Unit) Forecast, by Application 2019 & 2032
- Table 61: Global Bioanalytical Lab Services Industry Revenue Million Forecast, by Molecule Type 2019 & 2032
- Table 62: Global Bioanalytical Lab Services Industry Volume K Unit Forecast, by Molecule Type 2019 & 2032
- Table 63: Global Bioanalytical Lab Services Industry Revenue Million Forecast, by Test Type 2019 & 2032
- Table 64: Global Bioanalytical Lab Services Industry Volume K Unit Forecast, by Test Type 2019 & 2032
- Table 65: Global Bioanalytical Lab Services Industry Revenue Million Forecast, by Country 2019 & 2032
- Table 66: Global Bioanalytical Lab Services Industry Volume K Unit Forecast, by Country 2019 & 2032
- Table 67: US Bioanalytical Lab Services Industry Revenue (Million) Forecast, by Application 2019 & 2032
- Table 68: US Bioanalytical Lab Services Industry Volume (K Unit) Forecast, by Application 2019 & 2032
- Table 69: Canada Bioanalytical Lab Services Industry Revenue (Million) Forecast, by Application 2019 & 2032
- Table 70: Canada Bioanalytical Lab Services Industry Volume (K Unit) Forecast, by Application 2019 & 2032
- Table 71: Mexico Bioanalytical Lab Services Industry Revenue (Million) Forecast, by Application 2019 & 2032
- Table 72: Mexico Bioanalytical Lab Services Industry Volume (K Unit) Forecast, by Application 2019 & 2032
- Table 73: Global Bioanalytical Lab Services Industry Revenue Million Forecast, by Molecule Type 2019 & 2032
- Table 74: Global Bioanalytical Lab Services Industry Volume K Unit Forecast, by Molecule Type 2019 & 2032
- Table 75: Global Bioanalytical Lab Services Industry Revenue Million Forecast, by Test Type 2019 & 2032
- Table 76: Global Bioanalytical Lab Services Industry Volume K Unit Forecast, by Test Type 2019 & 2032
- Table 77: Global Bioanalytical Lab Services Industry Revenue Million Forecast, by Country 2019 & 2032
- Table 78: Global Bioanalytical Lab Services Industry Volume K Unit Forecast, by Country 2019 & 2032
- Table 79: Germany Bioanalytical Lab Services Industry Revenue (Million) Forecast, by Application 2019 & 2032
- Table 80: Germany Bioanalytical Lab Services Industry Volume (K Unit) Forecast, by Application 2019 & 2032
- Table 81: UK Bioanalytical Lab Services Industry Revenue (Million) Forecast, by Application 2019 & 2032
- Table 82: UK Bioanalytical Lab Services Industry Volume (K Unit) Forecast, by Application 2019 & 2032
- Table 83: France Bioanalytical Lab Services Industry Revenue (Million) Forecast, by Application 2019 & 2032
- Table 84: France Bioanalytical Lab Services Industry Volume (K Unit) Forecast, by Application 2019 & 2032
- Table 85: Italy Bioanalytical Lab Services Industry Revenue (Million) Forecast, by Application 2019 & 2032
- Table 86: Italy Bioanalytical Lab Services Industry Volume (K Unit) Forecast, by Application 2019 & 2032
- Table 87: Spain Bioanalytical Lab Services Industry Revenue (Million) Forecast, by Application 2019 & 2032
- Table 88: Spain Bioanalytical Lab Services Industry Volume (K Unit) Forecast, by Application 2019 & 2032
- Table 89: Rest of Europe Bioanalytical Lab Services Industry Revenue (Million) Forecast, by Application 2019 & 2032
- Table 90: Rest of Europe Bioanalytical Lab Services Industry Volume (K Unit) Forecast, by Application 2019 & 2032
- Table 91: Global Bioanalytical Lab Services Industry Revenue Million Forecast, by Molecule Type 2019 & 2032
- Table 92: Global Bioanalytical Lab Services Industry Volume K Unit Forecast, by Molecule Type 2019 & 2032
- Table 93: Global Bioanalytical Lab Services Industry Revenue Million Forecast, by Test Type 2019 & 2032
- Table 94: Global Bioanalytical Lab Services Industry Volume K Unit Forecast, by Test Type 2019 & 2032
- Table 95: Global Bioanalytical Lab Services Industry Revenue Million Forecast, by Country 2019 & 2032
- Table 96: Global Bioanalytical Lab Services Industry Volume K Unit Forecast, by Country 2019 & 2032
- Table 97: China Bioanalytical Lab Services Industry Revenue (Million) Forecast, by Application 2019 & 2032
- Table 98: China Bioanalytical Lab Services Industry Volume (K Unit) Forecast, by Application 2019 & 2032
- Table 99: Japan Bioanalytical Lab Services Industry Revenue (Million) Forecast, by Application 2019 & 2032
- Table 100: Japan Bioanalytical Lab Services Industry Volume (K Unit) Forecast, by Application 2019 & 2032
- Table 101: India Bioanalytical Lab Services Industry Revenue (Million) Forecast, by Application 2019 & 2032
- Table 102: India Bioanalytical Lab Services Industry Volume (K Unit) Forecast, by Application 2019 & 2032
- Table 103: Australia Bioanalytical Lab Services Industry Revenue (Million) Forecast, by Application 2019 & 2032
- Table 104: Australia Bioanalytical Lab Services Industry Volume (K Unit) Forecast, by Application 2019 & 2032
- Table 105: South Korea Bioanalytical Lab Services Industry Revenue (Million) Forecast, by Application 2019 & 2032
- Table 106: South Korea Bioanalytical Lab Services Industry Volume (K Unit) Forecast, by Application 2019 & 2032
- Table 107: Rest of Asia Pacific Bioanalytical Lab Services Industry Revenue (Million) Forecast, by Application 2019 & 2032
- Table 108: Rest of Asia Pacific Bioanalytical Lab Services Industry Volume (K Unit) Forecast, by Application 2019 & 2032
- Table 109: Global Bioanalytical Lab Services Industry Revenue Million Forecast, by Molecule Type 2019 & 2032
- Table 110: Global Bioanalytical Lab Services Industry Volume K Unit Forecast, by Molecule Type 2019 & 2032
- Table 111: Global Bioanalytical Lab Services Industry Revenue Million Forecast, by Test Type 2019 & 2032
- Table 112: Global Bioanalytical Lab Services Industry Volume K Unit Forecast, by Test Type 2019 & 2032
- Table 113: Global Bioanalytical Lab Services Industry Revenue Million Forecast, by Country 2019 & 2032
- Table 114: Global Bioanalytical Lab Services Industry Volume K Unit Forecast, by Country 2019 & 2032
- Table 115: GCC Bioanalytical Lab Services Industry Revenue (Million) Forecast, by Application 2019 & 2032
- Table 116: GCC Bioanalytical Lab Services Industry Volume (K Unit) Forecast, by Application 2019 & 2032
- Table 117: South Africa Bioanalytical Lab Services Industry Revenue (Million) Forecast, by Application 2019 & 2032
- Table 118: South Africa Bioanalytical Lab Services Industry Volume (K Unit) Forecast, by Application 2019 & 2032
- Table 119: Rest of Middle East and Africa Bioanalytical Lab Services Industry Revenue (Million) Forecast, by Application 2019 & 2032
- Table 120: Rest of Middle East and Africa Bioanalytical Lab Services Industry Volume (K Unit) Forecast, by Application 2019 & 2032
- Table 121: Global Bioanalytical Lab Services Industry Revenue Million Forecast, by Molecule Type 2019 & 2032
- Table 122: Global Bioanalytical Lab Services Industry Volume K Unit Forecast, by Molecule Type 2019 & 2032
- Table 123: Global Bioanalytical Lab Services Industry Revenue Million Forecast, by Test Type 2019 & 2032
- Table 124: Global Bioanalytical Lab Services Industry Volume K Unit Forecast, by Test Type 2019 & 2032
- Table 125: Global Bioanalytical Lab Services Industry Revenue Million Forecast, by Country 2019 & 2032
- Table 126: Global Bioanalytical Lab Services Industry Volume K Unit Forecast, by Country 2019 & 2032
- Table 127: Brazil Bioanalytical Lab Services Industry Revenue (Million) Forecast, by Application 2019 & 2032
- Table 128: Brazil Bioanalytical Lab Services Industry Volume (K Unit) Forecast, by Application 2019 & 2032
- Table 129: Argentina Bioanalytical Lab Services Industry Revenue (Million) Forecast, by Application 2019 & 2032
- Table 130: Argentina Bioanalytical Lab Services Industry Volume (K Unit) Forecast, by Application 2019 & 2032
- Table 131: Rest of South America Bioanalytical Lab Services Industry Revenue (Million) Forecast, by Application 2019 & 2032
- Table 132: Rest of South America Bioanalytical Lab Services Industry Volume (K Unit) Forecast, by Application 2019 & 2032
Frequently Asked Questions
1. What is the projected Compound Annual Growth Rate (CAGR) of the Bioanalytical Lab Services Industry?
The projected CAGR is approximately 9.19%.
2. Which companies are prominent players in the Bioanalytical Lab Services Industry?
Key companies in the market include Intertek Group PLC, Wuxi Apptec Co Ltd, Laboratory Corporation of America Holdings, Pharmaceutical Product Development LLC, Syneos Health, ICON PLC, Charles River Laboratories International Inc, SGS SA, Toxikon Corporation.
3. What are the main segments of the Bioanalytical Lab Services Industry?
The market segments include Molecule Type, Test Type.
4. Can you provide details about the market size?
The market size is estimated to be USD 3.93 Million as of 2022.
5. What are some drivers contributing to market growth?
Increased Necessity of Specific Types of Tests in R&D Activities; Increased Trend of Outsourcing Laboratory Testing Services.
6. What are the notable trends driving market growth?
Small Molecule Sub-segment Expected to Show Better Growth in the Bioanalytical Testing Services Market.
7. Are there any restraints impacting market growth?
Complex Regulatory Framework for Maintaining Laboratories; Challenges in the Development of Proper Analytical Techniques.
8. Can you provide examples of recent developments in the market?
N/A
9. What pricing options are available for accessing the report?
Pricing options include single-user, multi-user, and enterprise licenses priced at USD 4750, USD 5250, and USD 8750 respectively.
10. Is the market size provided in terms of value or volume?
The market size is provided in terms of value, measured in Million and volume, measured in K Unit.
11. Are there any specific market keywords associated with the report?
Yes, the market keyword associated with the report is "Bioanalytical Lab Services Industry," which aids in identifying and referencing the specific market segment covered.
12. How do I determine which pricing option suits my needs best?
The pricing options vary based on user requirements and access needs. Individual users may opt for single-user licenses, while businesses requiring broader access may choose multi-user or enterprise licenses for cost-effective access to the report.
13. Are there any additional resources or data provided in the Bioanalytical Lab Services Industry report?
While the report offers comprehensive insights, it's advisable to review the specific contents or supplementary materials provided to ascertain if additional resources or data are available.
14. How can I stay updated on further developments or reports in the Bioanalytical Lab Services Industry?
To stay informed about further developments, trends, and reports in the Bioanalytical Lab Services Industry, consider subscribing to industry newsletters, following relevant companies and organizations, or regularly checking reputable industry news sources and publications.
Methodology
Step 1 - Identification of Relevant Samples Size from Population Database


Step 2 - Approaches for Defining Global Market Size (Value, Volume* & Price*)

Note*: In applicable scenarios
Step 3 - Data Sources
Primary Research
- Web Analytics
- Survey Reports
- Research Institute
- Latest Research Reports
- Opinion Leaders
Secondary Research
- Annual Reports
- White Paper
- Latest Press Release
- Industry Association
- Paid Database
- Investor Presentations

Step 4 - Data Triangulation
Involves using different sources of information in order to increase the validity of a study
These sources are likely to be stakeholders in a program - participants, other researchers, program staff, other community members, and so on.
Then we put all data in single framework & apply various statistical tools to find out the dynamic on the market.
During the analysis stage, feedback from the stakeholder groups would be compared to determine areas of agreement as well as areas of divergence


