
Key Insights
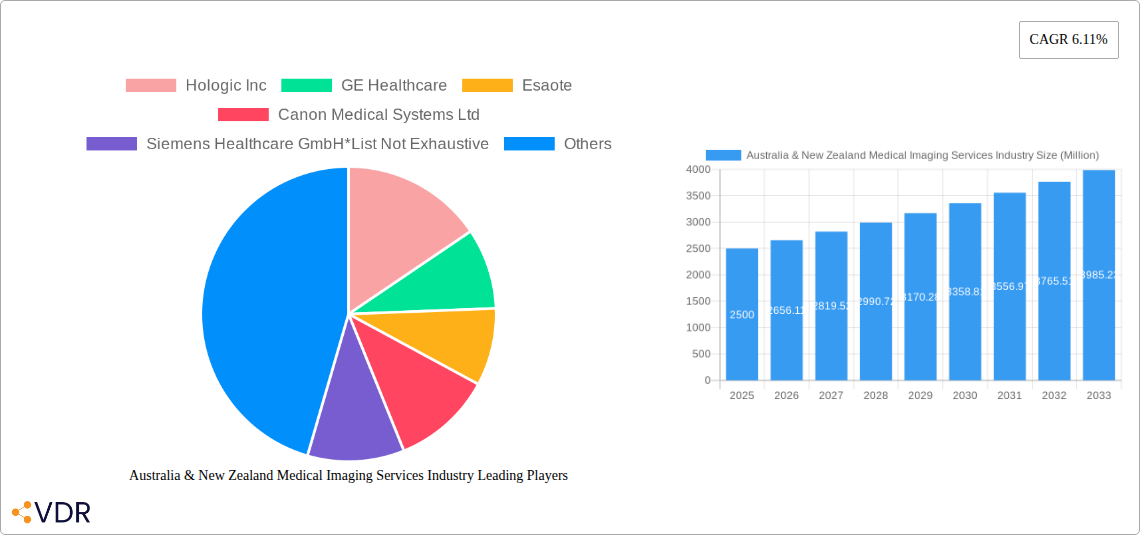
The Australian & New Zealand medical imaging services market is experiencing robust growth, driven by factors such as an aging population, rising prevalence of chronic diseases (like cancer and cardiovascular conditions), increasing demand for advanced diagnostic techniques, and government initiatives promoting preventative healthcare. The market is segmented by application (cardiology, oncology, neurology, orthopedics, gastroenterology, gynecology, and others), end-user (hospitals, diagnostic centers, and others), and modality (MRI, CT, ultrasound, X-ray, nuclear imaging, fluoroscopy, and mammography). The 6.11% CAGR indicates a steady expansion, projecting significant market value increases over the forecast period (2025-2033). Competition is intense, with major players like Hologic, GE Healthcare, Esaote, Canon Medical Systems, Siemens Healthcare, Carestream Health, Philips, and Fujifilm vying for market share through technological advancements, strategic partnerships, and service expansions. Growth is further fueled by the adoption of AI-powered image analysis and the increasing integration of telemedicine, streamlining diagnostics and improving patient access, particularly in remote areas. While regulatory hurdles and high equipment costs might pose some restraints, the overall market outlook remains positive, with significant opportunities for expansion in specialized imaging services and advanced diagnostic capabilities.
Technological innovation is a key driver of market growth. The adoption of advanced imaging techniques like AI-assisted diagnostics, 3D imaging, and molecular imaging enhances diagnostic accuracy, leading to improved patient outcomes. This technological shift is attracting significant investments in research and development, contributing to the overall market expansion. The increasing prevalence of chronic diseases further fuels this demand, as early and accurate diagnosis is crucial for effective treatment. The integration of medical imaging services with Electronic Health Records (EHR) systems also improves workflow efficiency and reduces healthcare costs. The market is likely to see further consolidation as larger companies acquire smaller players to enhance their market share and service offerings. Furthermore, growing awareness about preventative healthcare among the Australian and New Zealand population is expected to drive greater utilization of medical imaging services, supporting consistent market growth in the coming years.
Australia & New Zealand Medical Imaging Services Industry: A Comprehensive Market Report (2019-2033)
This comprehensive report provides an in-depth analysis of the Australia & New Zealand medical imaging services industry, encompassing market dynamics, growth trends, key players, and future outlook. With a study period spanning 2019-2033, a base year of 2025, and a forecast period of 2025-2033, this report is an essential resource for industry professionals, investors, and strategic decision-makers. The report segments the market by application (Cardiology, Oncology, Neurology, Orthopedics, Gastroenterology, Gynecology, Other Applications), end-user (Hospital, Diagnostic Centers, Others), and modality (MRI, Computed Tomography, Ultrasound, X-ray, Nuclear Imaging, Fluoroscopy, Mammography). Key players analyzed include Hologic Inc, GE Healthcare, Esaote, Canon Medical Systems Ltd, Siemens Healthcare GmbH, Carestream Health, Koninklijke Philips NV, and Fujifilm Holdings Corporation. The total market value in 2025 is estimated at xx Million.
Australia & New Zealand Medical Imaging Services Industry Market Dynamics & Structure
The Australian and New Zealand medical imaging services market is characterized by a moderately concentrated landscape, with several multinational corporations holding significant market share. The market is driven by technological advancements, particularly in AI-powered diagnostics and portable imaging solutions, and a growing aging population necessitating increased healthcare services. Stringent regulatory frameworks ensure quality and safety standards. The market also experiences competitive pressures from substitute technologies and pricing strategies. Mergers and acquisitions (M&A) activity is relatively moderate, with strategic partnerships becoming increasingly prevalent.
- Market Concentration: The top 5 players hold approximately xx% of the market share in 2025.
- Technological Innovation: AI-driven image analysis and portable imaging technologies are major drivers.
- Regulatory Framework: Stringent regulations by Therapeutic Goods Administration (TGA) in Australia and Medsafe in New Zealand influence market dynamics.
- Competitive Substitutes: Advancements in alternative diagnostic methods pose some competitive pressure.
- End-User Demographics: Aging population and rising prevalence of chronic diseases fuel market growth.
- M&A Trends: Strategic partnerships and collaborations are more prevalent than large-scale acquisitions, with approximately xx M&A deals recorded between 2019 and 2024.
Australia & New Zealand Medical Imaging Services Industry Growth Trends & Insights
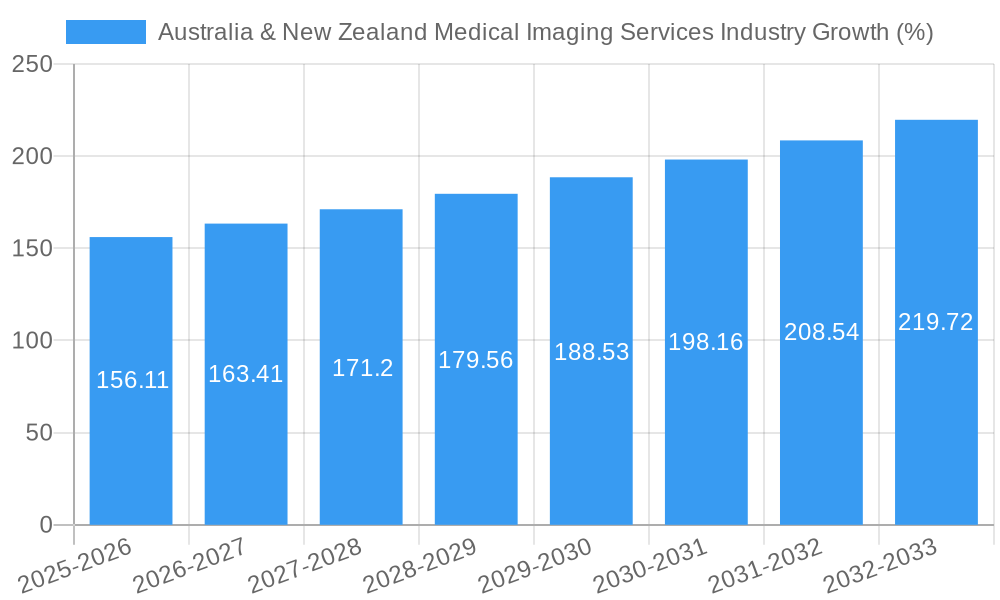
The Australia & New Zealand medical imaging services market is experiencing robust growth, driven by increasing demand for advanced diagnostic procedures, technological advancements, and government initiatives promoting healthcare infrastructure development. The market size expanded from xx Million in 2019 to xx Million in 2024, exhibiting a CAGR of xx% during the historical period. The forecast period (2025-2033) projects continued expansion, reaching xx Million by 2033, with a projected CAGR of xx%. This growth is fueled by increasing adoption rates of advanced imaging modalities like MRI and CT scans, coupled with rising technological disruptions, leading to improved image quality, faster processing times, and reduced radiation exposure. Consumer behavior is shifting toward a preference for minimally invasive procedures and faster diagnostic turnaround times. The market penetration of advanced imaging technologies is expected to increase significantly in the coming years.
Dominant Regions, Countries, or Segments in Australia & New Zealand Medical Imaging Services Industry
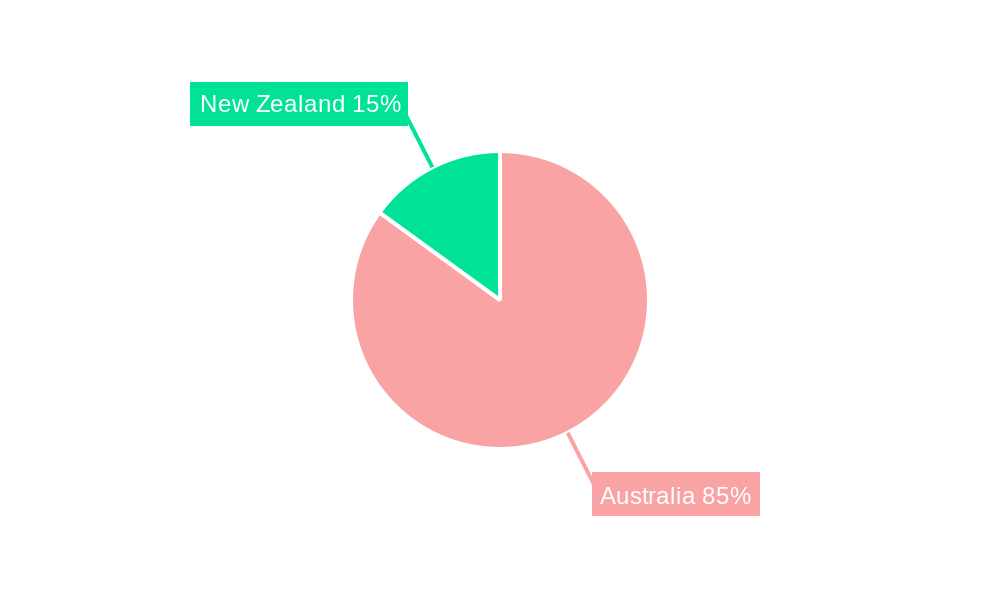
The Australian market constitutes the larger share of the overall market, driven by a larger population base and greater concentration of healthcare facilities. Within the application segment, Cardiology and Oncology represent the largest market share, driven by increasing prevalence of cardiovascular diseases and cancer, respectively. Hospitals are the dominant end-users, accounting for the majority of market revenue. Among imaging modalities, Computed Tomography (CT) and Magnetic Resonance Imaging (MRI) are the leading segments.
- Key Growth Drivers:
- Rising prevalence of chronic diseases.
- Increased government investment in healthcare infrastructure.
- Technological advancements in imaging technology.
- Growing geriatric population.
- Dominant Segments:
- Application: Cardiology and Oncology.
- End User: Hospitals.
- Modality: CT and MRI.
Australia & New Zealand Medical Imaging Services Industry Product Landscape
The medical imaging services market showcases continuous innovation, with the introduction of advanced technologies like AI-powered image analysis, portable imaging systems, and improved image resolution techniques. These innovations enhance diagnostic accuracy, reduce procedure times, and improve patient experience. Unique selling propositions often include superior image quality, reduced radiation exposure, and streamlined workflows. Technological advancements such as improved software algorithms and the development of hybrid imaging systems significantly impact the product landscape.
Key Drivers, Barriers & Challenges in Australia & New Zealand Medical Imaging Services Industry
Key Drivers:
- Growing prevalence of chronic diseases.
- Technological advancements improving diagnostic accuracy and efficiency.
- Increasing government funding and healthcare initiatives.
Key Challenges:
- High cost of advanced imaging technologies.
- Stringent regulatory approvals and compliance requirements.
- Skilled workforce shortage.
- Competition from established players.
- Supply chain disruptions potentially impacting access to consumables and equipment.
Emerging Opportunities in Australia & New Zealand Medical Imaging Services Industry
- Growing adoption of AI and machine learning in diagnostics.
- Expanding use of telehealth and remote diagnostic capabilities.
- Increasing demand for minimally invasive procedures and advanced imaging techniques.
- Focus on personalized medicine and targeted therapies.
Growth Accelerators in the Australia & New Zealand Medical Imaging Services Industry
Long-term growth will be driven by continued technological breakthroughs, particularly in AI-powered diagnostics and minimally invasive imaging. Strategic partnerships between technology providers and healthcare institutions are accelerating market penetration. Government initiatives promoting healthcare infrastructure and investment in advanced medical technologies further fuel market growth.
Key Players Shaping the Australia & New Zealand Medical Imaging Services Market
- Hologic Inc
- GE Healthcare
- Esaote
- Canon Medical Systems Ltd
- Siemens Healthcare GmbH
- Carestream Health
- Koninklijke Philips NV
- Fujifilm Holdings Corporation
Notable Milestones in Australia & New Zealand Medical Imaging Services Industry Sector
- May 2022: EMVision (Australia) develops portable brain imaging technology.
- May 2022: Toku Eyes (New Zealand) unveils AI-powered heart risk assessment technology using retinal scans.
In-Depth Australia & New Zealand Medical Imaging Services Industry Market Outlook
The future of the Australia & New Zealand medical imaging services market is promising, driven by continued technological innovation, aging population, and government support. The market is poised for significant growth, driven by increasing adoption of advanced imaging modalities and AI-powered diagnostic tools. Strategic partnerships and investments in research and development will further propel market expansion. Companies focusing on innovation, patient-centric solutions, and cost-effective technologies are well-positioned for success in this dynamic and rapidly evolving market.
Australia & New Zealand Medical Imaging Services Industry Segmentation
-
1. Modality
- 1.1. MRI
- 1.2. Computed Tomography
- 1.3. Ultrasound
- 1.4. X-ray
- 1.5. Nuclear Imaging
- 1.6. Fluoroscopy
- 1.7. Mamography
-
2. Application
- 2.1. Cardiology
- 2.2. Oncology
- 2.3. Neurology
- 2.4. Orthopedics
- 2.5. Gastroenterology
- 2.6. Gynecology
- 2.7. Other Applications
-
3. End User
- 3.1. Hospital
- 3.2. Diagnostic Centers
- 3.3. Others
Australia & New Zealand Medical Imaging Services Industry Segmentation By Geography
- 1. Australia
Australia & New Zealand Medical Imaging Services Industry REPORT HIGHLIGHTS
| Aspects | Details |
|---|---|
| Study Period | 2019-2033 |
| Base Year | 2024 |
| Estimated Year | 2025 |
| Forecast Period | 2025-2033 |
| Historical Period | 2019-2024 |
| Growth Rate | CAGR of 6.11% from 2019-2033 |
| Segmentation |
|
Table of Contents
- 1. Introduction
- 1.1. Research Scope
- 1.2. Market Segmentation
- 1.3. Research Methodology
- 1.4. Definitions and Assumptions
- 2. Executive Summary
- 2.1. Introduction
- 3. Market Dynamics
- 3.1. Introduction
- 3.2. Market Drivers
- 3.2.1. Technological Advancements; Growth Burden of Chronic Diseases
- 3.3. Market Restrains
- 3.3.1. High Cost of Advanced Diagnostic Imaging Devices
- 3.4. Market Trends
- 3.4.1. X-ray Segment Captures the Largest Market Share and is Expected to Retain its Dominance over the Forecast Period
- 4. Market Factor Analysis
- 4.1. Porters Five Forces
- 4.2. Supply/Value Chain
- 4.3. PESTEL analysis
- 4.4. Market Entropy
- 4.5. Patent/Trademark Analysis
- 5. Australia & New Zealand Medical Imaging Services Industry Analysis, Insights and Forecast, 2019-2031
- 5.1. Market Analysis, Insights and Forecast - by Modality
- 5.1.1. MRI
- 5.1.2. Computed Tomography
- 5.1.3. Ultrasound
- 5.1.4. X-ray
- 5.1.5. Nuclear Imaging
- 5.1.6. Fluoroscopy
- 5.1.7. Mamography
- 5.2. Market Analysis, Insights and Forecast - by Application
- 5.2.1. Cardiology
- 5.2.2. Oncology
- 5.2.3. Neurology
- 5.2.4. Orthopedics
- 5.2.5. Gastroenterology
- 5.2.6. Gynecology
- 5.2.7. Other Applications
- 5.3. Market Analysis, Insights and Forecast - by End User
- 5.3.1. Hospital
- 5.3.2. Diagnostic Centers
- 5.3.3. Others
- 5.4. Market Analysis, Insights and Forecast - by Region
- 5.4.1. Australia
- 5.1. Market Analysis, Insights and Forecast - by Modality
- 6. Competitive Analysis
- 6.1. Market Share Analysis 2024
- 6.2. Company Profiles
- 6.2.1 Hologic Inc
- 6.2.1.1. Overview
- 6.2.1.2. Products
- 6.2.1.3. SWOT Analysis
- 6.2.1.4. Recent Developments
- 6.2.1.5. Financials (Based on Availability)
- 6.2.2 GE Healthcare
- 6.2.2.1. Overview
- 6.2.2.2. Products
- 6.2.2.3. SWOT Analysis
- 6.2.2.4. Recent Developments
- 6.2.2.5. Financials (Based on Availability)
- 6.2.3 Esaote
- 6.2.3.1. Overview
- 6.2.3.2. Products
- 6.2.3.3. SWOT Analysis
- 6.2.3.4. Recent Developments
- 6.2.3.5. Financials (Based on Availability)
- 6.2.4 Canon Medical Systems Ltd
- 6.2.4.1. Overview
- 6.2.4.2. Products
- 6.2.4.3. SWOT Analysis
- 6.2.4.4. Recent Developments
- 6.2.4.5. Financials (Based on Availability)
- 6.2.5 Siemens Healthcare GmbH*List Not Exhaustive
- 6.2.5.1. Overview
- 6.2.5.2. Products
- 6.2.5.3. SWOT Analysis
- 6.2.5.4. Recent Developments
- 6.2.5.5. Financials (Based on Availability)
- 6.2.6 Carestream Health
- 6.2.6.1. Overview
- 6.2.6.2. Products
- 6.2.6.3. SWOT Analysis
- 6.2.6.4. Recent Developments
- 6.2.6.5. Financials (Based on Availability)
- 6.2.7 Koninklijke Philips NV
- 6.2.7.1. Overview
- 6.2.7.2. Products
- 6.2.7.3. SWOT Analysis
- 6.2.7.4. Recent Developments
- 6.2.7.5. Financials (Based on Availability)
- 6.2.8 Fujifilm Holdings Corporation
- 6.2.8.1. Overview
- 6.2.8.2. Products
- 6.2.8.3. SWOT Analysis
- 6.2.8.4. Recent Developments
- 6.2.8.5. Financials (Based on Availability)
- 6.2.1 Hologic Inc
List of Figures
- Figure 1: Australia & New Zealand Medical Imaging Services Industry Revenue Breakdown (Million, %) by Product 2024 & 2032
- Figure 2: Australia & New Zealand Medical Imaging Services Industry Share (%) by Company 2024
List of Tables
- Table 1: Australia & New Zealand Medical Imaging Services Industry Revenue Million Forecast, by Region 2019 & 2032
- Table 2: Australia & New Zealand Medical Imaging Services Industry Revenue Million Forecast, by Modality 2019 & 2032
- Table 3: Australia & New Zealand Medical Imaging Services Industry Revenue Million Forecast, by Application 2019 & 2032
- Table 4: Australia & New Zealand Medical Imaging Services Industry Revenue Million Forecast, by End User 2019 & 2032
- Table 5: Australia & New Zealand Medical Imaging Services Industry Revenue Million Forecast, by Region 2019 & 2032
- Table 6: Australia & New Zealand Medical Imaging Services Industry Revenue Million Forecast, by Country 2019 & 2032
- Table 7: Australia & New Zealand Medical Imaging Services Industry Revenue Million Forecast, by Modality 2019 & 2032
- Table 8: Australia & New Zealand Medical Imaging Services Industry Revenue Million Forecast, by Application 2019 & 2032
- Table 9: Australia & New Zealand Medical Imaging Services Industry Revenue Million Forecast, by End User 2019 & 2032
- Table 10: Australia & New Zealand Medical Imaging Services Industry Revenue Million Forecast, by Country 2019 & 2032
Frequently Asked Questions
1. What is the projected Compound Annual Growth Rate (CAGR) of the Australia & New Zealand Medical Imaging Services Industry?
The projected CAGR is approximately 6.11%.
2. Which companies are prominent players in the Australia & New Zealand Medical Imaging Services Industry?
Key companies in the market include Hologic Inc, GE Healthcare, Esaote, Canon Medical Systems Ltd, Siemens Healthcare GmbH*List Not Exhaustive, Carestream Health, Koninklijke Philips NV, Fujifilm Holdings Corporation.
3. What are the main segments of the Australia & New Zealand Medical Imaging Services Industry?
The market segments include Modality, Application, End User.
4. Can you provide details about the market size?
The market size is estimated to be USD XX Million as of 2022.
5. What are some drivers contributing to market growth?
Technological Advancements; Growth Burden of Chronic Diseases.
6. What are the notable trends driving market growth?
X-ray Segment Captures the Largest Market Share and is Expected to Retain its Dominance over the Forecast Period.
7. Are there any restraints impacting market growth?
High Cost of Advanced Diagnostic Imaging Devices.
8. Can you provide examples of recent developments in the market?
In May 2022, The Australian medical technology company EMVision has developed portable brain imaging technology.
9. What pricing options are available for accessing the report?
Pricing options include single-user, multi-user, and enterprise licenses priced at USD 3800, USD 4500, and USD 5800 respectively.
10. Is the market size provided in terms of value or volume?
The market size is provided in terms of value, measured in Million.
11. Are there any specific market keywords associated with the report?
Yes, the market keyword associated with the report is "Australia & New Zealand Medical Imaging Services Industry," which aids in identifying and referencing the specific market segment covered.
12. How do I determine which pricing option suits my needs best?
The pricing options vary based on user requirements and access needs. Individual users may opt for single-user licenses, while businesses requiring broader access may choose multi-user or enterprise licenses for cost-effective access to the report.
13. Are there any additional resources or data provided in the Australia & New Zealand Medical Imaging Services Industry report?
While the report offers comprehensive insights, it's advisable to review the specific contents or supplementary materials provided to ascertain if additional resources or data are available.
14. How can I stay updated on further developments or reports in the Australia & New Zealand Medical Imaging Services Industry?
To stay informed about further developments, trends, and reports in the Australia & New Zealand Medical Imaging Services Industry, consider subscribing to industry newsletters, following relevant companies and organizations, or regularly checking reputable industry news sources and publications.
Methodology
Step 1 - Identification of Relevant Samples Size from Population Database


Step 2 - Approaches for Defining Global Market Size (Value, Volume* & Price*)

Note*: In applicable scenarios
Step 3 - Data Sources
Primary Research
- Web Analytics
- Survey Reports
- Research Institute
- Latest Research Reports
- Opinion Leaders
Secondary Research
- Annual Reports
- White Paper
- Latest Press Release
- Industry Association
- Paid Database
- Investor Presentations

Step 4 - Data Triangulation
Involves using different sources of information in order to increase the validity of a study
These sources are likely to be stakeholders in a program - participants, other researchers, program staff, other community members, and so on.
Then we put all data in single framework & apply various statistical tools to find out the dynamic on the market.
During the analysis stage, feedback from the stakeholder groups would be compared to determine areas of agreement as well as areas of divergence


