
Key Insights
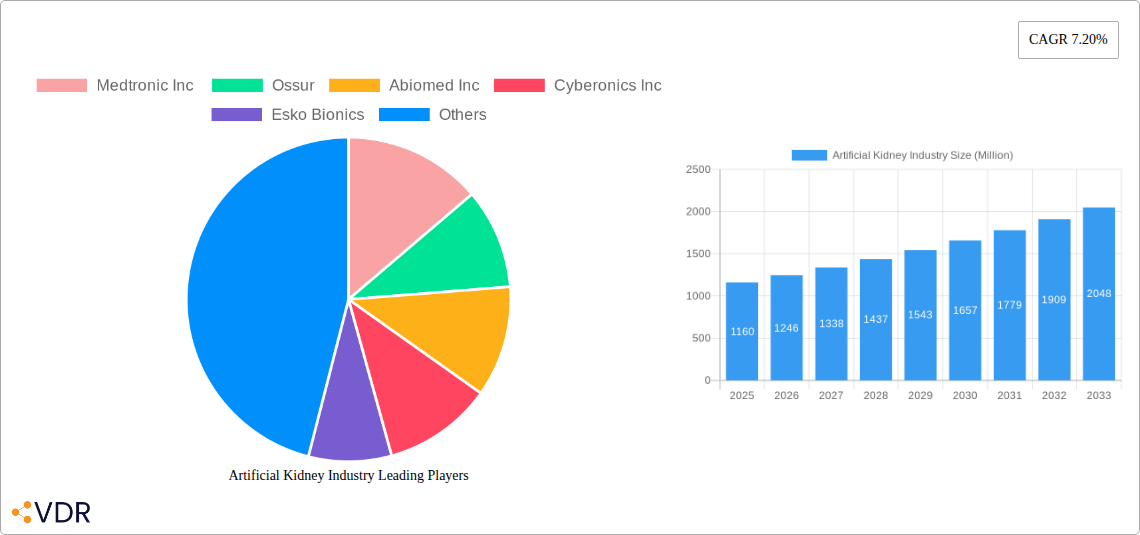
The global artificial kidney market is experiencing robust growth, projected to reach \$1.16 billion in 2025 and maintain a Compound Annual Growth Rate (CAGR) of 7.20% from 2025 to 2033. This expansion is driven by several key factors. The rising prevalence of chronic kidney disease (CKD) and end-stage renal disease (ESRD), coupled with an aging global population, significantly increases the demand for effective dialysis solutions. Technological advancements in wearable and implantable artificial kidney devices are improving treatment efficacy, patient comfort, and overall quality of life, further fueling market growth. The shift towards home dialysis is also gaining momentum, driven by cost-effectiveness and improved patient autonomy. This trend is expected to contribute significantly to the market's expansion over the forecast period. Furthermore, increasing investments in research and development, along with supportive regulatory frameworks in several regions, are creating a favorable environment for market players. Competition among established companies like Medtronic, Fresenius Medical Care, and Baxter International, alongside emerging innovative players, is fostering innovation and driving down costs, making artificial kidney technology more accessible.
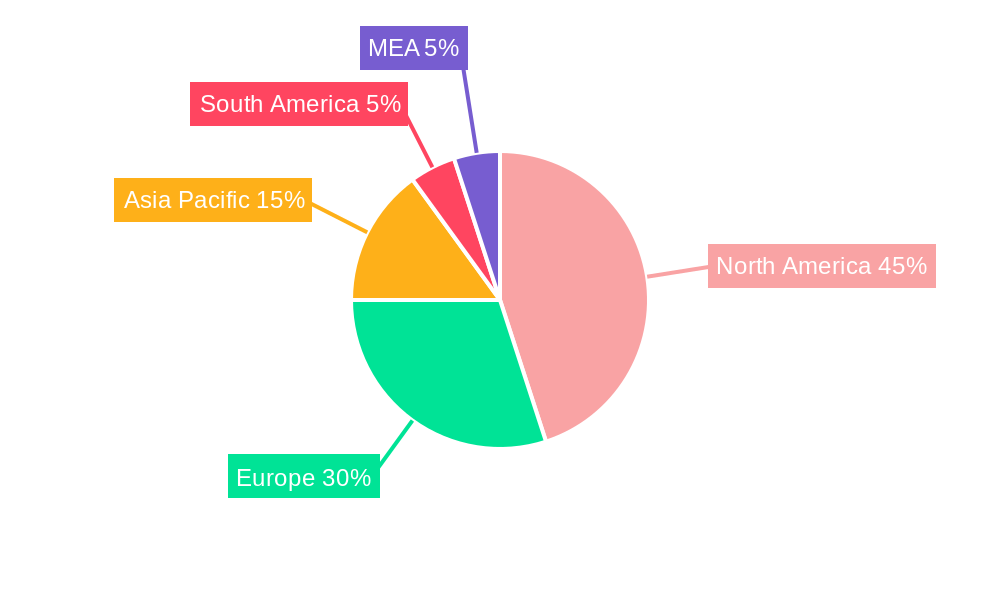
The market segmentation reveals a significant share held by the North American region, driven by high healthcare expenditure and technological advancements. However, Asia Pacific is poised for substantial growth, fueled by rising CKD prevalence and increasing healthcare infrastructure development in countries like China and India. The wearable segment is expected to witness faster growth compared to implantable devices due to factors like enhanced portability and convenience. Hospitals and dialysis centers currently dominate the end-user segment; however, the home-use segment is experiencing a surge, driven by the aforementioned factors. Kidney failure and chronic kidney disease remain the primary application areas, with continuous technological advancements targeting improved treatment outcomes and reduced complications. The market is expected to see further diversification in applications as research progresses.
Artificial Kidney Industry Market Report: 2019-2033
This comprehensive report provides an in-depth analysis of the artificial kidney industry, encompassing market dynamics, growth trends, regional segmentation, product landscape, key players, and future outlook. The study period spans from 2019 to 2033, with 2025 serving as the base and estimated year. The report focuses on parent market segments like medical devices and dialysis solutions, and their child markets including wearable and implantable artificial kidneys.
Artificial Kidney Industry Market Dynamics & Structure
The global artificial kidney market, valued at xx million units in 2025, is characterized by moderate concentration with key players holding significant market share. Technological innovation, particularly in bioartificial kidney development, is a major driver, while stringent regulatory frameworks and reimbursement policies present challenges. The market witnesses continuous M&A activity, with an estimated xx deals in the past five years, further shaping the competitive landscape. Substitute therapies, such as dialysis, influence market penetration. End-user demographics, particularly the aging population and rising prevalence of chronic kidney disease (CKD), significantly impact market growth.
- Market Concentration: Moderately concentrated, with top 5 players holding xx% market share.
- Technological Innovation: Focus on bioartificial kidneys and improved dialysis support systems.
- Regulatory Landscape: Stringent approvals and reimbursement processes impacting market entry.
- Competitive Substitutes: Traditional dialysis remains a significant competitor.
- M&A Activity: xx M&A deals in the last 5 years, driven by technological advancement and market consolidation.
- End-User Demographics: Aging population and increased prevalence of CKD driving demand.
Artificial Kidney Industry Growth Trends & Insights
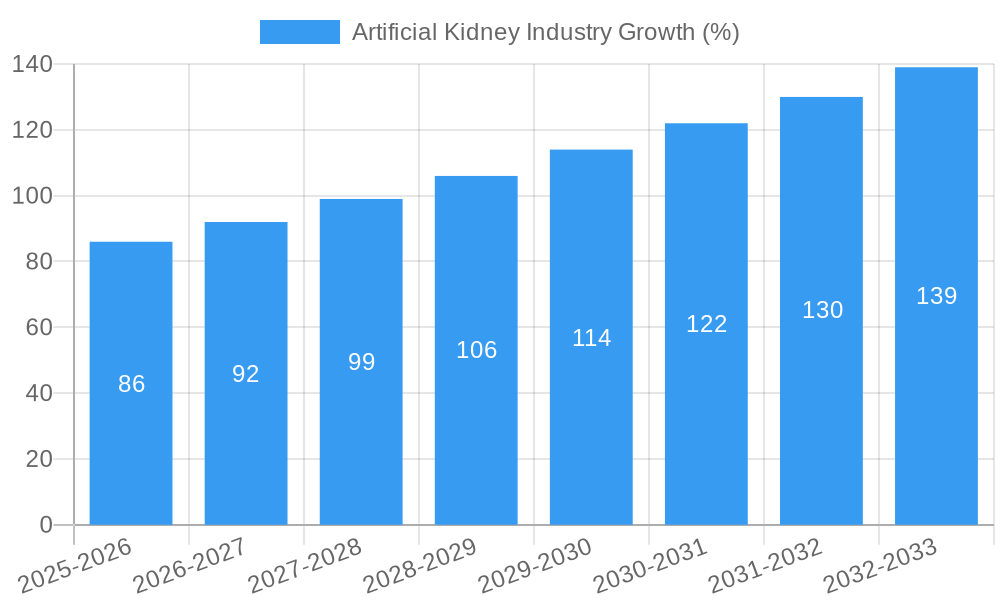
The artificial kidney market exhibits a CAGR of xx% during the forecast period (2025-2033), driven by technological advancements, increasing prevalence of CKD and kidney failure, and rising healthcare expenditure. Market penetration of artificial kidneys remains relatively low compared to dialysis, but the adoption rate is expected to increase significantly due to the advantages offered by artificial kidneys, including improved quality of life and reduced healthcare burden. The shift towards home-based dialysis and wearable devices further fuels market growth. Consumer behavior is shifting towards minimally invasive procedures and personalized treatment options. Technological disruptions, such as the development of bioartificial kidneys, are poised to revolutionize the market.
Dominant Regions, Countries, or Segments in Artificial Kidney Industry
North America currently holds the largest market share, driven by high healthcare expenditure, advanced medical infrastructure, and a substantial CKD patient population. Europe follows closely, with strong adoption rates and supportive government initiatives. Within the device type segment, implantable artificial kidneys dominate due to their long-term efficacy, while hospitals and dialysis centers constitute the largest end-user segment. The application segment is predominantly driven by the increasing number of patients with kidney failure and chronic kidney disease. The home-use segment is expected to witness significant growth due to technological advancements and growing patient preference for convenience.
- Key Drivers:
- High prevalence of CKD in North America and Europe.
- Favorable reimbursement policies.
- Technological advancements.
- Growing awareness regarding the benefits of artificial kidneys.
- Dominant Segments:
- Implantable devices (Market Share: xx%)
- Hospitals & Dialysis Centers (Market Share: xx%)
- Kidney Failure Application (Market Share: xx%)
Artificial Kidney Industry Product Landscape
The artificial kidney market offers a range of products, including wearable and implantable devices, each with unique selling propositions. Wearable devices focus on portability and convenience, while implantable devices offer long-term solutions. Technological advancements concentrate on biocompatibility, miniaturization, and enhanced functionality. Performance metrics include filtration efficiency, longevity, and biocompatibility. Key innovations include the development of bioartificial kidneys aimed at reducing the need for immunosuppressants and increasing the longevity of the device.
Key Drivers, Barriers & Challenges in Artificial Kidney Industry
Key Drivers:
- Rising prevalence of CKD and kidney failure globally.
- Technological advancements leading to improved device efficacy and safety.
- Increased healthcare expenditure and improved access to healthcare.
- Growing demand for less invasive and more convenient treatment options.
Key Challenges and Restraints:
- High cost of artificial kidneys.
- Stringent regulatory approvals and reimbursement processes.
- Limited availability and accessibility in certain regions.
- Potential long-term complications and risks associated with the devices.
- Supply chain disruptions affecting device manufacturing and distribution.
Emerging Opportunities in Artificial Kidney Industry
Untapped markets in developing economies present significant growth opportunities. Innovation in bioartificial kidneys and personalized treatment options holds immense potential. Evolving consumer preferences toward minimally invasive procedures and improved quality of life are driving demand for innovative solutions. Telemedicine and remote monitoring systems could enhance patient care and reduce hospitalization rates.
Growth Accelerators in the Artificial Kidney Industry Industry
Technological breakthroughs, particularly in bioartificial kidney development, are a major catalyst for long-term growth. Strategic partnerships between medical device companies, research institutions, and healthcare providers can accelerate innovation and market adoption. Expansion strategies targeting emerging markets and untapped patient populations can drive market expansion.
Key Players Shaping the Artificial Kidney Industry Market
- Medtronic Inc
- Ossur
- Abiomed Inc
- Cyberonics Inc
- Esko Bionics
- Asahi Kasei Medical Co Ltd
- Cochlear Ltd
- Boston Scientific Corporation
- Baxter International Inc
- Berlin Heart GmbH
Notable Milestones in Artificial Kidney Industry Sector
- August 2022: The Kidney Innovation Accelerator (KidneyX) launched a prize competition to advance bioartificial kidney development.
- July 2022: Successful implantation of a total artificial heart in a child at SickKids hospital in Canada, leveraging US-based training.
In-Depth Artificial Kidney Industry Market Outlook
The future of the artificial kidney market is bright, driven by continuous technological advancements and growing awareness of CKD. Strategic partnerships, expansion into emerging markets, and a focus on patient-centric solutions will be crucial for long-term success. The development and commercialization of bioartificial kidneys have the potential to revolutionize the treatment of kidney failure, creating significant opportunities for market growth and improvement in patient outcomes.
Artificial Kidney Industry Segmentation
-
1. Type
-
1.1. Artificial Organ
- 1.1.1. Artificial Heart
- 1.1.2. Artificial Kidney
- 1.1.3. Artificial Lungs
- 1.1.4. Cochlear Implants
- 1.1.5. Other Organ Types
-
1.2. Bionics
- 1.2.1. Vision Bionics
- 1.2.2. Ear Bionics
- 1.2.3. Orthopedic Bionic
- 1.2.4. Cardiac Bionics
-
1.1. Artificial Organ
-
2. Geography
- 2.1. United States
- 2.2. Canada
- 2.3. Mexico
Artificial Kidney Industry Segmentation By Geography
- 1. United States
- 2. Canada
- 3. Mexico
Artificial Kidney Industry REPORT HIGHLIGHTS
| Aspects | Details |
|---|---|
| Study Period | 2019-2033 |
| Base Year | 2024 |
| Estimated Year | 2025 |
| Forecast Period | 2025-2033 |
| Historical Period | 2019-2024 |
| Growth Rate | CAGR of 7.20% from 2019-2033 |
| Segmentation |
|
Table of Contents
- 1. Introduction
- 1.1. Research Scope
- 1.2. Market Segmentation
- 1.3. Research Methodology
- 1.4. Definitions and Assumptions
- 2. Executive Summary
- 2.1. Introduction
- 3. Market Dynamics
- 3.1. Introduction
- 3.2. Market Drivers
- 3.2.1. Increased Incidence of Disabilities and Organ Failures; High Incidence of Road Accidents Leading to Amputations; Technological Advancements in the Artificial Organ and Bionics
- 3.3. Market Restrains
- 3.3.1. Expensive Procedures; Risk of Compatibility Issues and Malfunctions
- 3.4. Market Trends
- 3.4.1. Artificial Kidney Segment is Estimated to Witness a Healthy Growth Over the Forecast Period
- 4. Market Factor Analysis
- 4.1. Porters Five Forces
- 4.2. Supply/Value Chain
- 4.3. PESTEL analysis
- 4.4. Market Entropy
- 4.5. Patent/Trademark Analysis
- 5. Global Artificial Kidney Industry Analysis, Insights and Forecast, 2019-2031
- 5.1. Market Analysis, Insights and Forecast - by Type
- 5.1.1. Artificial Organ
- 5.1.1.1. Artificial Heart
- 5.1.1.2. Artificial Kidney
- 5.1.1.3. Artificial Lungs
- 5.1.1.4. Cochlear Implants
- 5.1.1.5. Other Organ Types
- 5.1.2. Bionics
- 5.1.2.1. Vision Bionics
- 5.1.2.2. Ear Bionics
- 5.1.2.3. Orthopedic Bionic
- 5.1.2.4. Cardiac Bionics
- 5.1.1. Artificial Organ
- 5.2. Market Analysis, Insights and Forecast - by Geography
- 5.2.1. United States
- 5.2.2. Canada
- 5.2.3. Mexico
- 5.3. Market Analysis, Insights and Forecast - by Region
- 5.3.1. United States
- 5.3.2. Canada
- 5.3.3. Mexico
- 5.1. Market Analysis, Insights and Forecast - by Type
- 6. United States Artificial Kidney Industry Analysis, Insights and Forecast, 2019-2031
- 6.1. Market Analysis, Insights and Forecast - by Type
- 6.1.1. Artificial Organ
- 6.1.1.1. Artificial Heart
- 6.1.1.2. Artificial Kidney
- 6.1.1.3. Artificial Lungs
- 6.1.1.4. Cochlear Implants
- 6.1.1.5. Other Organ Types
- 6.1.2. Bionics
- 6.1.2.1. Vision Bionics
- 6.1.2.2. Ear Bionics
- 6.1.2.3. Orthopedic Bionic
- 6.1.2.4. Cardiac Bionics
- 6.1.1. Artificial Organ
- 6.2. Market Analysis, Insights and Forecast - by Geography
- 6.2.1. United States
- 6.2.2. Canada
- 6.2.3. Mexico
- 6.1. Market Analysis, Insights and Forecast - by Type
- 7. Canada Artificial Kidney Industry Analysis, Insights and Forecast, 2019-2031
- 7.1. Market Analysis, Insights and Forecast - by Type
- 7.1.1. Artificial Organ
- 7.1.1.1. Artificial Heart
- 7.1.1.2. Artificial Kidney
- 7.1.1.3. Artificial Lungs
- 7.1.1.4. Cochlear Implants
- 7.1.1.5. Other Organ Types
- 7.1.2. Bionics
- 7.1.2.1. Vision Bionics
- 7.1.2.2. Ear Bionics
- 7.1.2.3. Orthopedic Bionic
- 7.1.2.4. Cardiac Bionics
- 7.1.1. Artificial Organ
- 7.2. Market Analysis, Insights and Forecast - by Geography
- 7.2.1. United States
- 7.2.2. Canada
- 7.2.3. Mexico
- 7.1. Market Analysis, Insights and Forecast - by Type
- 8. Mexico Artificial Kidney Industry Analysis, Insights and Forecast, 2019-2031
- 8.1. Market Analysis, Insights and Forecast - by Type
- 8.1.1. Artificial Organ
- 8.1.1.1. Artificial Heart
- 8.1.1.2. Artificial Kidney
- 8.1.1.3. Artificial Lungs
- 8.1.1.4. Cochlear Implants
- 8.1.1.5. Other Organ Types
- 8.1.2. Bionics
- 8.1.2.1. Vision Bionics
- 8.1.2.2. Ear Bionics
- 8.1.2.3. Orthopedic Bionic
- 8.1.2.4. Cardiac Bionics
- 8.1.1. Artificial Organ
- 8.2. Market Analysis, Insights and Forecast - by Geography
- 8.2.1. United States
- 8.2.2. Canada
- 8.2.3. Mexico
- 8.1. Market Analysis, Insights and Forecast - by Type
- 9. North America Artificial Kidney Industry Analysis, Insights and Forecast, 2019-2031
- 9.1. Market Analysis, Insights and Forecast - By Country/Sub-region
- 9.1.1 United States
- 9.1.2 Canada
- 9.1.3 Mexico
- 10. Europe Artificial Kidney Industry Analysis, Insights and Forecast, 2019-2031
- 10.1. Market Analysis, Insights and Forecast - By Country/Sub-region
- 10.1.1 Germany
- 10.1.2 United Kingdom
- 10.1.3 France
- 10.1.4 Spain
- 10.1.5 Italy
- 10.1.6 Spain
- 10.1.7 Belgium
- 10.1.8 Netherland
- 10.1.9 Nordics
- 10.1.10 Rest of Europe
- 11. Asia Pacific Artificial Kidney Industry Analysis, Insights and Forecast, 2019-2031
- 11.1. Market Analysis, Insights and Forecast - By Country/Sub-region
- 11.1.1 China
- 11.1.2 Japan
- 11.1.3 India
- 11.1.4 South Korea
- 11.1.5 Southeast Asia
- 11.1.6 Australia
- 11.1.7 Indonesia
- 11.1.8 Phillipes
- 11.1.9 Singapore
- 11.1.10 Thailandc
- 11.1.11 Rest of Asia Pacific
- 12. South America Artificial Kidney Industry Analysis, Insights and Forecast, 2019-2031
- 12.1. Market Analysis, Insights and Forecast - By Country/Sub-region
- 12.1.1 Brazil
- 12.1.2 Argentina
- 12.1.3 Peru
- 12.1.4 Chile
- 12.1.5 Colombia
- 12.1.6 Ecuador
- 12.1.7 Venezuela
- 12.1.8 Rest of South America
- 13. North America Artificial Kidney Industry Analysis, Insights and Forecast, 2019-2031
- 13.1. Market Analysis, Insights and Forecast - By Country/Sub-region
- 13.1.1 United States
- 13.1.2 Canada
- 13.1.3 Mexico
- 14. MEA Artificial Kidney Industry Analysis, Insights and Forecast, 2019-2031
- 14.1. Market Analysis, Insights and Forecast - By Country/Sub-region
- 14.1.1 United Arab Emirates
- 14.1.2 Saudi Arabia
- 14.1.3 South Africa
- 14.1.4 Rest of Middle East and Africa
- 15. Competitive Analysis
- 15.1. Global Market Share Analysis 2024
- 15.2. Company Profiles
- 15.2.1 Medtronic Inc
- 15.2.1.1. Overview
- 15.2.1.2. Products
- 15.2.1.3. SWOT Analysis
- 15.2.1.4. Recent Developments
- 15.2.1.5. Financials (Based on Availability)
- 15.2.2 Ossur
- 15.2.2.1. Overview
- 15.2.2.2. Products
- 15.2.2.3. SWOT Analysis
- 15.2.2.4. Recent Developments
- 15.2.2.5. Financials (Based on Availability)
- 15.2.3 Abiomed Inc
- 15.2.3.1. Overview
- 15.2.3.2. Products
- 15.2.3.3. SWOT Analysis
- 15.2.3.4. Recent Developments
- 15.2.3.5. Financials (Based on Availability)
- 15.2.4 Cyberonics Inc
- 15.2.4.1. Overview
- 15.2.4.2. Products
- 15.2.4.3. SWOT Analysis
- 15.2.4.4. Recent Developments
- 15.2.4.5. Financials (Based on Availability)
- 15.2.5 Esko Bionics
- 15.2.5.1. Overview
- 15.2.5.2. Products
- 15.2.5.3. SWOT Analysis
- 15.2.5.4. Recent Developments
- 15.2.5.5. Financials (Based on Availability)
- 15.2.6 Asahi Kasei Medical Co Ltd
- 15.2.6.1. Overview
- 15.2.6.2. Products
- 15.2.6.3. SWOT Analysis
- 15.2.6.4. Recent Developments
- 15.2.6.5. Financials (Based on Availability)
- 15.2.7 Cochlear Ltd
- 15.2.7.1. Overview
- 15.2.7.2. Products
- 15.2.7.3. SWOT Analysis
- 15.2.7.4. Recent Developments
- 15.2.7.5. Financials (Based on Availability)
- 15.2.8 Boston Scientific Corporation
- 15.2.8.1. Overview
- 15.2.8.2. Products
- 15.2.8.3. SWOT Analysis
- 15.2.8.4. Recent Developments
- 15.2.8.5. Financials (Based on Availability)
- 15.2.9 Baxter International Inc
- 15.2.9.1. Overview
- 15.2.9.2. Products
- 15.2.9.3. SWOT Analysis
- 15.2.9.4. Recent Developments
- 15.2.9.5. Financials (Based on Availability)
- 15.2.10 Berlin Heart GmbH
- 15.2.10.1. Overview
- 15.2.10.2. Products
- 15.2.10.3. SWOT Analysis
- 15.2.10.4. Recent Developments
- 15.2.10.5. Financials (Based on Availability)
- 15.2.1 Medtronic Inc
List of Figures
- Figure 1: Global Artificial Kidney Industry Revenue Breakdown (Million, %) by Region 2024 & 2032
- Figure 2: Global Artificial Kidney Industry Volume Breakdown (Piece, %) by Region 2024 & 2032
- Figure 3: North America Artificial Kidney Industry Revenue (Million), by Country 2024 & 2032
- Figure 4: North America Artificial Kidney Industry Volume (Piece), by Country 2024 & 2032
- Figure 5: North America Artificial Kidney Industry Revenue Share (%), by Country 2024 & 2032
- Figure 6: North America Artificial Kidney Industry Volume Share (%), by Country 2024 & 2032
- Figure 7: Europe Artificial Kidney Industry Revenue (Million), by Country 2024 & 2032
- Figure 8: Europe Artificial Kidney Industry Volume (Piece), by Country 2024 & 2032
- Figure 9: Europe Artificial Kidney Industry Revenue Share (%), by Country 2024 & 2032
- Figure 10: Europe Artificial Kidney Industry Volume Share (%), by Country 2024 & 2032
- Figure 11: Asia Pacific Artificial Kidney Industry Revenue (Million), by Country 2024 & 2032
- Figure 12: Asia Pacific Artificial Kidney Industry Volume (Piece), by Country 2024 & 2032
- Figure 13: Asia Pacific Artificial Kidney Industry Revenue Share (%), by Country 2024 & 2032
- Figure 14: Asia Pacific Artificial Kidney Industry Volume Share (%), by Country 2024 & 2032
- Figure 15: South America Artificial Kidney Industry Revenue (Million), by Country 2024 & 2032
- Figure 16: South America Artificial Kidney Industry Volume (Piece), by Country 2024 & 2032
- Figure 17: South America Artificial Kidney Industry Revenue Share (%), by Country 2024 & 2032
- Figure 18: South America Artificial Kidney Industry Volume Share (%), by Country 2024 & 2032
- Figure 19: North America Artificial Kidney Industry Revenue (Million), by Country 2024 & 2032
- Figure 20: North America Artificial Kidney Industry Volume (Piece), by Country 2024 & 2032
- Figure 21: North America Artificial Kidney Industry Revenue Share (%), by Country 2024 & 2032
- Figure 22: North America Artificial Kidney Industry Volume Share (%), by Country 2024 & 2032
- Figure 23: MEA Artificial Kidney Industry Revenue (Million), by Country 2024 & 2032
- Figure 24: MEA Artificial Kidney Industry Volume (Piece), by Country 2024 & 2032
- Figure 25: MEA Artificial Kidney Industry Revenue Share (%), by Country 2024 & 2032
- Figure 26: MEA Artificial Kidney Industry Volume Share (%), by Country 2024 & 2032
- Figure 27: United States Artificial Kidney Industry Revenue (Million), by Type 2024 & 2032
- Figure 28: United States Artificial Kidney Industry Volume (Piece), by Type 2024 & 2032
- Figure 29: United States Artificial Kidney Industry Revenue Share (%), by Type 2024 & 2032
- Figure 30: United States Artificial Kidney Industry Volume Share (%), by Type 2024 & 2032
- Figure 31: United States Artificial Kidney Industry Revenue (Million), by Geography 2024 & 2032
- Figure 32: United States Artificial Kidney Industry Volume (Piece), by Geography 2024 & 2032
- Figure 33: United States Artificial Kidney Industry Revenue Share (%), by Geography 2024 & 2032
- Figure 34: United States Artificial Kidney Industry Volume Share (%), by Geography 2024 & 2032
- Figure 35: United States Artificial Kidney Industry Revenue (Million), by Country 2024 & 2032
- Figure 36: United States Artificial Kidney Industry Volume (Piece), by Country 2024 & 2032
- Figure 37: United States Artificial Kidney Industry Revenue Share (%), by Country 2024 & 2032
- Figure 38: United States Artificial Kidney Industry Volume Share (%), by Country 2024 & 2032
- Figure 39: Canada Artificial Kidney Industry Revenue (Million), by Type 2024 & 2032
- Figure 40: Canada Artificial Kidney Industry Volume (Piece), by Type 2024 & 2032
- Figure 41: Canada Artificial Kidney Industry Revenue Share (%), by Type 2024 & 2032
- Figure 42: Canada Artificial Kidney Industry Volume Share (%), by Type 2024 & 2032
- Figure 43: Canada Artificial Kidney Industry Revenue (Million), by Geography 2024 & 2032
- Figure 44: Canada Artificial Kidney Industry Volume (Piece), by Geography 2024 & 2032
- Figure 45: Canada Artificial Kidney Industry Revenue Share (%), by Geography 2024 & 2032
- Figure 46: Canada Artificial Kidney Industry Volume Share (%), by Geography 2024 & 2032
- Figure 47: Canada Artificial Kidney Industry Revenue (Million), by Country 2024 & 2032
- Figure 48: Canada Artificial Kidney Industry Volume (Piece), by Country 2024 & 2032
- Figure 49: Canada Artificial Kidney Industry Revenue Share (%), by Country 2024 & 2032
- Figure 50: Canada Artificial Kidney Industry Volume Share (%), by Country 2024 & 2032
- Figure 51: Mexico Artificial Kidney Industry Revenue (Million), by Type 2024 & 2032
- Figure 52: Mexico Artificial Kidney Industry Volume (Piece), by Type 2024 & 2032
- Figure 53: Mexico Artificial Kidney Industry Revenue Share (%), by Type 2024 & 2032
- Figure 54: Mexico Artificial Kidney Industry Volume Share (%), by Type 2024 & 2032
- Figure 55: Mexico Artificial Kidney Industry Revenue (Million), by Geography 2024 & 2032
- Figure 56: Mexico Artificial Kidney Industry Volume (Piece), by Geography 2024 & 2032
- Figure 57: Mexico Artificial Kidney Industry Revenue Share (%), by Geography 2024 & 2032
- Figure 58: Mexico Artificial Kidney Industry Volume Share (%), by Geography 2024 & 2032
- Figure 59: Mexico Artificial Kidney Industry Revenue (Million), by Country 2024 & 2032
- Figure 60: Mexico Artificial Kidney Industry Volume (Piece), by Country 2024 & 2032
- Figure 61: Mexico Artificial Kidney Industry Revenue Share (%), by Country 2024 & 2032
- Figure 62: Mexico Artificial Kidney Industry Volume Share (%), by Country 2024 & 2032
List of Tables
- Table 1: Global Artificial Kidney Industry Revenue Million Forecast, by Region 2019 & 2032
- Table 2: Global Artificial Kidney Industry Volume Piece Forecast, by Region 2019 & 2032
- Table 3: Global Artificial Kidney Industry Revenue Million Forecast, by Type 2019 & 2032
- Table 4: Global Artificial Kidney Industry Volume Piece Forecast, by Type 2019 & 2032
- Table 5: Global Artificial Kidney Industry Revenue Million Forecast, by Geography 2019 & 2032
- Table 6: Global Artificial Kidney Industry Volume Piece Forecast, by Geography 2019 & 2032
- Table 7: Global Artificial Kidney Industry Revenue Million Forecast, by Region 2019 & 2032
- Table 8: Global Artificial Kidney Industry Volume Piece Forecast, by Region 2019 & 2032
- Table 9: Global Artificial Kidney Industry Revenue Million Forecast, by Country 2019 & 2032
- Table 10: Global Artificial Kidney Industry Volume Piece Forecast, by Country 2019 & 2032
- Table 11: United States Artificial Kidney Industry Revenue (Million) Forecast, by Application 2019 & 2032
- Table 12: United States Artificial Kidney Industry Volume (Piece) Forecast, by Application 2019 & 2032
- Table 13: Canada Artificial Kidney Industry Revenue (Million) Forecast, by Application 2019 & 2032
- Table 14: Canada Artificial Kidney Industry Volume (Piece) Forecast, by Application 2019 & 2032
- Table 15: Mexico Artificial Kidney Industry Revenue (Million) Forecast, by Application 2019 & 2032
- Table 16: Mexico Artificial Kidney Industry Volume (Piece) Forecast, by Application 2019 & 2032
- Table 17: Global Artificial Kidney Industry Revenue Million Forecast, by Country 2019 & 2032
- Table 18: Global Artificial Kidney Industry Volume Piece Forecast, by Country 2019 & 2032
- Table 19: Germany Artificial Kidney Industry Revenue (Million) Forecast, by Application 2019 & 2032
- Table 20: Germany Artificial Kidney Industry Volume (Piece) Forecast, by Application 2019 & 2032
- Table 21: United Kingdom Artificial Kidney Industry Revenue (Million) Forecast, by Application 2019 & 2032
- Table 22: United Kingdom Artificial Kidney Industry Volume (Piece) Forecast, by Application 2019 & 2032
- Table 23: France Artificial Kidney Industry Revenue (Million) Forecast, by Application 2019 & 2032
- Table 24: France Artificial Kidney Industry Volume (Piece) Forecast, by Application 2019 & 2032
- Table 25: Spain Artificial Kidney Industry Revenue (Million) Forecast, by Application 2019 & 2032
- Table 26: Spain Artificial Kidney Industry Volume (Piece) Forecast, by Application 2019 & 2032
- Table 27: Italy Artificial Kidney Industry Revenue (Million) Forecast, by Application 2019 & 2032
- Table 28: Italy Artificial Kidney Industry Volume (Piece) Forecast, by Application 2019 & 2032
- Table 29: Spain Artificial Kidney Industry Revenue (Million) Forecast, by Application 2019 & 2032
- Table 30: Spain Artificial Kidney Industry Volume (Piece) Forecast, by Application 2019 & 2032
- Table 31: Belgium Artificial Kidney Industry Revenue (Million) Forecast, by Application 2019 & 2032
- Table 32: Belgium Artificial Kidney Industry Volume (Piece) Forecast, by Application 2019 & 2032
- Table 33: Netherland Artificial Kidney Industry Revenue (Million) Forecast, by Application 2019 & 2032
- Table 34: Netherland Artificial Kidney Industry Volume (Piece) Forecast, by Application 2019 & 2032
- Table 35: Nordics Artificial Kidney Industry Revenue (Million) Forecast, by Application 2019 & 2032
- Table 36: Nordics Artificial Kidney Industry Volume (Piece) Forecast, by Application 2019 & 2032
- Table 37: Rest of Europe Artificial Kidney Industry Revenue (Million) Forecast, by Application 2019 & 2032
- Table 38: Rest of Europe Artificial Kidney Industry Volume (Piece) Forecast, by Application 2019 & 2032
- Table 39: Global Artificial Kidney Industry Revenue Million Forecast, by Country 2019 & 2032
- Table 40: Global Artificial Kidney Industry Volume Piece Forecast, by Country 2019 & 2032
- Table 41: China Artificial Kidney Industry Revenue (Million) Forecast, by Application 2019 & 2032
- Table 42: China Artificial Kidney Industry Volume (Piece) Forecast, by Application 2019 & 2032
- Table 43: Japan Artificial Kidney Industry Revenue (Million) Forecast, by Application 2019 & 2032
- Table 44: Japan Artificial Kidney Industry Volume (Piece) Forecast, by Application 2019 & 2032
- Table 45: India Artificial Kidney Industry Revenue (Million) Forecast, by Application 2019 & 2032
- Table 46: India Artificial Kidney Industry Volume (Piece) Forecast, by Application 2019 & 2032
- Table 47: South Korea Artificial Kidney Industry Revenue (Million) Forecast, by Application 2019 & 2032
- Table 48: South Korea Artificial Kidney Industry Volume (Piece) Forecast, by Application 2019 & 2032
- Table 49: Southeast Asia Artificial Kidney Industry Revenue (Million) Forecast, by Application 2019 & 2032
- Table 50: Southeast Asia Artificial Kidney Industry Volume (Piece) Forecast, by Application 2019 & 2032
- Table 51: Australia Artificial Kidney Industry Revenue (Million) Forecast, by Application 2019 & 2032
- Table 52: Australia Artificial Kidney Industry Volume (Piece) Forecast, by Application 2019 & 2032
- Table 53: Indonesia Artificial Kidney Industry Revenue (Million) Forecast, by Application 2019 & 2032
- Table 54: Indonesia Artificial Kidney Industry Volume (Piece) Forecast, by Application 2019 & 2032
- Table 55: Phillipes Artificial Kidney Industry Revenue (Million) Forecast, by Application 2019 & 2032
- Table 56: Phillipes Artificial Kidney Industry Volume (Piece) Forecast, by Application 2019 & 2032
- Table 57: Singapore Artificial Kidney Industry Revenue (Million) Forecast, by Application 2019 & 2032
- Table 58: Singapore Artificial Kidney Industry Volume (Piece) Forecast, by Application 2019 & 2032
- Table 59: Thailandc Artificial Kidney Industry Revenue (Million) Forecast, by Application 2019 & 2032
- Table 60: Thailandc Artificial Kidney Industry Volume (Piece) Forecast, by Application 2019 & 2032
- Table 61: Rest of Asia Pacific Artificial Kidney Industry Revenue (Million) Forecast, by Application 2019 & 2032
- Table 62: Rest of Asia Pacific Artificial Kidney Industry Volume (Piece) Forecast, by Application 2019 & 2032
- Table 63: Global Artificial Kidney Industry Revenue Million Forecast, by Country 2019 & 2032
- Table 64: Global Artificial Kidney Industry Volume Piece Forecast, by Country 2019 & 2032
- Table 65: Brazil Artificial Kidney Industry Revenue (Million) Forecast, by Application 2019 & 2032
- Table 66: Brazil Artificial Kidney Industry Volume (Piece) Forecast, by Application 2019 & 2032
- Table 67: Argentina Artificial Kidney Industry Revenue (Million) Forecast, by Application 2019 & 2032
- Table 68: Argentina Artificial Kidney Industry Volume (Piece) Forecast, by Application 2019 & 2032
- Table 69: Peru Artificial Kidney Industry Revenue (Million) Forecast, by Application 2019 & 2032
- Table 70: Peru Artificial Kidney Industry Volume (Piece) Forecast, by Application 2019 & 2032
- Table 71: Chile Artificial Kidney Industry Revenue (Million) Forecast, by Application 2019 & 2032
- Table 72: Chile Artificial Kidney Industry Volume (Piece) Forecast, by Application 2019 & 2032
- Table 73: Colombia Artificial Kidney Industry Revenue (Million) Forecast, by Application 2019 & 2032
- Table 74: Colombia Artificial Kidney Industry Volume (Piece) Forecast, by Application 2019 & 2032
- Table 75: Ecuador Artificial Kidney Industry Revenue (Million) Forecast, by Application 2019 & 2032
- Table 76: Ecuador Artificial Kidney Industry Volume (Piece) Forecast, by Application 2019 & 2032
- Table 77: Venezuela Artificial Kidney Industry Revenue (Million) Forecast, by Application 2019 & 2032
- Table 78: Venezuela Artificial Kidney Industry Volume (Piece) Forecast, by Application 2019 & 2032
- Table 79: Rest of South America Artificial Kidney Industry Revenue (Million) Forecast, by Application 2019 & 2032
- Table 80: Rest of South America Artificial Kidney Industry Volume (Piece) Forecast, by Application 2019 & 2032
- Table 81: Global Artificial Kidney Industry Revenue Million Forecast, by Country 2019 & 2032
- Table 82: Global Artificial Kidney Industry Volume Piece Forecast, by Country 2019 & 2032
- Table 83: United States Artificial Kidney Industry Revenue (Million) Forecast, by Application 2019 & 2032
- Table 84: United States Artificial Kidney Industry Volume (Piece) Forecast, by Application 2019 & 2032
- Table 85: Canada Artificial Kidney Industry Revenue (Million) Forecast, by Application 2019 & 2032
- Table 86: Canada Artificial Kidney Industry Volume (Piece) Forecast, by Application 2019 & 2032
- Table 87: Mexico Artificial Kidney Industry Revenue (Million) Forecast, by Application 2019 & 2032
- Table 88: Mexico Artificial Kidney Industry Volume (Piece) Forecast, by Application 2019 & 2032
- Table 89: Global Artificial Kidney Industry Revenue Million Forecast, by Country 2019 & 2032
- Table 90: Global Artificial Kidney Industry Volume Piece Forecast, by Country 2019 & 2032
- Table 91: United Arab Emirates Artificial Kidney Industry Revenue (Million) Forecast, by Application 2019 & 2032
- Table 92: United Arab Emirates Artificial Kidney Industry Volume (Piece) Forecast, by Application 2019 & 2032
- Table 93: Saudi Arabia Artificial Kidney Industry Revenue (Million) Forecast, by Application 2019 & 2032
- Table 94: Saudi Arabia Artificial Kidney Industry Volume (Piece) Forecast, by Application 2019 & 2032
- Table 95: South Africa Artificial Kidney Industry Revenue (Million) Forecast, by Application 2019 & 2032
- Table 96: South Africa Artificial Kidney Industry Volume (Piece) Forecast, by Application 2019 & 2032
- Table 97: Rest of Middle East and Africa Artificial Kidney Industry Revenue (Million) Forecast, by Application 2019 & 2032
- Table 98: Rest of Middle East and Africa Artificial Kidney Industry Volume (Piece) Forecast, by Application 2019 & 2032
- Table 99: Global Artificial Kidney Industry Revenue Million Forecast, by Type 2019 & 2032
- Table 100: Global Artificial Kidney Industry Volume Piece Forecast, by Type 2019 & 2032
- Table 101: Global Artificial Kidney Industry Revenue Million Forecast, by Geography 2019 & 2032
- Table 102: Global Artificial Kidney Industry Volume Piece Forecast, by Geography 2019 & 2032
- Table 103: Global Artificial Kidney Industry Revenue Million Forecast, by Country 2019 & 2032
- Table 104: Global Artificial Kidney Industry Volume Piece Forecast, by Country 2019 & 2032
- Table 105: Global Artificial Kidney Industry Revenue Million Forecast, by Type 2019 & 2032
- Table 106: Global Artificial Kidney Industry Volume Piece Forecast, by Type 2019 & 2032
- Table 107: Global Artificial Kidney Industry Revenue Million Forecast, by Geography 2019 & 2032
- Table 108: Global Artificial Kidney Industry Volume Piece Forecast, by Geography 2019 & 2032
- Table 109: Global Artificial Kidney Industry Revenue Million Forecast, by Country 2019 & 2032
- Table 110: Global Artificial Kidney Industry Volume Piece Forecast, by Country 2019 & 2032
- Table 111: Global Artificial Kidney Industry Revenue Million Forecast, by Type 2019 & 2032
- Table 112: Global Artificial Kidney Industry Volume Piece Forecast, by Type 2019 & 2032
- Table 113: Global Artificial Kidney Industry Revenue Million Forecast, by Geography 2019 & 2032
- Table 114: Global Artificial Kidney Industry Volume Piece Forecast, by Geography 2019 & 2032
- Table 115: Global Artificial Kidney Industry Revenue Million Forecast, by Country 2019 & 2032
- Table 116: Global Artificial Kidney Industry Volume Piece Forecast, by Country 2019 & 2032
Frequently Asked Questions
1. What is the projected Compound Annual Growth Rate (CAGR) of the Artificial Kidney Industry?
The projected CAGR is approximately 7.20%.
2. Which companies are prominent players in the Artificial Kidney Industry?
Key companies in the market include Medtronic Inc , Ossur, Abiomed Inc, Cyberonics Inc, Esko Bionics, Asahi Kasei Medical Co Ltd, Cochlear Ltd, Boston Scientific Corporation, Baxter International Inc, Berlin Heart GmbH.
3. What are the main segments of the Artificial Kidney Industry?
The market segments include Type, Geography.
4. Can you provide details about the market size?
The market size is estimated to be USD 1.16 Million as of 2022.
5. What are some drivers contributing to market growth?
Increased Incidence of Disabilities and Organ Failures; High Incidence of Road Accidents Leading to Amputations; Technological Advancements in the Artificial Organ and Bionics.
6. What are the notable trends driving market growth?
Artificial Kidney Segment is Estimated to Witness a Healthy Growth Over the Forecast Period.
7. Are there any restraints impacting market growth?
Expensive Procedures; Risk of Compatibility Issues and Malfunctions.
8. Can you provide examples of recent developments in the market?
August 2022: The United States Department of Health and Human Services (HHS) and the American Society of Nephrology (ASN) unveiled a fresh prize competition through the Kidney Innovation Accelerator (KidneyX). This competition aims to advance the development of a fully functional bioartificial kidney.
9. What pricing options are available for accessing the report?
Pricing options include single-user, multi-user, and enterprise licenses priced at USD 4750, USD 5250, and USD 8750 respectively.
10. Is the market size provided in terms of value or volume?
The market size is provided in terms of value, measured in Million and volume, measured in Piece.
11. Are there any specific market keywords associated with the report?
Yes, the market keyword associated with the report is "Artificial Kidney Industry," which aids in identifying and referencing the specific market segment covered.
12. How do I determine which pricing option suits my needs best?
The pricing options vary based on user requirements and access needs. Individual users may opt for single-user licenses, while businesses requiring broader access may choose multi-user or enterprise licenses for cost-effective access to the report.
13. Are there any additional resources or data provided in the Artificial Kidney Industry report?
While the report offers comprehensive insights, it's advisable to review the specific contents or supplementary materials provided to ascertain if additional resources or data are available.
14. How can I stay updated on further developments or reports in the Artificial Kidney Industry?
To stay informed about further developments, trends, and reports in the Artificial Kidney Industry, consider subscribing to industry newsletters, following relevant companies and organizations, or regularly checking reputable industry news sources and publications.
Methodology
Step 1 - Identification of Relevant Samples Size from Population Database


Step 2 - Approaches for Defining Global Market Size (Value, Volume* & Price*)

Note*: In applicable scenarios
Step 3 - Data Sources
Primary Research
- Web Analytics
- Survey Reports
- Research Institute
- Latest Research Reports
- Opinion Leaders
Secondary Research
- Annual Reports
- White Paper
- Latest Press Release
- Industry Association
- Paid Database
- Investor Presentations

Step 4 - Data Triangulation
Involves using different sources of information in order to increase the validity of a study
These sources are likely to be stakeholders in a program - participants, other researchers, program staff, other community members, and so on.
Then we put all data in single framework & apply various statistical tools to find out the dynamic on the market.
During the analysis stage, feedback from the stakeholder groups would be compared to determine areas of agreement as well as areas of divergence


