
Key Insights
The Asia-Pacific (APAC) vehicle telematics market is experiencing robust growth, projected to reach a substantial size driven by increasing adoption of connected car technologies and stringent government regulations mandating safety features. The market's Compound Annual Growth Rate (CAGR) exceeding 15.37% from 2019 to 2024 indicates a significant upward trajectory. This growth is fueled by several key factors. The expansion of e-commerce and logistics industries necessitates efficient fleet management, boosting demand for telematics solutions in commercial vehicles. Furthermore, rising consumer demand for enhanced safety features, improved fuel efficiency, and convenient in-vehicle connectivity in passenger cars is another major driver. China, Japan, and South Korea are key contributors to this growth, with significant investments in smart city infrastructure and advanced driver-assistance systems (ADAS). However, high initial investment costs for telematics systems and concerns about data security and privacy remain potential restraints. The market segmentation reveals a significant share held by the commercial vehicle segment, particularly heavy-duty commercial vehicles, due to the substantial benefits offered in terms of operational efficiency and cost savings. The OEM channel currently dominates, but the aftermarket segment is witnessing strong growth, driven by the increasing affordability and availability of aftermarket telematics solutions.
Looking ahead to 2033, the APAC vehicle telematics market is poised for continued expansion. Factors such as the increasing penetration of smartphones and improved internet connectivity will further accelerate adoption. The integration of telematics with other technologies, like artificial intelligence (AI) and the Internet of Things (IoT), will create new opportunities for innovative solutions focused on predictive maintenance, advanced driver behavior analysis, and real-time traffic optimization. While challenges remain, strategic partnerships between technology providers, automakers, and telecommunication companies are expected to propel the market to even greater heights. The ongoing development of 5G networks will be particularly crucial in enhancing the capabilities and reliability of vehicle telematics systems across the region. This suggests a strong outlook for sustained growth, albeit with the need for addressing data privacy concerns and fostering public trust in the technology.
APAC Vehicle Telematics Industry Market Report: 2019-2033
This comprehensive report provides an in-depth analysis of the Asia-Pacific (APAC) vehicle telematics market, covering the period from 2019 to 2033. It delves into market dynamics, growth trends, dominant segments, key players, and future opportunities within this rapidly evolving sector. The report offers crucial insights for industry professionals, investors, and strategic decision-makers seeking to navigate the complexities and capitalize on the potential of the APAC vehicle telematics market. With a focus on parent markets like automotive and transportation, and child markets such as commercial and passenger vehicles, this report ensures a granular understanding of this booming industry.
APAC Vehicle Telematics Industry Market Dynamics & Structure
This section analyzes the competitive landscape, technological advancements, regulatory influences, and market trends shaping the APAC vehicle telematics industry. The market is characterized by a blend of established players and emerging innovators, leading to a dynamic competitive environment.
- Market Concentration: The APAC vehicle telematics market exhibits a moderately concentrated structure, with a few large players holding significant market share, while numerous smaller companies compete in niche segments. We estimate the top 5 players hold approximately xx% of the market share in 2025.
- Technological Innovation: Continuous innovation in areas like IoT, AI, and 5G is driving the adoption of advanced telematics solutions. Integration of these technologies is leading to enhanced data analytics, improved fleet management, and innovative driver assistance systems. However, integration complexities and high initial investment costs present barriers to wider adoption.
- Regulatory Frameworks: Government regulations concerning data privacy, cybersecurity, and vehicle safety are increasingly impacting the industry. Compliance with these regulations is crucial for market participation and is driving the adoption of secure telematics systems.
- Competitive Product Substitutes: While telematics offers unique functionalities, alternative solutions like traditional fleet management systems and paper-based logging methods exist, but are gradually becoming obsolete. The cost-effectiveness and efficiency of telematics are proving to be strong competitive advantages.
- End-User Demographics: The market is driven by a diverse range of end-users, including logistics companies, transportation fleets, passenger car owners, and government agencies. Growth is particularly strong in the commercial vehicle segment driven by increasing demand for efficiency and safety.
- M&A Trends: The APAC vehicle telematics industry has witnessed several mergers and acquisitions (M&A) in recent years, reflecting the strategic importance of this sector. The number of M&A deals averaged xx per year in the historical period (2019-2024).
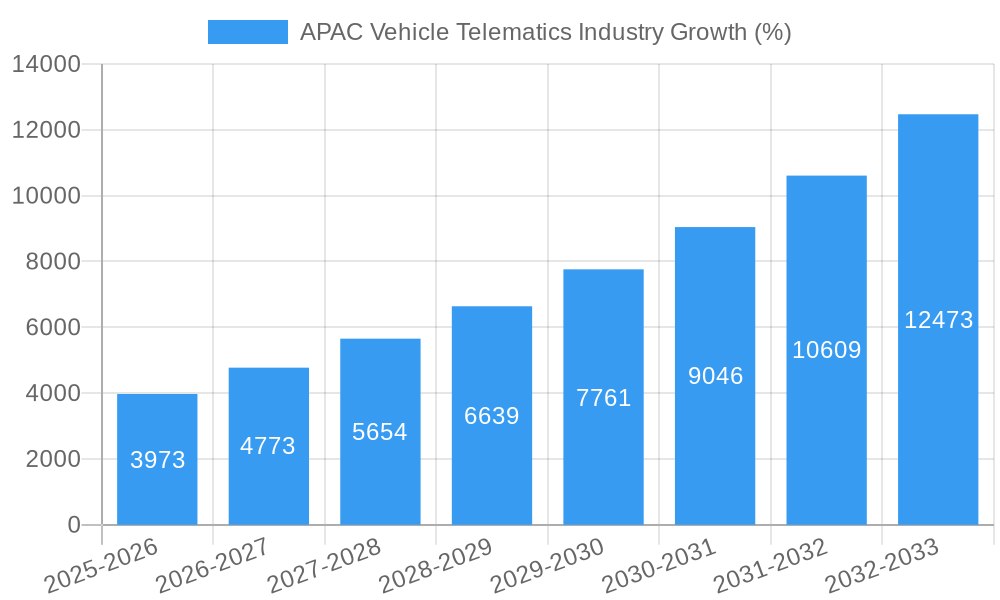
APAC Vehicle Telematics Industry Growth Trends & Insights
The APAC vehicle telematics market has experienced significant growth in recent years, fueled by increasing vehicle connectivity, stringent safety regulations, and the expanding adoption of IoT technologies. The market size is projected to reach xx million units by 2025 and further expand to xx million units by 2033.
The Compound Annual Growth Rate (CAGR) for the forecast period (2025-2033) is estimated at xx%. This growth is driven by factors such as:
- Rising demand for improved fleet management solutions across various sectors.
- Increasing government initiatives promoting the adoption of advanced driver-assistance systems (ADAS).
- Enhanced data analytics capabilities facilitating better decision-making for businesses.
- Growing awareness about vehicle safety and security among consumers and businesses.
- The proliferation of affordable and reliable telematics devices and services.
Dominant Regions, Countries, or Segments in APAP Vehicle Telematics Industry
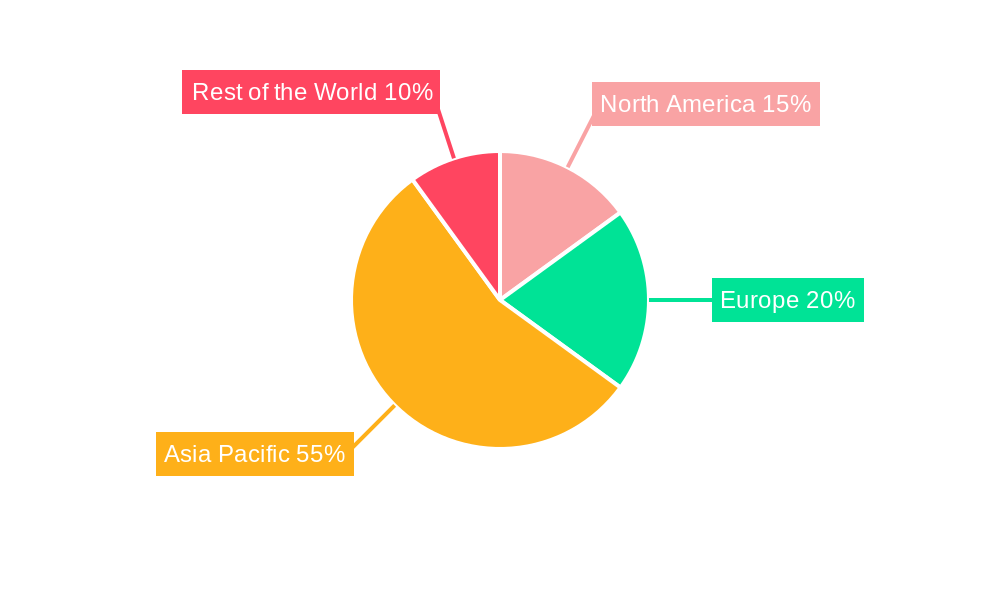
China is the dominant market in the APAC region, holding the largest market share due to its vast automotive market and supportive government policies. Other key countries include Japan, South Korea, and the Southeast Asian nations which are witnessing increasing adoption rates.
By Type of Vehicle:
- The commercial vehicle (truck) segment is the largest and fastest-growing segment, driven by the need for efficient fleet management and reduced operational costs. Within commercial vehicles, the Medium and Heavy Commercial Vehicle (M/HCV) segment shows higher growth potential compared to the Light Commercial Vehicle (LCV) segment. The passenger car segment is also experiencing significant growth, but at a slower pace compared to the commercial vehicle segment.
By Channel:
- The OEM (Original Equipment Manufacturer) channel is the largest, reflecting the increasing integration of telematics systems into new vehicles. The aftermarket channel is also growing rapidly, offering a diverse range of retrofittable solutions for existing vehicles. The newsprint channel maintains a niche presence.
By Country:
- China: Dominates the market due to its large vehicle population and substantial government investment in infrastructure and technological advancement.
- Japan: Characterized by high technological advancement and strong emphasis on safety and efficiency.
- South Korea: Demonstrates strong adoption of telematics technology in both commercial and passenger vehicles.
- Southeast Asia: Shows significant growth potential driven by rapid economic growth and rising vehicle ownership.
APAP Vehicle Telematics Industry Product Landscape
The APAP vehicle telematics market offers a diverse range of products, including GPS trackers, onboard diagnostic (OBD) devices, and advanced telematics systems. These products provide various functionalities, such as real-time vehicle tracking, driver behavior monitoring, fuel efficiency analysis, and remote diagnostics. Recent innovations focus on integrating advanced features like AI-powered predictive analytics and enhanced data security. These advancements enable more sophisticated fleet management, improved driver safety, and reduced operational costs for businesses. Unique selling propositions often center around specialized data analytics, seamless integration with existing fleet management systems, and user-friendly interfaces.
Key Drivers, Barriers & Challenges in APAC Vehicle Telematics Industry
Key Drivers:
- Increasing demand for efficient fleet management in various industries.
- Stringent government regulations mandating the use of telematics for safety and security.
- Technological advancements, particularly in IoT, AI, and 5G.
- Growing focus on reducing operational costs and improving fuel efficiency.
Key Barriers and Challenges:
- High initial investment costs associated with implementing telematics systems.
- Data security and privacy concerns.
- Lack of skilled workforce to manage and interpret telematics data.
- Interoperability issues among different telematics systems. This leads to fragmentation and increased complexity for businesses managing diverse fleets.
Emerging Opportunities in APAC Vehicle Telematics Industry
- Growing demand for telematics solutions in the two-wheeler and three-wheeler vehicle segment.
- Integration of telematics with other vehicle technologies, such as ADAS and autonomous driving systems.
- Expansion of telematics solutions into new industries, such as agriculture and construction.
- Development of value-added services, such as insurance telematics and predictive maintenance.
Growth Accelerators in the APAC Vehicle Telematics Industry
The long-term growth of the APAC vehicle telematics industry will be driven by continued technological advancements, strategic partnerships between telematics providers and OEMs, and expansion into untapped markets within the region. Government initiatives promoting the adoption of connected vehicles and improved infrastructure will further accelerate market growth.
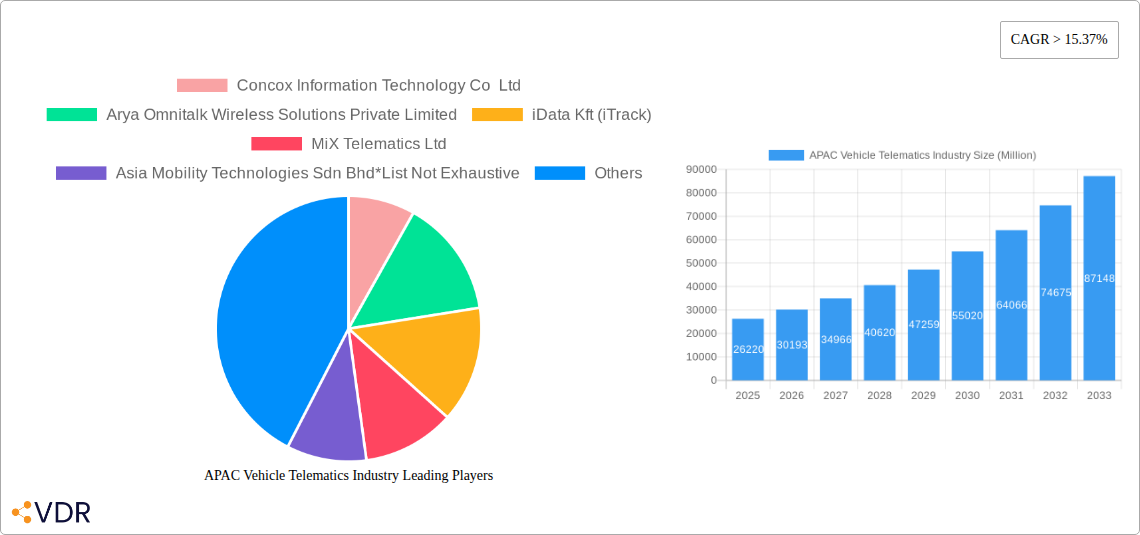
Key Players Shaping the APAC Vehicle Telematics Industry Market
- Concox Information Technology Co Ltd
- Arya Omnitalk Wireless Solutions Private Limited
- iData Kft (iTrack)
- MiX Telematics Ltd
- Asia Mobility Technologies Sdn Bhd
- Meitrack Group
- Tata Consultancy Services Ltd
- Bright Box Hungary Kft
- Trimble Inc
- Tech Mahindra Limited
- Efkon India Pvt Ltd
- LG Corporation
- Octo Group S p A
Notable Milestones in APAC Vehicle Telematics Industry Sector
- November 2022: Minda Corporation (Spark Minda Group) signed a technology license agreement with LocoNav for white-labelling telematics software, expanding OEM solutions.
- October 2022: Borq's Technologies launched a Telematics Control Unit (TCU) for two and three-wheelers in India, enabling connected vehicle features.
In-Depth APAC Vehicle Telematics Industry Market Outlook
The APAC vehicle telematics market holds significant future potential, driven by continuous technological innovation, increasing vehicle connectivity, and the expanding adoption of IoT technologies. Strategic partnerships, expansion into new segments (e.g., two-wheelers), and the development of value-added services will be key factors in shaping the market's future trajectory. The market presents substantial opportunities for both established players and new entrants, particularly those focusing on innovative solutions that address evolving customer needs and government regulations.
APAC Vehicle Telematics Industry Segmentation
-
1. Type of Vehicle
- 1.1. Commercial (Truck) LCV Vs. M/HCV
- 1.2. Passenger (Car)
-
2. Channel
- 2.1. OEM
- 2.2. Newsprint
- 2.3. Aftermarket
APAC Vehicle Telematics Industry Segmentation By Geography
-
1. North America
- 1.1. United States
- 1.2. Canada
- 1.3. Mexico
-
2. South America
- 2.1. Brazil
- 2.2. Argentina
- 2.3. Rest of South America
-
3. Europe
- 3.1. United Kingdom
- 3.2. Germany
- 3.3. France
- 3.4. Italy
- 3.5. Spain
- 3.6. Russia
- 3.7. Benelux
- 3.8. Nordics
- 3.9. Rest of Europe
-
4. Middle East & Africa
- 4.1. Turkey
- 4.2. Israel
- 4.3. GCC
- 4.4. North Africa
- 4.5. South Africa
- 4.6. Rest of Middle East & Africa
-
5. Asia Pacific
- 5.1. China
- 5.2. India
- 5.3. Japan
- 5.4. South Korea
- 5.5. ASEAN
- 5.6. Oceania
- 5.7. Rest of Asia Pacific
APAC Vehicle Telematics Industry REPORT HIGHLIGHTS
| Aspects | Details |
|---|---|
| Study Period | 2019-2033 |
| Base Year | 2024 |
| Estimated Year | 2025 |
| Forecast Period | 2025-2033 |
| Historical Period | 2019-2024 |
| Growth Rate | CAGR of > 15.37% from 2019-2033 |
| Segmentation |
|
Table of Contents
- 1. Introduction
- 1.1. Research Scope
- 1.2. Market Segmentation
- 1.3. Research Methodology
- 1.4. Definitions and Assumptions
- 2. Executive Summary
- 2.1. Introduction
- 3. Market Dynamics
- 3.1. Introduction
- 3.2. Market Drivers
- 3.2.1. Increasing Usage of Connected Cars Services; Growing Demand for Easy Vehicle Diagnostics
- 3.3. Market Restrains
- 3.3.1. Threats to Data Security in the form of Data Hacking
- 3.4. Market Trends
- 3.4.1. Passenger Type of Vehicles Segment is Expected to Hold Significant Market Share
- 4. Market Factor Analysis
- 4.1. Porters Five Forces
- 4.2. Supply/Value Chain
- 4.3. PESTEL analysis
- 4.4. Market Entropy
- 4.5. Patent/Trademark Analysis
- 5. Global APAC Vehicle Telematics Industry Analysis, Insights and Forecast, 2019-2031
- 5.1. Market Analysis, Insights and Forecast - by Type of Vehicle
- 5.1.1. Commercial (Truck) LCV Vs. M/HCV
- 5.1.2. Passenger (Car)
- 5.2. Market Analysis, Insights and Forecast - by Channel
- 5.2.1. OEM
- 5.2.2. Newsprint
- 5.2.3. Aftermarket
- 5.3. Market Analysis, Insights and Forecast - by Region
- 5.3.1. North America
- 5.3.2. South America
- 5.3.3. Europe
- 5.3.4. Middle East & Africa
- 5.3.5. Asia Pacific
- 5.1. Market Analysis, Insights and Forecast - by Type of Vehicle
- 6. North America APAC Vehicle Telematics Industry Analysis, Insights and Forecast, 2019-2031
- 6.1. Market Analysis, Insights and Forecast - by Type of Vehicle
- 6.1.1. Commercial (Truck) LCV Vs. M/HCV
- 6.1.2. Passenger (Car)
- 6.2. Market Analysis, Insights and Forecast - by Channel
- 6.2.1. OEM
- 6.2.2. Newsprint
- 6.2.3. Aftermarket
- 6.1. Market Analysis, Insights and Forecast - by Type of Vehicle
- 7. South America APAC Vehicle Telematics Industry Analysis, Insights and Forecast, 2019-2031
- 7.1. Market Analysis, Insights and Forecast - by Type of Vehicle
- 7.1.1. Commercial (Truck) LCV Vs. M/HCV
- 7.1.2. Passenger (Car)
- 7.2. Market Analysis, Insights and Forecast - by Channel
- 7.2.1. OEM
- 7.2.2. Newsprint
- 7.2.3. Aftermarket
- 7.1. Market Analysis, Insights and Forecast - by Type of Vehicle
- 8. Europe APAC Vehicle Telematics Industry Analysis, Insights and Forecast, 2019-2031
- 8.1. Market Analysis, Insights and Forecast - by Type of Vehicle
- 8.1.1. Commercial (Truck) LCV Vs. M/HCV
- 8.1.2. Passenger (Car)
- 8.2. Market Analysis, Insights and Forecast - by Channel
- 8.2.1. OEM
- 8.2.2. Newsprint
- 8.2.3. Aftermarket
- 8.1. Market Analysis, Insights and Forecast - by Type of Vehicle
- 9. Middle East & Africa APAC Vehicle Telematics Industry Analysis, Insights and Forecast, 2019-2031
- 9.1. Market Analysis, Insights and Forecast - by Type of Vehicle
- 9.1.1. Commercial (Truck) LCV Vs. M/HCV
- 9.1.2. Passenger (Car)
- 9.2. Market Analysis, Insights and Forecast - by Channel
- 9.2.1. OEM
- 9.2.2. Newsprint
- 9.2.3. Aftermarket
- 9.1. Market Analysis, Insights and Forecast - by Type of Vehicle
- 10. Asia Pacific APAC Vehicle Telematics Industry Analysis, Insights and Forecast, 2019-2031
- 10.1. Market Analysis, Insights and Forecast - by Type of Vehicle
- 10.1.1. Commercial (Truck) LCV Vs. M/HCV
- 10.1.2. Passenger (Car)
- 10.2. Market Analysis, Insights and Forecast - by Channel
- 10.2.1. OEM
- 10.2.2. Newsprint
- 10.2.3. Aftermarket
- 10.1. Market Analysis, Insights and Forecast - by Type of Vehicle
- 11. North America APAC Vehicle Telematics Industry Analysis, Insights and Forecast, 2019-2031
- 11.1. Market Analysis, Insights and Forecast - By Country/Sub-region
- 11.1.1.
- 12. Europe APAC Vehicle Telematics Industry Analysis, Insights and Forecast, 2019-2031
- 12.1. Market Analysis, Insights and Forecast - By Country/Sub-region
- 12.1.1.
- 13. Asia Pacific APAC Vehicle Telematics Industry Analysis, Insights and Forecast, 2019-2031
- 13.1. Market Analysis, Insights and Forecast - By Country/Sub-region
- 13.1.1.
- 14. Rest of the World APAC Vehicle Telematics Industry Analysis, Insights and Forecast, 2019-2031
- 14.1. Market Analysis, Insights and Forecast - By Country/Sub-region
- 14.1.1.
- 15. Competitive Analysis
- 15.1. Global Market Share Analysis 2024
- 15.2. Company Profiles
- 15.2.1 Concox Information Technology Co Ltd
- 15.2.1.1. Overview
- 15.2.1.2. Products
- 15.2.1.3. SWOT Analysis
- 15.2.1.4. Recent Developments
- 15.2.1.5. Financials (Based on Availability)
- 15.2.2 Arya Omnitalk Wireless Solutions Private Limited
- 15.2.2.1. Overview
- 15.2.2.2. Products
- 15.2.2.3. SWOT Analysis
- 15.2.2.4. Recent Developments
- 15.2.2.5. Financials (Based on Availability)
- 15.2.3 iData Kft (iTrack)
- 15.2.3.1. Overview
- 15.2.3.2. Products
- 15.2.3.3. SWOT Analysis
- 15.2.3.4. Recent Developments
- 15.2.3.5. Financials (Based on Availability)
- 15.2.4 MiX Telematics Ltd
- 15.2.4.1. Overview
- 15.2.4.2. Products
- 15.2.4.3. SWOT Analysis
- 15.2.4.4. Recent Developments
- 15.2.4.5. Financials (Based on Availability)
- 15.2.5 Asia Mobility Technologies Sdn Bhd*List Not Exhaustive
- 15.2.5.1. Overview
- 15.2.5.2. Products
- 15.2.5.3. SWOT Analysis
- 15.2.5.4. Recent Developments
- 15.2.5.5. Financials (Based on Availability)
- 15.2.6 Meitrack Group
- 15.2.6.1. Overview
- 15.2.6.2. Products
- 15.2.6.3. SWOT Analysis
- 15.2.6.4. Recent Developments
- 15.2.6.5. Financials (Based on Availability)
- 15.2.7 Tata Consultancy Services Ltd
- 15.2.7.1. Overview
- 15.2.7.2. Products
- 15.2.7.3. SWOT Analysis
- 15.2.7.4. Recent Developments
- 15.2.7.5. Financials (Based on Availability)
- 15.2.8 Bright Box Hungary Kft
- 15.2.8.1. Overview
- 15.2.8.2. Products
- 15.2.8.3. SWOT Analysis
- 15.2.8.4. Recent Developments
- 15.2.8.5. Financials (Based on Availability)
- 15.2.9 Trimble Inc
- 15.2.9.1. Overview
- 15.2.9.2. Products
- 15.2.9.3. SWOT Analysis
- 15.2.9.4. Recent Developments
- 15.2.9.5. Financials (Based on Availability)
- 15.2.10 Tech Mahindra Limited
- 15.2.10.1. Overview
- 15.2.10.2. Products
- 15.2.10.3. SWOT Analysis
- 15.2.10.4. Recent Developments
- 15.2.10.5. Financials (Based on Availability)
- 15.2.11 Efkon India Pvt Ltd
- 15.2.11.1. Overview
- 15.2.11.2. Products
- 15.2.11.3. SWOT Analysis
- 15.2.11.4. Recent Developments
- 15.2.11.5. Financials (Based on Availability)
- 15.2.12 LG Corporation
- 15.2.12.1. Overview
- 15.2.12.2. Products
- 15.2.12.3. SWOT Analysis
- 15.2.12.4. Recent Developments
- 15.2.12.5. Financials (Based on Availability)
- 15.2.13 Octo Group S p A
- 15.2.13.1. Overview
- 15.2.13.2. Products
- 15.2.13.3. SWOT Analysis
- 15.2.13.4. Recent Developments
- 15.2.13.5. Financials (Based on Availability)
- 15.2.1 Concox Information Technology Co Ltd
List of Figures
- Figure 1: Global APAC Vehicle Telematics Industry Revenue Breakdown (Million, %) by Region 2024 & 2032
- Figure 2: North America APAC Vehicle Telematics Industry Revenue (Million), by Country 2024 & 2032
- Figure 3: North America APAC Vehicle Telematics Industry Revenue Share (%), by Country 2024 & 2032
- Figure 4: Europe APAC Vehicle Telematics Industry Revenue (Million), by Country 2024 & 2032
- Figure 5: Europe APAC Vehicle Telematics Industry Revenue Share (%), by Country 2024 & 2032
- Figure 6: Asia Pacific APAC Vehicle Telematics Industry Revenue (Million), by Country 2024 & 2032
- Figure 7: Asia Pacific APAC Vehicle Telematics Industry Revenue Share (%), by Country 2024 & 2032
- Figure 8: Rest of the World APAC Vehicle Telematics Industry Revenue (Million), by Country 2024 & 2032
- Figure 9: Rest of the World APAC Vehicle Telematics Industry Revenue Share (%), by Country 2024 & 2032
- Figure 10: North America APAC Vehicle Telematics Industry Revenue (Million), by Type of Vehicle 2024 & 2032
- Figure 11: North America APAC Vehicle Telematics Industry Revenue Share (%), by Type of Vehicle 2024 & 2032
- Figure 12: North America APAC Vehicle Telematics Industry Revenue (Million), by Channel 2024 & 2032
- Figure 13: North America APAC Vehicle Telematics Industry Revenue Share (%), by Channel 2024 & 2032
- Figure 14: North America APAC Vehicle Telematics Industry Revenue (Million), by Country 2024 & 2032
- Figure 15: North America APAC Vehicle Telematics Industry Revenue Share (%), by Country 2024 & 2032
- Figure 16: South America APAC Vehicle Telematics Industry Revenue (Million), by Type of Vehicle 2024 & 2032
- Figure 17: South America APAC Vehicle Telematics Industry Revenue Share (%), by Type of Vehicle 2024 & 2032
- Figure 18: South America APAC Vehicle Telematics Industry Revenue (Million), by Channel 2024 & 2032
- Figure 19: South America APAC Vehicle Telematics Industry Revenue Share (%), by Channel 2024 & 2032
- Figure 20: South America APAC Vehicle Telematics Industry Revenue (Million), by Country 2024 & 2032
- Figure 21: South America APAC Vehicle Telematics Industry Revenue Share (%), by Country 2024 & 2032
- Figure 22: Europe APAC Vehicle Telematics Industry Revenue (Million), by Type of Vehicle 2024 & 2032
- Figure 23: Europe APAC Vehicle Telematics Industry Revenue Share (%), by Type of Vehicle 2024 & 2032
- Figure 24: Europe APAC Vehicle Telematics Industry Revenue (Million), by Channel 2024 & 2032
- Figure 25: Europe APAC Vehicle Telematics Industry Revenue Share (%), by Channel 2024 & 2032
- Figure 26: Europe APAC Vehicle Telematics Industry Revenue (Million), by Country 2024 & 2032
- Figure 27: Europe APAC Vehicle Telematics Industry Revenue Share (%), by Country 2024 & 2032
- Figure 28: Middle East & Africa APAC Vehicle Telematics Industry Revenue (Million), by Type of Vehicle 2024 & 2032
- Figure 29: Middle East & Africa APAC Vehicle Telematics Industry Revenue Share (%), by Type of Vehicle 2024 & 2032
- Figure 30: Middle East & Africa APAC Vehicle Telematics Industry Revenue (Million), by Channel 2024 & 2032
- Figure 31: Middle East & Africa APAC Vehicle Telematics Industry Revenue Share (%), by Channel 2024 & 2032
- Figure 32: Middle East & Africa APAC Vehicle Telematics Industry Revenue (Million), by Country 2024 & 2032
- Figure 33: Middle East & Africa APAC Vehicle Telematics Industry Revenue Share (%), by Country 2024 & 2032
- Figure 34: Asia Pacific APAC Vehicle Telematics Industry Revenue (Million), by Type of Vehicle 2024 & 2032
- Figure 35: Asia Pacific APAC Vehicle Telematics Industry Revenue Share (%), by Type of Vehicle 2024 & 2032
- Figure 36: Asia Pacific APAC Vehicle Telematics Industry Revenue (Million), by Channel 2024 & 2032
- Figure 37: Asia Pacific APAC Vehicle Telematics Industry Revenue Share (%), by Channel 2024 & 2032
- Figure 38: Asia Pacific APAC Vehicle Telematics Industry Revenue (Million), by Country 2024 & 2032
- Figure 39: Asia Pacific APAC Vehicle Telematics Industry Revenue Share (%), by Country 2024 & 2032
List of Tables
- Table 1: Global APAC Vehicle Telematics Industry Revenue Million Forecast, by Region 2019 & 2032
- Table 2: Global APAC Vehicle Telematics Industry Revenue Million Forecast, by Type of Vehicle 2019 & 2032
- Table 3: Global APAC Vehicle Telematics Industry Revenue Million Forecast, by Channel 2019 & 2032
- Table 4: Global APAC Vehicle Telematics Industry Revenue Million Forecast, by Region 2019 & 2032
- Table 5: Global APAC Vehicle Telematics Industry Revenue Million Forecast, by Country 2019 & 2032
- Table 6: APAC Vehicle Telematics Industry Revenue (Million) Forecast, by Application 2019 & 2032
- Table 7: Global APAC Vehicle Telematics Industry Revenue Million Forecast, by Country 2019 & 2032
- Table 8: APAC Vehicle Telematics Industry Revenue (Million) Forecast, by Application 2019 & 2032
- Table 9: Global APAC Vehicle Telematics Industry Revenue Million Forecast, by Country 2019 & 2032
- Table 10: APAC Vehicle Telematics Industry Revenue (Million) Forecast, by Application 2019 & 2032
- Table 11: Global APAC Vehicle Telematics Industry Revenue Million Forecast, by Country 2019 & 2032
- Table 12: APAC Vehicle Telematics Industry Revenue (Million) Forecast, by Application 2019 & 2032
- Table 13: Global APAC Vehicle Telematics Industry Revenue Million Forecast, by Type of Vehicle 2019 & 2032
- Table 14: Global APAC Vehicle Telematics Industry Revenue Million Forecast, by Channel 2019 & 2032
- Table 15: Global APAC Vehicle Telematics Industry Revenue Million Forecast, by Country 2019 & 2032
- Table 16: United States APAC Vehicle Telematics Industry Revenue (Million) Forecast, by Application 2019 & 2032
- Table 17: Canada APAC Vehicle Telematics Industry Revenue (Million) Forecast, by Application 2019 & 2032
- Table 18: Mexico APAC Vehicle Telematics Industry Revenue (Million) Forecast, by Application 2019 & 2032
- Table 19: Global APAC Vehicle Telematics Industry Revenue Million Forecast, by Type of Vehicle 2019 & 2032
- Table 20: Global APAC Vehicle Telematics Industry Revenue Million Forecast, by Channel 2019 & 2032
- Table 21: Global APAC Vehicle Telematics Industry Revenue Million Forecast, by Country 2019 & 2032
- Table 22: Brazil APAC Vehicle Telematics Industry Revenue (Million) Forecast, by Application 2019 & 2032
- Table 23: Argentina APAC Vehicle Telematics Industry Revenue (Million) Forecast, by Application 2019 & 2032
- Table 24: Rest of South America APAC Vehicle Telematics Industry Revenue (Million) Forecast, by Application 2019 & 2032
- Table 25: Global APAC Vehicle Telematics Industry Revenue Million Forecast, by Type of Vehicle 2019 & 2032
- Table 26: Global APAC Vehicle Telematics Industry Revenue Million Forecast, by Channel 2019 & 2032
- Table 27: Global APAC Vehicle Telematics Industry Revenue Million Forecast, by Country 2019 & 2032
- Table 28: United Kingdom APAC Vehicle Telematics Industry Revenue (Million) Forecast, by Application 2019 & 2032
- Table 29: Germany APAC Vehicle Telematics Industry Revenue (Million) Forecast, by Application 2019 & 2032
- Table 30: France APAC Vehicle Telematics Industry Revenue (Million) Forecast, by Application 2019 & 2032
- Table 31: Italy APAC Vehicle Telematics Industry Revenue (Million) Forecast, by Application 2019 & 2032
- Table 32: Spain APAC Vehicle Telematics Industry Revenue (Million) Forecast, by Application 2019 & 2032
- Table 33: Russia APAC Vehicle Telematics Industry Revenue (Million) Forecast, by Application 2019 & 2032
- Table 34: Benelux APAC Vehicle Telematics Industry Revenue (Million) Forecast, by Application 2019 & 2032
- Table 35: Nordics APAC Vehicle Telematics Industry Revenue (Million) Forecast, by Application 2019 & 2032
- Table 36: Rest of Europe APAC Vehicle Telematics Industry Revenue (Million) Forecast, by Application 2019 & 2032
- Table 37: Global APAC Vehicle Telematics Industry Revenue Million Forecast, by Type of Vehicle 2019 & 2032
- Table 38: Global APAC Vehicle Telematics Industry Revenue Million Forecast, by Channel 2019 & 2032
- Table 39: Global APAC Vehicle Telematics Industry Revenue Million Forecast, by Country 2019 & 2032
- Table 40: Turkey APAC Vehicle Telematics Industry Revenue (Million) Forecast, by Application 2019 & 2032
- Table 41: Israel APAC Vehicle Telematics Industry Revenue (Million) Forecast, by Application 2019 & 2032
- Table 42: GCC APAC Vehicle Telematics Industry Revenue (Million) Forecast, by Application 2019 & 2032
- Table 43: North Africa APAC Vehicle Telematics Industry Revenue (Million) Forecast, by Application 2019 & 2032
- Table 44: South Africa APAC Vehicle Telematics Industry Revenue (Million) Forecast, by Application 2019 & 2032
- Table 45: Rest of Middle East & Africa APAC Vehicle Telematics Industry Revenue (Million) Forecast, by Application 2019 & 2032
- Table 46: Global APAC Vehicle Telematics Industry Revenue Million Forecast, by Type of Vehicle 2019 & 2032
- Table 47: Global APAC Vehicle Telematics Industry Revenue Million Forecast, by Channel 2019 & 2032
- Table 48: Global APAC Vehicle Telematics Industry Revenue Million Forecast, by Country 2019 & 2032
- Table 49: China APAC Vehicle Telematics Industry Revenue (Million) Forecast, by Application 2019 & 2032
- Table 50: India APAC Vehicle Telematics Industry Revenue (Million) Forecast, by Application 2019 & 2032
- Table 51: Japan APAC Vehicle Telematics Industry Revenue (Million) Forecast, by Application 2019 & 2032
- Table 52: South Korea APAC Vehicle Telematics Industry Revenue (Million) Forecast, by Application 2019 & 2032
- Table 53: ASEAN APAC Vehicle Telematics Industry Revenue (Million) Forecast, by Application 2019 & 2032
- Table 54: Oceania APAC Vehicle Telematics Industry Revenue (Million) Forecast, by Application 2019 & 2032
- Table 55: Rest of Asia Pacific APAC Vehicle Telematics Industry Revenue (Million) Forecast, by Application 2019 & 2032
Frequently Asked Questions
1. What is the projected Compound Annual Growth Rate (CAGR) of the APAC Vehicle Telematics Industry?
The projected CAGR is approximately > 15.37%.
2. Which companies are prominent players in the APAC Vehicle Telematics Industry?
Key companies in the market include Concox Information Technology Co Ltd, Arya Omnitalk Wireless Solutions Private Limited, iData Kft (iTrack), MiX Telematics Ltd, Asia Mobility Technologies Sdn Bhd*List Not Exhaustive, Meitrack Group, Tata Consultancy Services Ltd, Bright Box Hungary Kft, Trimble Inc, Tech Mahindra Limited, Efkon India Pvt Ltd, LG Corporation, Octo Group S p A.
3. What are the main segments of the APAC Vehicle Telematics Industry?
The market segments include Type of Vehicle, Channel.
4. Can you provide details about the market size?
The market size is estimated to be USD 26.22 Million as of 2022.
5. What are some drivers contributing to market growth?
Increasing Usage of Connected Cars Services; Growing Demand for Easy Vehicle Diagnostics.
6. What are the notable trends driving market growth?
Passenger Type of Vehicles Segment is Expected to Hold Significant Market Share.
7. Are there any restraints impacting market growth?
Threats to Data Security in the form of Data Hacking.
8. Can you provide examples of recent developments in the market?
November 2022 - The flagship company of the Spark Minda group, Minda Corporation, entered into a technology license agreement with LocoNav for the white-labelling of telematics software. Through this collaboration, Spark Minda will combine software developed by LocoNav for its own telematic devices to offer Original Equipment Manufacturers (OEMs) a comprehensive solution.
9. What pricing options are available for accessing the report?
Pricing options include single-user, multi-user, and enterprise licenses priced at USD 4750, USD 4950, and USD 6800 respectively.
10. Is the market size provided in terms of value or volume?
The market size is provided in terms of value, measured in Million.
11. Are there any specific market keywords associated with the report?
Yes, the market keyword associated with the report is "APAC Vehicle Telematics Industry," which aids in identifying and referencing the specific market segment covered.
12. How do I determine which pricing option suits my needs best?
The pricing options vary based on user requirements and access needs. Individual users may opt for single-user licenses, while businesses requiring broader access may choose multi-user or enterprise licenses for cost-effective access to the report.
13. Are there any additional resources or data provided in the APAC Vehicle Telematics Industry report?
While the report offers comprehensive insights, it's advisable to review the specific contents or supplementary materials provided to ascertain if additional resources or data are available.
14. How can I stay updated on further developments or reports in the APAC Vehicle Telematics Industry?
To stay informed about further developments, trends, and reports in the APAC Vehicle Telematics Industry, consider subscribing to industry newsletters, following relevant companies and organizations, or regularly checking reputable industry news sources and publications.
Methodology
Step 1 - Identification of Relevant Samples Size from Population Database


Step 2 - Approaches for Defining Global Market Size (Value, Volume* & Price*)

Note*: In applicable scenarios
Step 3 - Data Sources
Primary Research
- Web Analytics
- Survey Reports
- Research Institute
- Latest Research Reports
- Opinion Leaders
Secondary Research
- Annual Reports
- White Paper
- Latest Press Release
- Industry Association
- Paid Database
- Investor Presentations

Step 4 - Data Triangulation
Involves using different sources of information in order to increase the validity of a study
These sources are likely to be stakeholders in a program - participants, other researchers, program staff, other community members, and so on.
Then we put all data in single framework & apply various statistical tools to find out the dynamic on the market.
During the analysis stage, feedback from the stakeholder groups would be compared to determine areas of agreement as well as areas of divergence


