
Key Insights
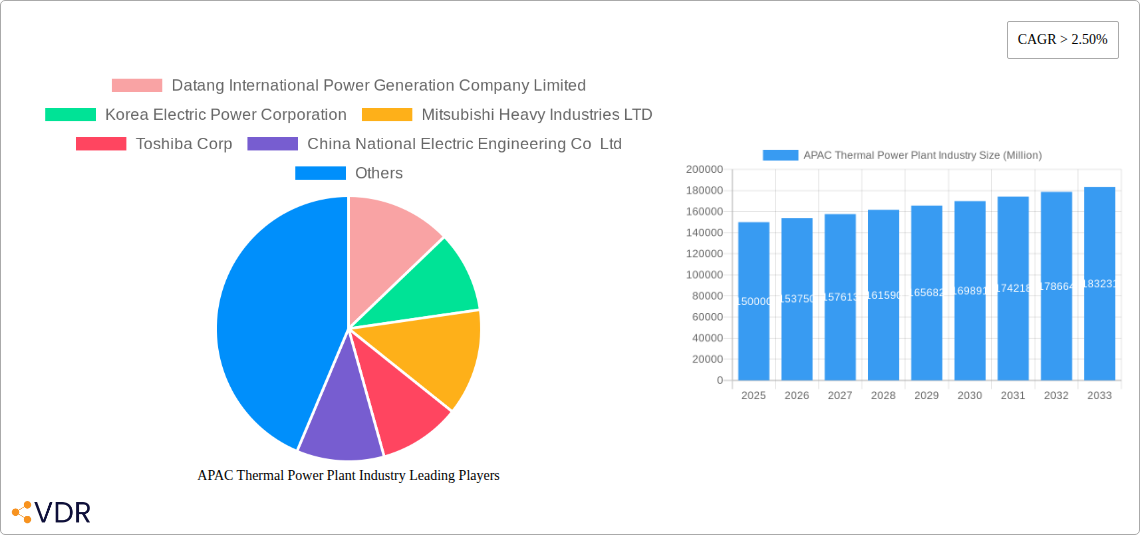
The Asia-Pacific (APAC) thermal power plant industry is experiencing robust growth, driven by increasing energy demand across rapidly developing economies like China, India, and Southeast Asia. The region's substantial population and industrialization efforts necessitate significant power generation capacity, fueling the demand for thermal power plants despite the rise of renewable energy sources. While a transition towards cleaner energy is underway, thermal power remains a cornerstone of the APAC energy mix, particularly coal and gas-fired plants, due to their established infrastructure and relatively lower initial investment costs. The market is fragmented, with several major players such as Datang International, Korea Electric Power Corporation, and Adani Group competing for market share. Government regulations aimed at reducing carbon emissions are creating challenges for the industry, promoting investment in technologies that improve efficiency and mitigate environmental impacts. The 2.50% CAGR suggests consistent, if moderate, expansion, indicating a stable, though evolving, market landscape. This growth is further supported by ongoing infrastructure development projects across the region, particularly in nations experiencing rapid economic expansion.
Technological advancements in thermal power generation are also shaping the market. Improved efficiency technologies, including supercritical and ultra-supercritical power plants, are gaining traction, leading to reduced fuel consumption and emissions. This, coupled with ongoing investments in carbon capture and storage (CCS) technologies, will influence the market's future trajectory. However, challenges remain, including the volatility of fuel prices, the increasing costs of complying with environmental regulations, and the growing competition from renewable energy sources. The forecast period (2025-2033) indicates a continued positive outlook for the APAC thermal power plant industry, albeit with a slower growth trajectory compared to the recent past, as the market gradually shifts towards a more sustainable energy mix. Market segmentation by fuel type reveals coal and gas continue to dominate, highlighting the need for continued technological innovation to reduce environmental impact and improve overall industry sustainability.
This comprehensive report provides an in-depth analysis of the Asia-Pacific (APAC) thermal power plant industry, encompassing market dynamics, growth trends, key players, and future outlook. The study period covers 2019-2033, with a base year of 2025 and a forecast period of 2025-2033. This report is crucial for investors, industry professionals, and policymakers seeking a nuanced understanding of this vital energy sector.
APAC Thermal Power Plant Industry Market Dynamics & Structure
The APAC thermal power plant market is a dynamic landscape shaped by a complex interplay of factors. Market concentration is moderate, with a few large players like Datang International Power Generation Company Limited, Korea Electric Power Corporation, and Mitsubishi Heavy Industries LTD holding significant shares, but numerous smaller players also contribute substantially. Technological innovation, driven by efficiency improvements and emission reduction targets, is a major driver. Stringent regulatory frameworks, varying across countries, significantly influence investment decisions and operational practices. The rise of renewable energy sources presents a competitive threat, acting as a substitute for thermal power in some applications. End-user demographics, primarily driven by industrial and residential electricity demand, play a pivotal role. M&A activity is moderately frequent, consolidating market share and fostering technological synergy.
- Market Concentration: Moderate, with top 5 players holding xx% market share in 2025.
- Technological Innovation: Focus on higher efficiency, cleaner fuels, and digitalization.
- Regulatory Landscape: Varies significantly across APAC nations, impacting investment decisions.
- Competitive Substitutes: Renewable energy sources (solar, wind, hydro) pose increasing competition.
- End-User Demographics: Primarily driven by industrial and residential electricity demand, with xx% attributed to industrial use in 2025.
- M&A Activity: xx deals recorded between 2019 and 2024, with an estimated xx Million USD total value.
APAC Thermal Power Plant Industry Growth Trends & Insights
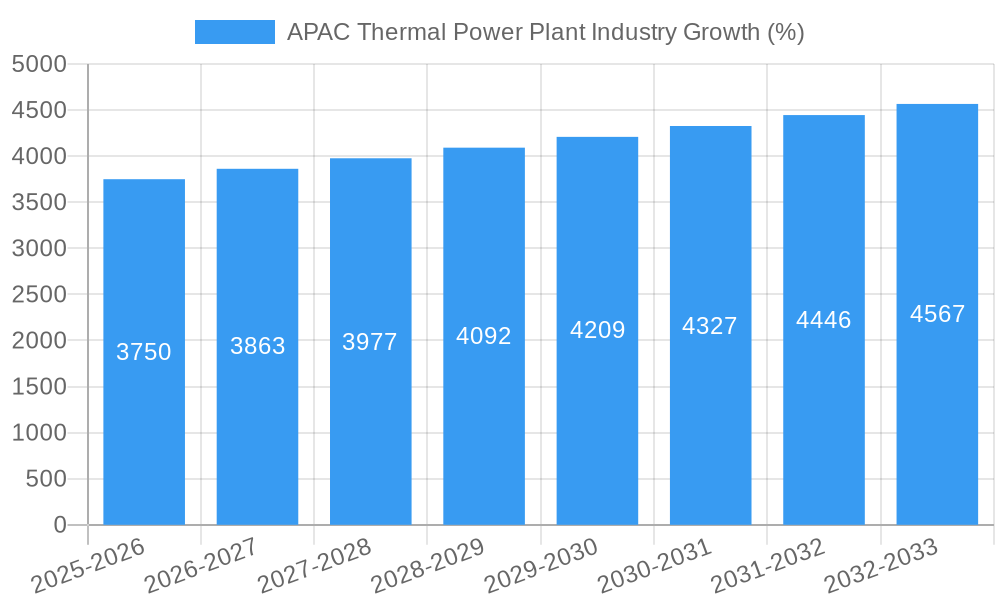
The APAC thermal power plant market experienced a Compound Annual Growth Rate (CAGR) of xx% during the historical period (2019-2024). This growth was primarily fueled by rising energy demand in rapidly developing economies. However, the adoption rate of new technologies, particularly those focused on emission reduction, is slower than expected due to high initial investment costs and technological barriers. While consumer behavior shifts towards greater environmental awareness are impacting the industry, the overall demand for electricity continues to rise, particularly in emerging markets. The market size is projected to reach xx Million USD in 2025, with a forecasted CAGR of xx% during 2025-2033. Technological disruptions, particularly in the area of gas turbine technology and carbon capture, are expected to influence the market trajectory significantly. Further insights demonstrate a clear market segmentation based on fuel type and geographical location. Market penetration of cleaner fuels is slowly increasing but faces challenges due to infrastructure limitations and cost factors.
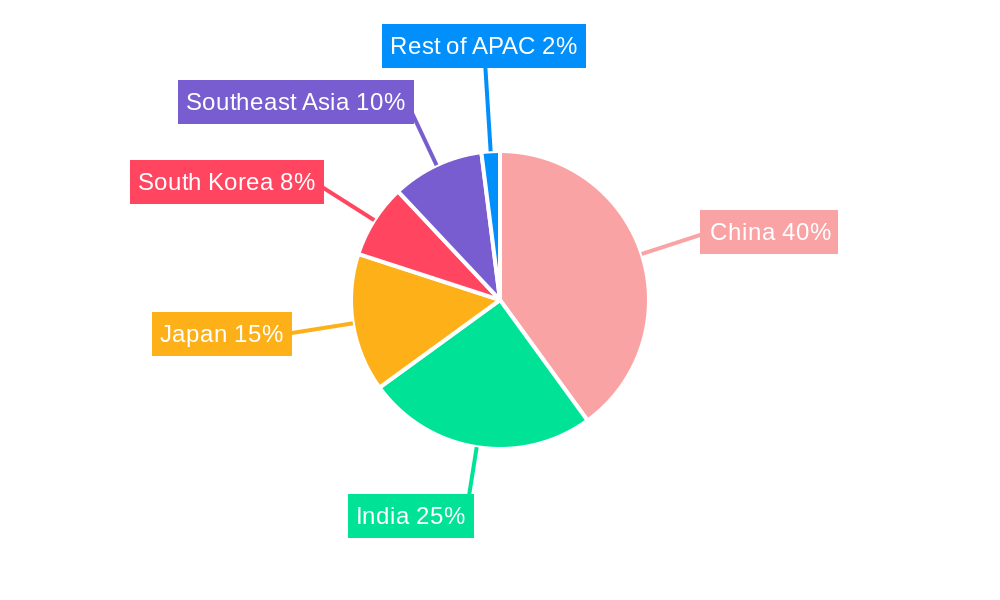
Dominant Regions, Countries, or Segments in APAC Thermal Power Plant Industry
China and India are the dominant markets within APAC, accounting for xx% and xx% of the total market share in 2025 respectively. The Coal segment remains the largest fuel type, contributing xx% of the overall capacity in 2025, primarily driven by China’s large coal reserves and existing infrastructure. However, the Gas segment is experiencing faster growth, with a projected CAGR of xx% during 2025-2033, fuelled by increased investment in combined-cycle power plants and government incentives for cleaner fuels. The Nuclear segment, while smaller, is expected to witness steady growth due to planned expansions and new plant constructions like the Fuqing plant.
- Key Drivers (China): Strong industrial growth, large coal reserves, government support for thermal power.
- Key Drivers (India): Rapid economic growth, rising electricity demand, significant investments in power infrastructure.
- Fuel Type Dominance: Coal (largest market share), followed by Gas (fastest growth), and Nuclear (steady growth).
- Growth Potential: Gas and Nuclear segments offer the highest growth potential, with significant investment and policy support.
APAP Thermal Power Plant Industry Product Landscape
The product landscape is characterized by advancements in gas turbine technology, leading to increased efficiency and reduced emissions. Combined-cycle power plants with improved heat recovery systems are gaining traction, boosting overall plant efficiency. Furthermore, innovations in coal-fired power plants are focusing on carbon capture and storage (CCS) technologies to mitigate environmental impacts. These advancements highlight a strong push towards improved performance metrics, including higher efficiency, lower emissions, and greater reliability.
Key Drivers, Barriers & Challenges in APAC Thermal Power Plant Industry
Key Drivers: Rising energy demand driven by economic growth and population increase; government investments in power infrastructure; technological advancements in efficiency and emissions reduction.
Challenges: High initial investment costs for new plants and technology upgrades; environmental concerns and stricter emission regulations; competition from renewable energy sources; supply chain disruptions leading to increased material and equipment costs (estimated impact of xx% on overall project costs).
Emerging Opportunities in APAP Thermal Power Plant Industry
Emerging opportunities lie in the adoption of advanced gas turbines, increased focus on carbon capture and storage (CCS) technologies, integration of renewable energy sources into hybrid power plants, and the development of smaller, modular power plants for remote areas. Furthermore, exploring untapped markets in less developed regions and providing reliable power to underserved communities presents significant growth potential.
Growth Accelerators in the APAC Thermal Power Plant Industry Industry
Technological breakthroughs, particularly in gas turbine and CCS technologies, are pivotal growth drivers. Strategic partnerships between technology providers and power plant operators facilitate technology adoption and project implementation. Government policies supporting cleaner energy and improved infrastructure significantly enhance the market's growth trajectory. Expansion strategies focused on emerging markets and underserved areas further propel market development.
Key Players Shaping the APAC Thermal Power Plant Industry Market
- Datang International Power Generation Company Limited
- Korea Electric Power Corporation
- Mitsubishi Heavy Industries LTD
- Toshiba Corp
- China National Electric Engineering Co Ltd
- China Energy Engineering Corporation (CEEC)
- Adani Group
- NTPC Limited
- Tata Group
- Tokyo Electric Power Company Holdings Inc
Notable Milestones in APAC Thermal Power Plant Industry Sector
- March 2022: Harbin Electric and GE Gas Power secured a significant order for power generation equipment from Shenzhen Energy Group for the Guangming combined-cycle power plant in Guangdong province, China. This highlights the growth in the gas-fired power segment.
- January 2022: The connection of unit 6 at CNNC's Fuqing nuclear power plant to the grid showcases ongoing advancements in nuclear power technology within APAC.
In-Depth APAC Thermal Power Plant Industry Market Outlook
The APAC thermal power plant market is poised for continued growth, driven by the region’s robust economic development and increasing energy demand. While renewable energy sources are gaining traction, thermal power will remain a crucial part of the energy mix, particularly in the short to medium term. Strategic investments in efficient and clean technologies, coupled with supportive government policies, will shape the future of the industry. The focus on sustainability and emission reduction presents lucrative opportunities for innovative players. The market holds significant potential for growth, particularly in emerging economies and regions experiencing rapid industrialization.
APAC Thermal Power Plant Industry Segmentation
-
1. Fuel Type
- 1.1. Coal
- 1.2. Gas
- 1.3. Nuclear
- 1.4. Other Fuel Types
-
2. Geography
- 2.1. China
- 2.2. India
- 2.3. Japan
- 2.4. Rest of Asia-Pacific
APAC Thermal Power Plant Industry Segmentation By Geography
- 1. China
- 2. India
- 3. Japan
- 4. Rest of Asia Pacific
APAC Thermal Power Plant Industry REPORT HIGHLIGHTS
| Aspects | Details |
|---|---|
| Study Period | 2019-2033 |
| Base Year | 2024 |
| Estimated Year | 2025 |
| Forecast Period | 2025-2033 |
| Historical Period | 2019-2024 |
| Growth Rate | CAGR of > 2.50% from 2019-2033 |
| Segmentation |
|
Table of Contents
- 1. Introduction
- 1.1. Research Scope
- 1.2. Market Segmentation
- 1.3. Research Methodology
- 1.4. Definitions and Assumptions
- 2. Executive Summary
- 2.1. Introduction
- 3. Market Dynamics
- 3.1. Introduction
- 3.2. Market Drivers
- 3.2.1. 4.; Increasing Power Generation Capacity Plans and Increasing Electricity Demand4.; Rapidly Growing Industrial and Infrastructural Development Activities
- 3.3. Market Restrains
- 3.3.1. 4.; Coal Substituted with Clean Energy Sources
- 3.4. Market Trends
- 3.4.1. Coal Segment Expected to Dominate the Market
- 4. Market Factor Analysis
- 4.1. Porters Five Forces
- 4.2. Supply/Value Chain
- 4.3. PESTEL analysis
- 4.4. Market Entropy
- 4.5. Patent/Trademark Analysis
- 5. Global APAC Thermal Power Plant Industry Analysis, Insights and Forecast, 2019-2031
- 5.1. Market Analysis, Insights and Forecast - by Fuel Type
- 5.1.1. Coal
- 5.1.2. Gas
- 5.1.3. Nuclear
- 5.1.4. Other Fuel Types
- 5.2. Market Analysis, Insights and Forecast - by Geography
- 5.2.1. China
- 5.2.2. India
- 5.2.3. Japan
- 5.2.4. Rest of Asia-Pacific
- 5.3. Market Analysis, Insights and Forecast - by Region
- 5.3.1. China
- 5.3.2. India
- 5.3.3. Japan
- 5.3.4. Rest of Asia Pacific
- 5.1. Market Analysis, Insights and Forecast - by Fuel Type
- 6. China APAC Thermal Power Plant Industry Analysis, Insights and Forecast, 2019-2031
- 6.1. Market Analysis, Insights and Forecast - by Fuel Type
- 6.1.1. Coal
- 6.1.2. Gas
- 6.1.3. Nuclear
- 6.1.4. Other Fuel Types
- 6.2. Market Analysis, Insights and Forecast - by Geography
- 6.2.1. China
- 6.2.2. India
- 6.2.3. Japan
- 6.2.4. Rest of Asia-Pacific
- 6.1. Market Analysis, Insights and Forecast - by Fuel Type
- 7. India APAC Thermal Power Plant Industry Analysis, Insights and Forecast, 2019-2031
- 7.1. Market Analysis, Insights and Forecast - by Fuel Type
- 7.1.1. Coal
- 7.1.2. Gas
- 7.1.3. Nuclear
- 7.1.4. Other Fuel Types
- 7.2. Market Analysis, Insights and Forecast - by Geography
- 7.2.1. China
- 7.2.2. India
- 7.2.3. Japan
- 7.2.4. Rest of Asia-Pacific
- 7.1. Market Analysis, Insights and Forecast - by Fuel Type
- 8. Japan APAC Thermal Power Plant Industry Analysis, Insights and Forecast, 2019-2031
- 8.1. Market Analysis, Insights and Forecast - by Fuel Type
- 8.1.1. Coal
- 8.1.2. Gas
- 8.1.3. Nuclear
- 8.1.4. Other Fuel Types
- 8.2. Market Analysis, Insights and Forecast - by Geography
- 8.2.1. China
- 8.2.2. India
- 8.2.3. Japan
- 8.2.4. Rest of Asia-Pacific
- 8.1. Market Analysis, Insights and Forecast - by Fuel Type
- 9. Rest of Asia Pacific APAC Thermal Power Plant Industry Analysis, Insights and Forecast, 2019-2031
- 9.1. Market Analysis, Insights and Forecast - by Fuel Type
- 9.1.1. Coal
- 9.1.2. Gas
- 9.1.3. Nuclear
- 9.1.4. Other Fuel Types
- 9.2. Market Analysis, Insights and Forecast - by Geography
- 9.2.1. China
- 9.2.2. India
- 9.2.3. Japan
- 9.2.4. Rest of Asia-Pacific
- 9.1. Market Analysis, Insights and Forecast - by Fuel Type
- 10. China APAC Thermal Power Plant Industry Analysis, Insights and Forecast, 2019-2031
- 11. Japan APAC Thermal Power Plant Industry Analysis, Insights and Forecast, 2019-2031
- 12. India APAC Thermal Power Plant Industry Analysis, Insights and Forecast, 2019-2031
- 13. South Korea APAC Thermal Power Plant Industry Analysis, Insights and Forecast, 2019-2031
- 14. Southeast Asia APAC Thermal Power Plant Industry Analysis, Insights and Forecast, 2019-2031
- 15. Australia APAC Thermal Power Plant Industry Analysis, Insights and Forecast, 2019-2031
- 16. Indonesia APAC Thermal Power Plant Industry Analysis, Insights and Forecast, 2019-2031
- 17. Phillipes APAC Thermal Power Plant Industry Analysis, Insights and Forecast, 2019-2031
- 18. Singapore APAC Thermal Power Plant Industry Analysis, Insights and Forecast, 2019-2031
- 19. Thailandc APAC Thermal Power Plant Industry Analysis, Insights and Forecast, 2019-2031
- 20. Rest of Asia Pacific APAC Thermal Power Plant Industry Analysis, Insights and Forecast, 2019-2031
- 21. Competitive Analysis
- 21.1. Global Market Share Analysis 2024
- 21.2. Company Profiles
- 21.2.1 Datang International Power Generation Company Limited
- 21.2.1.1. Overview
- 21.2.1.2. Products
- 21.2.1.3. SWOT Analysis
- 21.2.1.4. Recent Developments
- 21.2.1.5. Financials (Based on Availability)
- 21.2.2 Korea Electric Power Corporation
- 21.2.2.1. Overview
- 21.2.2.2. Products
- 21.2.2.3. SWOT Analysis
- 21.2.2.4. Recent Developments
- 21.2.2.5. Financials (Based on Availability)
- 21.2.3 Mitsubishi Heavy Industries LTD
- 21.2.3.1. Overview
- 21.2.3.2. Products
- 21.2.3.3. SWOT Analysis
- 21.2.3.4. Recent Developments
- 21.2.3.5. Financials (Based on Availability)
- 21.2.4 Toshiba Corp
- 21.2.4.1. Overview
- 21.2.4.2. Products
- 21.2.4.3. SWOT Analysis
- 21.2.4.4. Recent Developments
- 21.2.4.5. Financials (Based on Availability)
- 21.2.5 China National Electric Engineering Co Ltd
- 21.2.5.1. Overview
- 21.2.5.2. Products
- 21.2.5.3. SWOT Analysis
- 21.2.5.4. Recent Developments
- 21.2.5.5. Financials (Based on Availability)
- 21.2.6 China Energy Engineering Corporation (CEEC)
- 21.2.6.1. Overview
- 21.2.6.2. Products
- 21.2.6.3. SWOT Analysis
- 21.2.6.4. Recent Developments
- 21.2.6.5. Financials (Based on Availability)
- 21.2.7 Adani Group
- 21.2.7.1. Overview
- 21.2.7.2. Products
- 21.2.7.3. SWOT Analysis
- 21.2.7.4. Recent Developments
- 21.2.7.5. Financials (Based on Availability)
- 21.2.8 NTPC Limited
- 21.2.8.1. Overview
- 21.2.8.2. Products
- 21.2.8.3. SWOT Analysis
- 21.2.8.4. Recent Developments
- 21.2.8.5. Financials (Based on Availability)
- 21.2.9 Tata Group
- 21.2.9.1. Overview
- 21.2.9.2. Products
- 21.2.9.3. SWOT Analysis
- 21.2.9.4. Recent Developments
- 21.2.9.5. Financials (Based on Availability)
- 21.2.10 Tokyo Electric Power Company Holdings Inc
- 21.2.10.1. Overview
- 21.2.10.2. Products
- 21.2.10.3. SWOT Analysis
- 21.2.10.4. Recent Developments
- 21.2.10.5. Financials (Based on Availability)
- 21.2.1 Datang International Power Generation Company Limited
List of Figures
- Figure 1: Global APAC Thermal Power Plant Industry Revenue Breakdown (Million, %) by Region 2024 & 2032
- Figure 2: Global APAC Thermal Power Plant Industry Volume Breakdown (Gigawatt, %) by Region 2024 & 2032
- Figure 3: Asia Pacific APAC Thermal Power Plant Industry Revenue (Million), by Country 2024 & 2032
- Figure 4: Asia Pacific APAC Thermal Power Plant Industry Volume (Gigawatt), by Country 2024 & 2032
- Figure 5: Asia Pacific APAC Thermal Power Plant Industry Revenue Share (%), by Country 2024 & 2032
- Figure 6: Asia Pacific APAC Thermal Power Plant Industry Volume Share (%), by Country 2024 & 2032
- Figure 7: China APAC Thermal Power Plant Industry Revenue (Million), by Fuel Type 2024 & 2032
- Figure 8: China APAC Thermal Power Plant Industry Volume (Gigawatt), by Fuel Type 2024 & 2032
- Figure 9: China APAC Thermal Power Plant Industry Revenue Share (%), by Fuel Type 2024 & 2032
- Figure 10: China APAC Thermal Power Plant Industry Volume Share (%), by Fuel Type 2024 & 2032
- Figure 11: China APAC Thermal Power Plant Industry Revenue (Million), by Geography 2024 & 2032
- Figure 12: China APAC Thermal Power Plant Industry Volume (Gigawatt), by Geography 2024 & 2032
- Figure 13: China APAC Thermal Power Plant Industry Revenue Share (%), by Geography 2024 & 2032
- Figure 14: China APAC Thermal Power Plant Industry Volume Share (%), by Geography 2024 & 2032
- Figure 15: China APAC Thermal Power Plant Industry Revenue (Million), by Country 2024 & 2032
- Figure 16: China APAC Thermal Power Plant Industry Volume (Gigawatt), by Country 2024 & 2032
- Figure 17: China APAC Thermal Power Plant Industry Revenue Share (%), by Country 2024 & 2032
- Figure 18: China APAC Thermal Power Plant Industry Volume Share (%), by Country 2024 & 2032
- Figure 19: India APAC Thermal Power Plant Industry Revenue (Million), by Fuel Type 2024 & 2032
- Figure 20: India APAC Thermal Power Plant Industry Volume (Gigawatt), by Fuel Type 2024 & 2032
- Figure 21: India APAC Thermal Power Plant Industry Revenue Share (%), by Fuel Type 2024 & 2032
- Figure 22: India APAC Thermal Power Plant Industry Volume Share (%), by Fuel Type 2024 & 2032
- Figure 23: India APAC Thermal Power Plant Industry Revenue (Million), by Geography 2024 & 2032
- Figure 24: India APAC Thermal Power Plant Industry Volume (Gigawatt), by Geography 2024 & 2032
- Figure 25: India APAC Thermal Power Plant Industry Revenue Share (%), by Geography 2024 & 2032
- Figure 26: India APAC Thermal Power Plant Industry Volume Share (%), by Geography 2024 & 2032
- Figure 27: India APAC Thermal Power Plant Industry Revenue (Million), by Country 2024 & 2032
- Figure 28: India APAC Thermal Power Plant Industry Volume (Gigawatt), by Country 2024 & 2032
- Figure 29: India APAC Thermal Power Plant Industry Revenue Share (%), by Country 2024 & 2032
- Figure 30: India APAC Thermal Power Plant Industry Volume Share (%), by Country 2024 & 2032
- Figure 31: Japan APAC Thermal Power Plant Industry Revenue (Million), by Fuel Type 2024 & 2032
- Figure 32: Japan APAC Thermal Power Plant Industry Volume (Gigawatt), by Fuel Type 2024 & 2032
- Figure 33: Japan APAC Thermal Power Plant Industry Revenue Share (%), by Fuel Type 2024 & 2032
- Figure 34: Japan APAC Thermal Power Plant Industry Volume Share (%), by Fuel Type 2024 & 2032
- Figure 35: Japan APAC Thermal Power Plant Industry Revenue (Million), by Geography 2024 & 2032
- Figure 36: Japan APAC Thermal Power Plant Industry Volume (Gigawatt), by Geography 2024 & 2032
- Figure 37: Japan APAC Thermal Power Plant Industry Revenue Share (%), by Geography 2024 & 2032
- Figure 38: Japan APAC Thermal Power Plant Industry Volume Share (%), by Geography 2024 & 2032
- Figure 39: Japan APAC Thermal Power Plant Industry Revenue (Million), by Country 2024 & 2032
- Figure 40: Japan APAC Thermal Power Plant Industry Volume (Gigawatt), by Country 2024 & 2032
- Figure 41: Japan APAC Thermal Power Plant Industry Revenue Share (%), by Country 2024 & 2032
- Figure 42: Japan APAC Thermal Power Plant Industry Volume Share (%), by Country 2024 & 2032
- Figure 43: Rest of Asia Pacific APAC Thermal Power Plant Industry Revenue (Million), by Fuel Type 2024 & 2032
- Figure 44: Rest of Asia Pacific APAC Thermal Power Plant Industry Volume (Gigawatt), by Fuel Type 2024 & 2032
- Figure 45: Rest of Asia Pacific APAC Thermal Power Plant Industry Revenue Share (%), by Fuel Type 2024 & 2032
- Figure 46: Rest of Asia Pacific APAC Thermal Power Plant Industry Volume Share (%), by Fuel Type 2024 & 2032
- Figure 47: Rest of Asia Pacific APAC Thermal Power Plant Industry Revenue (Million), by Geography 2024 & 2032
- Figure 48: Rest of Asia Pacific APAC Thermal Power Plant Industry Volume (Gigawatt), by Geography 2024 & 2032
- Figure 49: Rest of Asia Pacific APAC Thermal Power Plant Industry Revenue Share (%), by Geography 2024 & 2032
- Figure 50: Rest of Asia Pacific APAC Thermal Power Plant Industry Volume Share (%), by Geography 2024 & 2032
- Figure 51: Rest of Asia Pacific APAC Thermal Power Plant Industry Revenue (Million), by Country 2024 & 2032
- Figure 52: Rest of Asia Pacific APAC Thermal Power Plant Industry Volume (Gigawatt), by Country 2024 & 2032
- Figure 53: Rest of Asia Pacific APAC Thermal Power Plant Industry Revenue Share (%), by Country 2024 & 2032
- Figure 54: Rest of Asia Pacific APAC Thermal Power Plant Industry Volume Share (%), by Country 2024 & 2032
List of Tables
- Table 1: Global APAC Thermal Power Plant Industry Revenue Million Forecast, by Region 2019 & 2032
- Table 2: Global APAC Thermal Power Plant Industry Volume Gigawatt Forecast, by Region 2019 & 2032
- Table 3: Global APAC Thermal Power Plant Industry Revenue Million Forecast, by Fuel Type 2019 & 2032
- Table 4: Global APAC Thermal Power Plant Industry Volume Gigawatt Forecast, by Fuel Type 2019 & 2032
- Table 5: Global APAC Thermal Power Plant Industry Revenue Million Forecast, by Geography 2019 & 2032
- Table 6: Global APAC Thermal Power Plant Industry Volume Gigawatt Forecast, by Geography 2019 & 2032
- Table 7: Global APAC Thermal Power Plant Industry Revenue Million Forecast, by Region 2019 & 2032
- Table 8: Global APAC Thermal Power Plant Industry Volume Gigawatt Forecast, by Region 2019 & 2032
- Table 9: Global APAC Thermal Power Plant Industry Revenue Million Forecast, by Country 2019 & 2032
- Table 10: Global APAC Thermal Power Plant Industry Volume Gigawatt Forecast, by Country 2019 & 2032
- Table 11: China APAC Thermal Power Plant Industry Revenue (Million) Forecast, by Application 2019 & 2032
- Table 12: China APAC Thermal Power Plant Industry Volume (Gigawatt) Forecast, by Application 2019 & 2032
- Table 13: Japan APAC Thermal Power Plant Industry Revenue (Million) Forecast, by Application 2019 & 2032
- Table 14: Japan APAC Thermal Power Plant Industry Volume (Gigawatt) Forecast, by Application 2019 & 2032
- Table 15: India APAC Thermal Power Plant Industry Revenue (Million) Forecast, by Application 2019 & 2032
- Table 16: India APAC Thermal Power Plant Industry Volume (Gigawatt) Forecast, by Application 2019 & 2032
- Table 17: South Korea APAC Thermal Power Plant Industry Revenue (Million) Forecast, by Application 2019 & 2032
- Table 18: South Korea APAC Thermal Power Plant Industry Volume (Gigawatt) Forecast, by Application 2019 & 2032
- Table 19: Southeast Asia APAC Thermal Power Plant Industry Revenue (Million) Forecast, by Application 2019 & 2032
- Table 20: Southeast Asia APAC Thermal Power Plant Industry Volume (Gigawatt) Forecast, by Application 2019 & 2032
- Table 21: Australia APAC Thermal Power Plant Industry Revenue (Million) Forecast, by Application 2019 & 2032
- Table 22: Australia APAC Thermal Power Plant Industry Volume (Gigawatt) Forecast, by Application 2019 & 2032
- Table 23: Indonesia APAC Thermal Power Plant Industry Revenue (Million) Forecast, by Application 2019 & 2032
- Table 24: Indonesia APAC Thermal Power Plant Industry Volume (Gigawatt) Forecast, by Application 2019 & 2032
- Table 25: Phillipes APAC Thermal Power Plant Industry Revenue (Million) Forecast, by Application 2019 & 2032
- Table 26: Phillipes APAC Thermal Power Plant Industry Volume (Gigawatt) Forecast, by Application 2019 & 2032
- Table 27: Singapore APAC Thermal Power Plant Industry Revenue (Million) Forecast, by Application 2019 & 2032
- Table 28: Singapore APAC Thermal Power Plant Industry Volume (Gigawatt) Forecast, by Application 2019 & 2032
- Table 29: Thailandc APAC Thermal Power Plant Industry Revenue (Million) Forecast, by Application 2019 & 2032
- Table 30: Thailandc APAC Thermal Power Plant Industry Volume (Gigawatt) Forecast, by Application 2019 & 2032
- Table 31: Rest of Asia Pacific APAC Thermal Power Plant Industry Revenue (Million) Forecast, by Application 2019 & 2032
- Table 32: Rest of Asia Pacific APAC Thermal Power Plant Industry Volume (Gigawatt) Forecast, by Application 2019 & 2032
- Table 33: Global APAC Thermal Power Plant Industry Revenue Million Forecast, by Fuel Type 2019 & 2032
- Table 34: Global APAC Thermal Power Plant Industry Volume Gigawatt Forecast, by Fuel Type 2019 & 2032
- Table 35: Global APAC Thermal Power Plant Industry Revenue Million Forecast, by Geography 2019 & 2032
- Table 36: Global APAC Thermal Power Plant Industry Volume Gigawatt Forecast, by Geography 2019 & 2032
- Table 37: Global APAC Thermal Power Plant Industry Revenue Million Forecast, by Country 2019 & 2032
- Table 38: Global APAC Thermal Power Plant Industry Volume Gigawatt Forecast, by Country 2019 & 2032
- Table 39: Global APAC Thermal Power Plant Industry Revenue Million Forecast, by Fuel Type 2019 & 2032
- Table 40: Global APAC Thermal Power Plant Industry Volume Gigawatt Forecast, by Fuel Type 2019 & 2032
- Table 41: Global APAC Thermal Power Plant Industry Revenue Million Forecast, by Geography 2019 & 2032
- Table 42: Global APAC Thermal Power Plant Industry Volume Gigawatt Forecast, by Geography 2019 & 2032
- Table 43: Global APAC Thermal Power Plant Industry Revenue Million Forecast, by Country 2019 & 2032
- Table 44: Global APAC Thermal Power Plant Industry Volume Gigawatt Forecast, by Country 2019 & 2032
- Table 45: Global APAC Thermal Power Plant Industry Revenue Million Forecast, by Fuel Type 2019 & 2032
- Table 46: Global APAC Thermal Power Plant Industry Volume Gigawatt Forecast, by Fuel Type 2019 & 2032
- Table 47: Global APAC Thermal Power Plant Industry Revenue Million Forecast, by Geography 2019 & 2032
- Table 48: Global APAC Thermal Power Plant Industry Volume Gigawatt Forecast, by Geography 2019 & 2032
- Table 49: Global APAC Thermal Power Plant Industry Revenue Million Forecast, by Country 2019 & 2032
- Table 50: Global APAC Thermal Power Plant Industry Volume Gigawatt Forecast, by Country 2019 & 2032
- Table 51: Global APAC Thermal Power Plant Industry Revenue Million Forecast, by Fuel Type 2019 & 2032
- Table 52: Global APAC Thermal Power Plant Industry Volume Gigawatt Forecast, by Fuel Type 2019 & 2032
- Table 53: Global APAC Thermal Power Plant Industry Revenue Million Forecast, by Geography 2019 & 2032
- Table 54: Global APAC Thermal Power Plant Industry Volume Gigawatt Forecast, by Geography 2019 & 2032
- Table 55: Global APAC Thermal Power Plant Industry Revenue Million Forecast, by Country 2019 & 2032
- Table 56: Global APAC Thermal Power Plant Industry Volume Gigawatt Forecast, by Country 2019 & 2032
Frequently Asked Questions
1. What is the projected Compound Annual Growth Rate (CAGR) of the APAC Thermal Power Plant Industry?
The projected CAGR is approximately > 2.50%.
2. Which companies are prominent players in the APAC Thermal Power Plant Industry?
Key companies in the market include Datang International Power Generation Company Limited, Korea Electric Power Corporation, Mitsubishi Heavy Industries LTD, Toshiba Corp, China National Electric Engineering Co Ltd, China Energy Engineering Corporation (CEEC), Adani Group, NTPC Limited, Tata Group, Tokyo Electric Power Company Holdings Inc.
3. What are the main segments of the APAC Thermal Power Plant Industry?
The market segments include Fuel Type, Geography.
4. Can you provide details about the market size?
The market size is estimated to be USD XX Million as of 2022.
5. What are some drivers contributing to market growth?
4.; Increasing Power Generation Capacity Plans and Increasing Electricity Demand4.; Rapidly Growing Industrial and Infrastructural Development Activities.
6. What are the notable trends driving market growth?
Coal Segment Expected to Dominate the Market.
7. Are there any restraints impacting market growth?
4.; Coal Substituted with Clean Energy Sources.
8. Can you provide examples of recent developments in the market?
March 2022: Harbin Electric and GE Gas Power announced that Shenzhen Energy Group Corporation Co., Ltd., a government-owned power utility, has ordered power generation equipment for its Guangming combined-cycle power plant, located in the Shenzhen Guangming district of Guangdong province in China. The facility will be powered by three GE 9HA.01 gas turbines with a capacity of up to 2 gigawatts (GW).
9. What pricing options are available for accessing the report?
Pricing options include single-user, multi-user, and enterprise licenses priced at USD 4750, USD 5250, and USD 8750 respectively.
10. Is the market size provided in terms of value or volume?
The market size is provided in terms of value, measured in Million and volume, measured in Gigawatt.
11. Are there any specific market keywords associated with the report?
Yes, the market keyword associated with the report is "APAC Thermal Power Plant Industry," which aids in identifying and referencing the specific market segment covered.
12. How do I determine which pricing option suits my needs best?
The pricing options vary based on user requirements and access needs. Individual users may opt for single-user licenses, while businesses requiring broader access may choose multi-user or enterprise licenses for cost-effective access to the report.
13. Are there any additional resources or data provided in the APAC Thermal Power Plant Industry report?
While the report offers comprehensive insights, it's advisable to review the specific contents or supplementary materials provided to ascertain if additional resources or data are available.
14. How can I stay updated on further developments or reports in the APAC Thermal Power Plant Industry?
To stay informed about further developments, trends, and reports in the APAC Thermal Power Plant Industry, consider subscribing to industry newsletters, following relevant companies and organizations, or regularly checking reputable industry news sources and publications.
Methodology
Step 1 - Identification of Relevant Samples Size from Population Database


Step 2 - Approaches for Defining Global Market Size (Value, Volume* & Price*)

Note*: In applicable scenarios
Step 3 - Data Sources
Primary Research
- Web Analytics
- Survey Reports
- Research Institute
- Latest Research Reports
- Opinion Leaders
Secondary Research
- Annual Reports
- White Paper
- Latest Press Release
- Industry Association
- Paid Database
- Investor Presentations

Step 4 - Data Triangulation
Involves using different sources of information in order to increase the validity of a study
These sources are likely to be stakeholders in a program - participants, other researchers, program staff, other community members, and so on.
Then we put all data in single framework & apply various statistical tools to find out the dynamic on the market.
During the analysis stage, feedback from the stakeholder groups would be compared to determine areas of agreement as well as areas of divergence


