
Key Insights
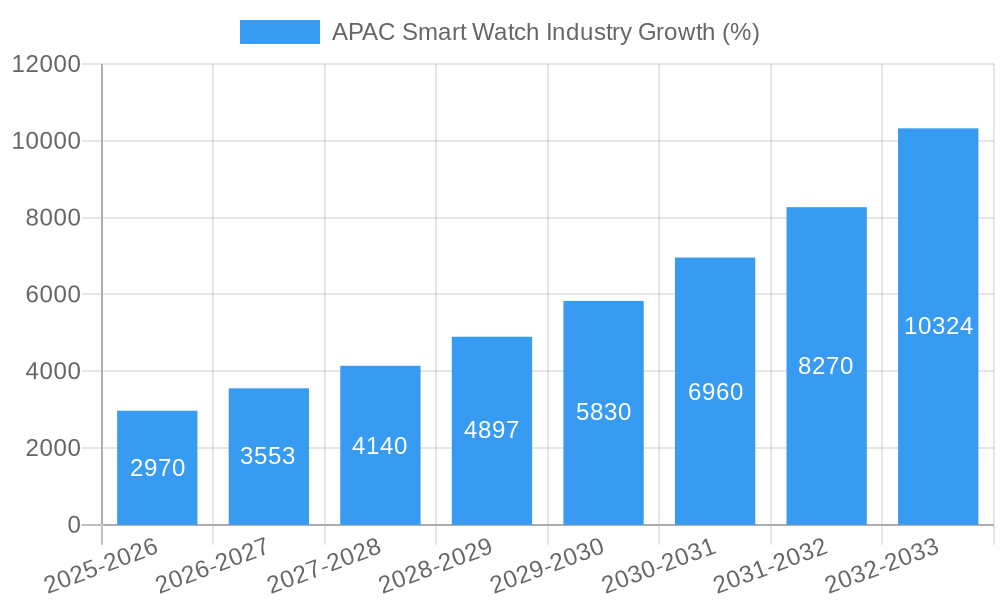
The Asia-Pacific (APAC) smartwatch market is experiencing robust growth, driven by increasing disposable incomes, rising smartphone penetration, and a growing preference for wearable technology. The region's diverse demographics and burgeoning tech-savvy population, particularly in countries like China, India, and South Korea, are key contributors to this expansion. A Compound Annual Growth Rate (CAGR) of 19.69% from 2019-2033 indicates significant potential. The market segmentation reveals strong demand across various operating systems, with Android/Wear OS and watchOS dominating. AMOLED displays are likely the preferred choice due to superior visual quality, driving segment growth. Applications like personal assistance, fitness tracking, and health monitoring are experiencing rapid adoption, further fueling market expansion. While challenges like intense competition and price sensitivity exist, the overall market outlook remains positive. Innovation in features, such as improved health monitoring capabilities and integration with other smart home devices, will continue to drive growth. The increasing integration of smartwatches into various aspects of daily life, from fitness tracking and contactless payments to notification management, are all shaping future growth.
The competitive landscape is dynamic, with established players like Apple, Samsung, and Garmin competing with rising Chinese brands like Xiaomi and Huami. These companies are focusing on strategies like product diversification, strategic partnerships, and aggressive pricing to gain market share. The growth in the APAC market is unevenly distributed; China and India, given their vast populations and growing middle classes, are expected to be the primary growth engines. However, other countries in the region are also showing significant promise, reflecting a broader adoption of smartwatches across the APAC region. Further research into specific sub-segments within each country and the adoption of 5G technology is needed to gain a more granular understanding of the market. This dynamic interplay of technological advancements, consumer preferences, and competitive strategies will shape the trajectory of the APAC smartwatch market in the coming years.
APAC Smart Watch Industry Market Dynamics & Structure
This comprehensive report provides a deep dive into the APAC smart watch market, analyzing its dynamics and structure from 2019 to 2033. The study period encompasses the historical period (2019-2024), the base year (2025), and the forecast period (2025-2033). We examine market concentration, revealing the share held by key players like Apple, Samsung, and Xiaomi. Technological innovation, particularly in areas like health monitoring and improved display technologies (AMOLED, PMOLED, TFT LCD), significantly influences market growth. The report also details the regulatory landscape across different APAC countries, highlighting potential impacts on market access and product features. Competitive pressures from substitute products (e.g., fitness trackers) and evolving consumer preferences are thoroughly analyzed. Furthermore, we examine the impact of mergers and acquisitions (M&A) activity on market consolidation and innovation. Our analysis includes quantitative data such as market share percentages for dominant players and qualitative insights into innovation barriers and the impact of changing demographics on smart watch adoption.
- Market Concentration: The APAC smart watch market exhibits a moderately concentrated structure, with the top 5 players holding approximately xx% of the market share in 2024.
- Technological Innovation: Continuous advancement in sensor technology (ECG, SpO2, etc.) and display quality are key drivers.
- Regulatory Landscape: Varying regulations across countries impact product certifications and data privacy.
- Competitive Substitutes: Fitness trackers and basic activity watches offer competition in the lower price segments.
- M&A Activity: xx M&A deals were recorded in the APAC smart watch sector between 2019 and 2024, resulting in increased market consolidation.
- End-User Demographics: The increasing adoption of smartwatches among younger demographics and the growing health-conscious population fuels market expansion.
APAC Smart Watch Industry Growth Trends & Insights
The APAC smart watch market witnessed significant growth between 2019 and 2024, expanding from xx million units to xx million units. This growth is projected to continue with a Compound Annual Growth Rate (CAGR) of xx% during the forecast period (2025-2033), reaching an estimated xx million units by 2033. The rising adoption rate, driven by increasing smartphone penetration, affordability of smartwatches, and the desire for personalized health and fitness tracking, fuels this expansion. Technological disruptions, such as the integration of advanced health sensors (ECG, blood oxygen monitoring) and improved battery life, continuously enhance product appeal. Changing consumer behavior, including the increasing preference for stylish and feature-rich devices, influences market segmentation and product development. This report provides a detailed analysis of these trends, offering insights into market penetration rates across different segments and countries. The impact of technological disruptions, including the adoption of new operating systems (Watch OS, Android/Wear OS, etc.), is also assessed.
Dominant Regions, Countries, or Segments in APAC Smart Watch Industry
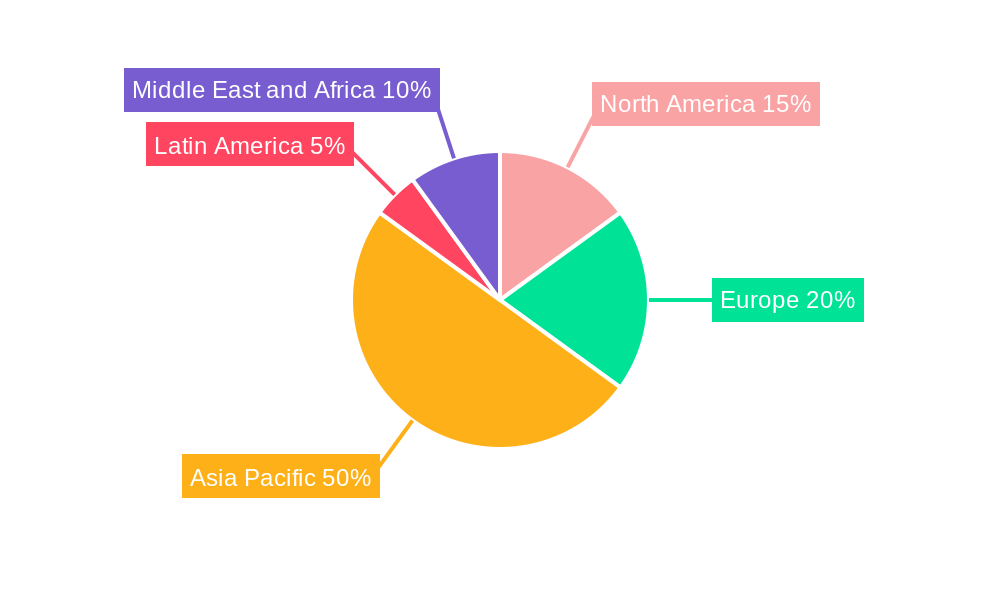
China remains the dominant market for smart watches in the APAC region, contributing xx% of the total market share in 2024. This dominance is attributed to factors such as high smartphone penetration, a large and growing middle class, and favorable government policies promoting technological innovation. India exhibits significant growth potential, driven by a rapidly expanding young population and increasing disposable incomes. Other key countries include Japan and South Korea, which contribute to the overall market growth through their adoption of advanced technologies and established consumer electronics markets.
By Operating System: Android/Wear OS holds the largest market share, driven by its open-source nature and wide device compatibility.
By Display Type: AMOLED displays are gaining popularity due to their superior color reproduction and energy efficiency.
By Application: The personal assistance segment is the largest, but the medical and sports applications segments show the fastest growth.
By Country: China dominates, but India exhibits the highest growth rate.
Key Drivers in China: Large consumer base, high smartphone penetration, robust e-commerce infrastructure, and government support for technological advancement.
Key Drivers in India: Rapidly growing young population, rising disposable incomes, and increasing adoption of smartphones and wearable technologies.
Key Drivers in Japan: High technological adoption rate and demand for premium and feature-rich devices.
Key Drivers in South Korea: Strong domestic brands, advanced technology adoption, and integration with existing consumer electronics ecosystems.
APAC Smart Watch Industry Product Landscape
The APAC smart watch market offers a diverse product landscape, featuring a range of functionalities from basic fitness tracking to advanced health monitoring capabilities. Key innovations include enhanced sensor technology for accurate health data collection (ECG, SpO2, sleep monitoring), improved display technologies (AMOLED, LTPO), longer battery life, and advanced integration with smartphone ecosystems. Smartwatches are increasingly featuring applications beyond fitness and personal assistance, extending into medical diagnostics, and integrating seamlessly with other smart home devices. Unique selling propositions (USPs) revolve around innovative features, fashionable designs, and user-friendly interfaces. Performance metrics such as accuracy of health sensors, battery life, and processing speed are crucial considerations for consumers.
Key Drivers, Barriers & Challenges in APAP Smart Watch Industry
Key Drivers: Increasing smartphone penetration, growing health consciousness, rising disposable incomes, technological advancements, and government support for the digital economy are driving market growth. The integration of advanced health monitoring features and the development of stylish and user-friendly devices are further propelling market expansion.
Key Barriers and Challenges: High initial costs for premium smartwatches can limit market penetration, particularly in price-sensitive markets. Supply chain disruptions, particularly those relating to component sourcing, can impact production and lead to shortages. Stringent regulatory requirements for health-related features may pose challenges for manufacturers. Intense competition from established players and new entrants necessitates continuous innovation and efficient product differentiation.
Emerging Opportunities in APAC Smart Watch Industry
Emerging opportunities lie in untapped markets within the APAC region, where smartphone penetration and disposable incomes are still growing. There is significant potential for expansion in rural areas and among lower-income segments with the development of affordable smartwatches with basic features. Innovative applications, such as integrating smartwatches with enterprise systems for enhanced productivity or utilizing them for remote patient monitoring in healthcare, create new market avenues. Evolving consumer preferences towards personalized health and wellness solutions drive demand for smartwatches with advanced health tracking capabilities and AI-powered features.
Growth Accelerators in the APAC Smart Watch Industry Industry
Technological breakthroughs in areas like battery technology, sensor miniaturization, and artificial intelligence will significantly accelerate market growth. Strategic partnerships between technology companies, healthcare providers, and fitness brands can open new market segments and enhance value propositions. Market expansion strategies focused on underserved regions and the development of tailored products to suit specific cultural contexts will further fuel market expansion. The integration of smartwatches into broader IoT ecosystems, creating interconnected experiences, also presents a significant growth driver.
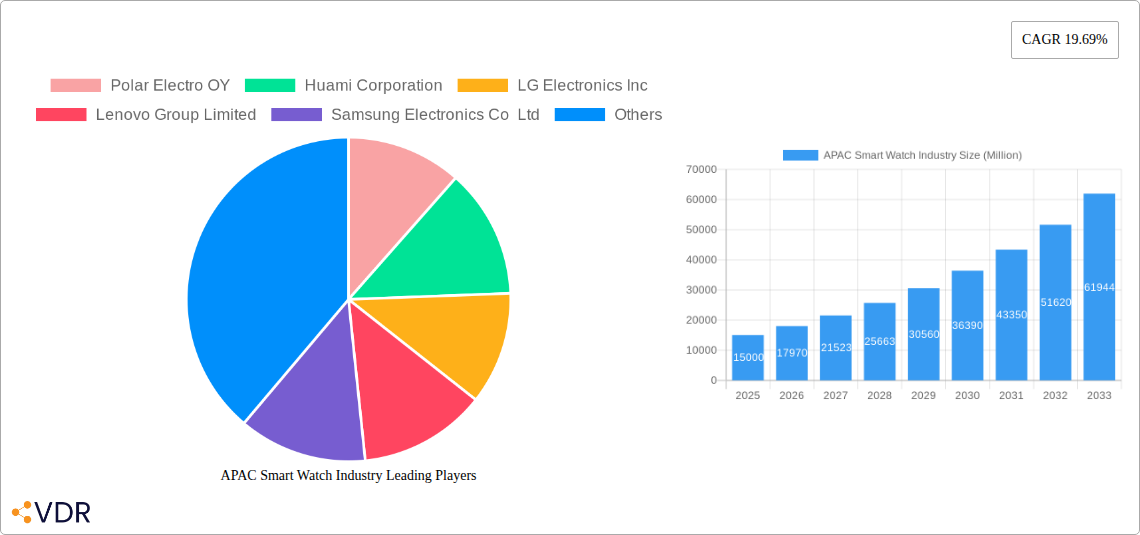
Key Players Shaping the APAC Smart Watch Industry Market
- Polar Electro OY
- Huami Corporation
- LG Electronics Inc
- Lenovo Group Limited
- Samsung Electronics Co Ltd
- Garmin Ltd
- Fitbit Inc
- Huawei Technologies Co Ltd
- Xiaomi Corporation
- Fossil Group Inc
- Apple Inc
- Sony Corporation
Notable Milestones in APAC Smart Watch Industry Sector
- November 2022: Xiaomi launched its Watch S2 in China, showcasing the company's continued focus on the APAC market.
- August 2022: Fitbit's launch of the Sense 2 and Versa 4 highlighted advancements in health monitoring capabilities.
In-Depth APAC Smart Watch Industry Market Outlook
- November 2022: Xiaomi launched its Watch S2 in China, showcasing the company's continued focus on the APAC market.
- August 2022: Fitbit's launch of the Sense 2 and Versa 4 highlighted advancements in health monitoring capabilities.
In-Depth APAC Smart Watch Industry Market Outlook
The APAC smart watch market presents a substantial growth opportunity over the next decade. Continued technological advancements, coupled with increasing consumer demand for health and fitness tracking, will propel market expansion. Strategic partnerships, focused product development for diverse market segments, and expansion into untapped markets will further accelerate growth. Companies that can effectively leverage technological breakthroughs, create compelling value propositions, and adapt to evolving consumer preferences are best positioned to capitalize on this market potential.
APAC Smart Watch Industry Segmentation
-
1. Operating Systems
- 1.1. Watch OS
- 1.2. Android/Wear OS
- 1.3. Other Operating Systems
-
2. Display Type
- 2.1. AMOLED
- 2.2. PMOLED
- 2.3. TFT LCD
-
3. Application
- 3.1. Personal Assistance
- 3.2. Medical
- 3.3. Sports
- 3.4. Other Applications
APAC Smart Watch Industry Segmentation By Geography
-
1. North America
- 1.1. United States
- 1.2. Canada
- 1.3. Mexico
-
2. South America
- 2.1. Brazil
- 2.2. Argentina
- 2.3. Rest of South America
-
3. Europe
- 3.1. United Kingdom
- 3.2. Germany
- 3.3. France
- 3.4. Italy
- 3.5. Spain
- 3.6. Russia
- 3.7. Benelux
- 3.8. Nordics
- 3.9. Rest of Europe
-
4. Middle East & Africa
- 4.1. Turkey
- 4.2. Israel
- 4.3. GCC
- 4.4. North Africa
- 4.5. South Africa
- 4.6. Rest of Middle East & Africa
-
5. Asia Pacific
- 5.1. China
- 5.2. India
- 5.3. Japan
- 5.4. South Korea
- 5.5. ASEAN
- 5.6. Oceania
- 5.7. Rest of Asia Pacific
APAC Smart Watch Industry REPORT HIGHLIGHTS
| Aspects | Details |
|---|---|
| Study Period | 2019-2033 |
| Base Year | 2024 |
| Estimated Year | 2025 |
| Forecast Period | 2025-2033 |
| Historical Period | 2019-2024 |
| Growth Rate | CAGR of 19.69% from 2019-2033 |
| Segmentation |
|
Table of Contents
- 1. Introduction
- 1.1. Research Scope
- 1.2. Market Segmentation
- 1.3. Research Methodology
- 1.4. Definitions and Assumptions
- 2. Executive Summary
- 2.1. Introduction
- 3. Market Dynamics
- 3.1. Introduction
- 3.2. Market Drivers
- 3.2.1. Increasing Technological Advancements in the Wearables Market; Increase in Health Awareness among the Consumer
- 3.3. Market Restrains
- 3.3.1 Growing Complexity of Wearable Devices and Limited Use of Features
- 3.3.2 Augmented With Security Risks
- 3.4. Market Trends
- 3.4.1. Increasing Internet Penetration in the Asia Pacific is Expected to Drive the Studied Market
- 4. Market Factor Analysis
- 4.1. Porters Five Forces
- 4.2. Supply/Value Chain
- 4.3. PESTEL analysis
- 4.4. Market Entropy
- 4.5. Patent/Trademark Analysis
- 5. Global APAC Smart Watch Industry Analysis, Insights and Forecast, 2019-2031
- 5.1. Market Analysis, Insights and Forecast - by Operating Systems
- 5.1.1. Watch OS
- 5.1.2. Android/Wear OS
- 5.1.3. Other Operating Systems
- 5.2. Market Analysis, Insights and Forecast - by Display Type
- 5.2.1. AMOLED
- 5.2.2. PMOLED
- 5.2.3. TFT LCD
- 5.3. Market Analysis, Insights and Forecast - by Application
- 5.3.1. Personal Assistance
- 5.3.2. Medical
- 5.3.3. Sports
- 5.3.4. Other Applications
- 5.4. Market Analysis, Insights and Forecast - by Region
- 5.4.1. North America
- 5.4.2. South America
- 5.4.3. Europe
- 5.4.4. Middle East & Africa
- 5.4.5. Asia Pacific
- 5.1. Market Analysis, Insights and Forecast - by Operating Systems
- 6. North America APAC Smart Watch Industry Analysis, Insights and Forecast, 2019-2031
- 6.1. Market Analysis, Insights and Forecast - by Operating Systems
- 6.1.1. Watch OS
- 6.1.2. Android/Wear OS
- 6.1.3. Other Operating Systems
- 6.2. Market Analysis, Insights and Forecast - by Display Type
- 6.2.1. AMOLED
- 6.2.2. PMOLED
- 6.2.3. TFT LCD
- 6.3. Market Analysis, Insights and Forecast - by Application
- 6.3.1. Personal Assistance
- 6.3.2. Medical
- 6.3.3. Sports
- 6.3.4. Other Applications
- 6.1. Market Analysis, Insights and Forecast - by Operating Systems
- 7. South America APAC Smart Watch Industry Analysis, Insights and Forecast, 2019-2031
- 7.1. Market Analysis, Insights and Forecast - by Operating Systems
- 7.1.1. Watch OS
- 7.1.2. Android/Wear OS
- 7.1.3. Other Operating Systems
- 7.2. Market Analysis, Insights and Forecast - by Display Type
- 7.2.1. AMOLED
- 7.2.2. PMOLED
- 7.2.3. TFT LCD
- 7.3. Market Analysis, Insights and Forecast - by Application
- 7.3.1. Personal Assistance
- 7.3.2. Medical
- 7.3.3. Sports
- 7.3.4. Other Applications
- 7.1. Market Analysis, Insights and Forecast - by Operating Systems
- 8. Europe APAC Smart Watch Industry Analysis, Insights and Forecast, 2019-2031
- 8.1. Market Analysis, Insights and Forecast - by Operating Systems
- 8.1.1. Watch OS
- 8.1.2. Android/Wear OS
- 8.1.3. Other Operating Systems
- 8.2. Market Analysis, Insights and Forecast - by Display Type
- 8.2.1. AMOLED
- 8.2.2. PMOLED
- 8.2.3. TFT LCD
- 8.3. Market Analysis, Insights and Forecast - by Application
- 8.3.1. Personal Assistance
- 8.3.2. Medical
- 8.3.3. Sports
- 8.3.4. Other Applications
- 8.1. Market Analysis, Insights and Forecast - by Operating Systems
- 9. Middle East & Africa APAC Smart Watch Industry Analysis, Insights and Forecast, 2019-2031
- 9.1. Market Analysis, Insights and Forecast - by Operating Systems
- 9.1.1. Watch OS
- 9.1.2. Android/Wear OS
- 9.1.3. Other Operating Systems
- 9.2. Market Analysis, Insights and Forecast - by Display Type
- 9.2.1. AMOLED
- 9.2.2. PMOLED
- 9.2.3. TFT LCD
- 9.3. Market Analysis, Insights and Forecast - by Application
- 9.3.1. Personal Assistance
- 9.3.2. Medical
- 9.3.3. Sports
- 9.3.4. Other Applications
- 9.1. Market Analysis, Insights and Forecast - by Operating Systems
- 10. Asia Pacific APAC Smart Watch Industry Analysis, Insights and Forecast, 2019-2031
- 10.1. Market Analysis, Insights and Forecast - by Operating Systems
- 10.1.1. Watch OS
- 10.1.2. Android/Wear OS
- 10.1.3. Other Operating Systems
- 10.2. Market Analysis, Insights and Forecast - by Display Type
- 10.2.1. AMOLED
- 10.2.2. PMOLED
- 10.2.3. TFT LCD
- 10.3. Market Analysis, Insights and Forecast - by Application
- 10.3.1. Personal Assistance
- 10.3.2. Medical
- 10.3.3. Sports
- 10.3.4. Other Applications
- 10.1. Market Analysis, Insights and Forecast - by Operating Systems
- 11. North America APAC Smart Watch Industry Analysis, Insights and Forecast, 2019-2031
- 11.1. Market Analysis, Insights and Forecast - By Country/Sub-region
- 11.1.1 United States
- 11.1.2 Canada
- 12. Europe APAC Smart Watch Industry Analysis, Insights and Forecast, 2019-2031
- 12.1. Market Analysis, Insights and Forecast - By Country/Sub-region
- 12.1.1 United Kingdom
- 12.1.2 Germany
- 12.1.3 France
- 12.1.4 Rest of Europe
- 13. Asia Pacific APAC Smart Watch Industry Analysis, Insights and Forecast, 2019-2031
- 13.1. Market Analysis, Insights and Forecast - By Country/Sub-region
- 13.1.1 China
- 13.1.2 Japan
- 13.1.3 India
- 13.1.4 Rest of Asia Pacific
- 14. Latin America APAC Smart Watch Industry Analysis, Insights and Forecast, 2019-2031
- 14.1. Market Analysis, Insights and Forecast - By Country/Sub-region
- 14.1.1 Mexico
- 14.1.2 Brazil
- 14.1.3 Rest of Latin America
- 15. Middle East and Africa APAC Smart Watch Industry Analysis, Insights and Forecast, 2019-2031
- 15.1. Market Analysis, Insights and Forecast - By Country/Sub-region
- 15.1.1 United Arab Emirates
- 15.1.2 South Africa
- 15.1.3 Rest of Middle East and Africa
- 16. Competitive Analysis
- 16.1. Global Market Share Analysis 2024
- 16.2. Company Profiles
- 16.2.1 Polar Electro OY
- 16.2.1.1. Overview
- 16.2.1.2. Products
- 16.2.1.3. SWOT Analysis
- 16.2.1.4. Recent Developments
- 16.2.1.5. Financials (Based on Availability)
- 16.2.2 Huami Corporation
- 16.2.2.1. Overview
- 16.2.2.2. Products
- 16.2.2.3. SWOT Analysis
- 16.2.2.4. Recent Developments
- 16.2.2.5. Financials (Based on Availability)
- 16.2.3 LG Electronics Inc
- 16.2.3.1. Overview
- 16.2.3.2. Products
- 16.2.3.3. SWOT Analysis
- 16.2.3.4. Recent Developments
- 16.2.3.5. Financials (Based on Availability)
- 16.2.4 Lenovo Group Limited
- 16.2.4.1. Overview
- 16.2.4.2. Products
- 16.2.4.3. SWOT Analysis
- 16.2.4.4. Recent Developments
- 16.2.4.5. Financials (Based on Availability)
- 16.2.5 Samsung Electronics Co Ltd
- 16.2.5.1. Overview
- 16.2.5.2. Products
- 16.2.5.3. SWOT Analysis
- 16.2.5.4. Recent Developments
- 16.2.5.5. Financials (Based on Availability)
- 16.2.6 Garmin Ltd
- 16.2.6.1. Overview
- 16.2.6.2. Products
- 16.2.6.3. SWOT Analysis
- 16.2.6.4. Recent Developments
- 16.2.6.5. Financials (Based on Availability)
- 16.2.7 Fitbit Inc
- 16.2.7.1. Overview
- 16.2.7.2. Products
- 16.2.7.3. SWOT Analysis
- 16.2.7.4. Recent Developments
- 16.2.7.5. Financials (Based on Availability)
- 16.2.8 Huawei Technologies Co Ltd
- 16.2.8.1. Overview
- 16.2.8.2. Products
- 16.2.8.3. SWOT Analysis
- 16.2.8.4. Recent Developments
- 16.2.8.5. Financials (Based on Availability)
- 16.2.9 Xiaomi Corporatio
- 16.2.9.1. Overview
- 16.2.9.2. Products
- 16.2.9.3. SWOT Analysis
- 16.2.9.4. Recent Developments
- 16.2.9.5. Financials (Based on Availability)
- 16.2.10 Fossil Group Inc
- 16.2.10.1. Overview
- 16.2.10.2. Products
- 16.2.10.3. SWOT Analysis
- 16.2.10.4. Recent Developments
- 16.2.10.5. Financials (Based on Availability)
- 16.2.11 Apple Inc
- 16.2.11.1. Overview
- 16.2.11.2. Products
- 16.2.11.3. SWOT Analysis
- 16.2.11.4. Recent Developments
- 16.2.11.5. Financials (Based on Availability)
- 16.2.12 Sony Corporation
- 16.2.12.1. Overview
- 16.2.12.2. Products
- 16.2.12.3. SWOT Analysis
- 16.2.12.4. Recent Developments
- 16.2.12.5. Financials (Based on Availability)
- 16.2.1 Polar Electro OY
List of Figures
- Figure 1: Global APAC Smart Watch Industry Revenue Breakdown (Million, %) by Region 2024 & 2032
- Figure 2: North America APAC Smart Watch Industry Revenue (Million), by Country 2024 & 2032
- Figure 3: North America APAC Smart Watch Industry Revenue Share (%), by Country 2024 & 2032
- Figure 4: Europe APAC Smart Watch Industry Revenue (Million), by Country 2024 & 2032
- Figure 5: Europe APAC Smart Watch Industry Revenue Share (%), by Country 2024 & 2032
- Figure 6: Asia Pacific APAC Smart Watch Industry Revenue (Million), by Country 2024 & 2032
- Figure 7: Asia Pacific APAC Smart Watch Industry Revenue Share (%), by Country 2024 & 2032
- Figure 8: Latin America APAC Smart Watch Industry Revenue (Million), by Country 2024 & 2032
- Figure 9: Latin America APAC Smart Watch Industry Revenue Share (%), by Country 2024 & 2032
- Figure 10: Middle East and Africa APAC Smart Watch Industry Revenue (Million), by Country 2024 & 2032
- Figure 11: Middle East and Africa APAC Smart Watch Industry Revenue Share (%), by Country 2024 & 2032
- Figure 12: North America APAC Smart Watch Industry Revenue (Million), by Operating Systems 2024 & 2032
- Figure 13: North America APAC Smart Watch Industry Revenue Share (%), by Operating Systems 2024 & 2032
- Figure 14: North America APAC Smart Watch Industry Revenue (Million), by Display Type 2024 & 2032
- Figure 15: North America APAC Smart Watch Industry Revenue Share (%), by Display Type 2024 & 2032
- Figure 16: North America APAC Smart Watch Industry Revenue (Million), by Application 2024 & 2032
- Figure 17: North America APAC Smart Watch Industry Revenue Share (%), by Application 2024 & 2032
- Figure 18: North America APAC Smart Watch Industry Revenue (Million), by Country 2024 & 2032
- Figure 19: North America APAC Smart Watch Industry Revenue Share (%), by Country 2024 & 2032
- Figure 20: South America APAC Smart Watch Industry Revenue (Million), by Operating Systems 2024 & 2032
- Figure 21: South America APAC Smart Watch Industry Revenue Share (%), by Operating Systems 2024 & 2032
- Figure 22: South America APAC Smart Watch Industry Revenue (Million), by Display Type 2024 & 2032
- Figure 23: South America APAC Smart Watch Industry Revenue Share (%), by Display Type 2024 & 2032
- Figure 24: South America APAC Smart Watch Industry Revenue (Million), by Application 2024 & 2032
- Figure 25: South America APAC Smart Watch Industry Revenue Share (%), by Application 2024 & 2032
- Figure 26: South America APAC Smart Watch Industry Revenue (Million), by Country 2024 & 2032
- Figure 27: South America APAC Smart Watch Industry Revenue Share (%), by Country 2024 & 2032
- Figure 28: Europe APAC Smart Watch Industry Revenue (Million), by Operating Systems 2024 & 2032
- Figure 29: Europe APAC Smart Watch Industry Revenue Share (%), by Operating Systems 2024 & 2032
- Figure 30: Europe APAC Smart Watch Industry Revenue (Million), by Display Type 2024 & 2032
- Figure 31: Europe APAC Smart Watch Industry Revenue Share (%), by Display Type 2024 & 2032
- Figure 32: Europe APAC Smart Watch Industry Revenue (Million), by Application 2024 & 2032
- Figure 33: Europe APAC Smart Watch Industry Revenue Share (%), by Application 2024 & 2032
- Figure 34: Europe APAC Smart Watch Industry Revenue (Million), by Country 2024 & 2032
- Figure 35: Europe APAC Smart Watch Industry Revenue Share (%), by Country 2024 & 2032
- Figure 36: Middle East & Africa APAC Smart Watch Industry Revenue (Million), by Operating Systems 2024 & 2032
- Figure 37: Middle East & Africa APAC Smart Watch Industry Revenue Share (%), by Operating Systems 2024 & 2032
- Figure 38: Middle East & Africa APAC Smart Watch Industry Revenue (Million), by Display Type 2024 & 2032
- Figure 39: Middle East & Africa APAC Smart Watch Industry Revenue Share (%), by Display Type 2024 & 2032
- Figure 40: Middle East & Africa APAC Smart Watch Industry Revenue (Million), by Application 2024 & 2032
- Figure 41: Middle East & Africa APAC Smart Watch Industry Revenue Share (%), by Application 2024 & 2032
- Figure 42: Middle East & Africa APAC Smart Watch Industry Revenue (Million), by Country 2024 & 2032
- Figure 43: Middle East & Africa APAC Smart Watch Industry Revenue Share (%), by Country 2024 & 2032
- Figure 44: Asia Pacific APAC Smart Watch Industry Revenue (Million), by Operating Systems 2024 & 2032
- Figure 45: Asia Pacific APAC Smart Watch Industry Revenue Share (%), by Operating Systems 2024 & 2032
- Figure 46: Asia Pacific APAC Smart Watch Industry Revenue (Million), by Display Type 2024 & 2032
- Figure 47: Asia Pacific APAC Smart Watch Industry Revenue Share (%), by Display Type 2024 & 2032
- Figure 48: Asia Pacific APAC Smart Watch Industry Revenue (Million), by Application 2024 & 2032
- Figure 49: Asia Pacific APAC Smart Watch Industry Revenue Share (%), by Application 2024 & 2032
- Figure 50: Asia Pacific APAC Smart Watch Industry Revenue (Million), by Country 2024 & 2032
- Figure 51: Asia Pacific APAC Smart Watch Industry Revenue Share (%), by Country 2024 & 2032
List of Tables
- Table 1: Global APAC Smart Watch Industry Revenue Million Forecast, by Region 2019 & 2032
- Table 2: Global APAC Smart Watch Industry Revenue Million Forecast, by Operating Systems 2019 & 2032
- Table 3: Global APAC Smart Watch Industry Revenue Million Forecast, by Display Type 2019 & 2032
- Table 4: Global APAC Smart Watch Industry Revenue Million Forecast, by Application 2019 & 2032
- Table 5: Global APAC Smart Watch Industry Revenue Million Forecast, by Region 2019 & 2032
- Table 6: Global APAC Smart Watch Industry Revenue Million Forecast, by Country 2019 & 2032
- Table 7: United States APAC Smart Watch Industry Revenue (Million) Forecast, by Application 2019 & 2032
- Table 8: Canada APAC Smart Watch Industry Revenue (Million) Forecast, by Application 2019 & 2032
- Table 9: Global APAC Smart Watch Industry Revenue Million Forecast, by Country 2019 & 2032
- Table 10: United Kingdom APAC Smart Watch Industry Revenue (Million) Forecast, by Application 2019 & 2032
- Table 11: Germany APAC Smart Watch Industry Revenue (Million) Forecast, by Application 2019 & 2032
- Table 12: France APAC Smart Watch Industry Revenue (Million) Forecast, by Application 2019 & 2032
- Table 13: Rest of Europe APAC Smart Watch Industry Revenue (Million) Forecast, by Application 2019 & 2032
- Table 14: Global APAC Smart Watch Industry Revenue Million Forecast, by Country 2019 & 2032
- Table 15: China APAC Smart Watch Industry Revenue (Million) Forecast, by Application 2019 & 2032
- Table 16: Japan APAC Smart Watch Industry Revenue (Million) Forecast, by Application 2019 & 2032
- Table 17: India APAC Smart Watch Industry Revenue (Million) Forecast, by Application 2019 & 2032
- Table 18: Rest of Asia Pacific APAC Smart Watch Industry Revenue (Million) Forecast, by Application 2019 & 2032
- Table 19: Global APAC Smart Watch Industry Revenue Million Forecast, by Country 2019 & 2032
- Table 20: Mexico APAC Smart Watch Industry Revenue (Million) Forecast, by Application 2019 & 2032
- Table 21: Brazil APAC Smart Watch Industry Revenue (Million) Forecast, by Application 2019 & 2032
- Table 22: Rest of Latin America APAC Smart Watch Industry Revenue (Million) Forecast, by Application 2019 & 2032
- Table 23: Global APAC Smart Watch Industry Revenue Million Forecast, by Country 2019 & 2032
- Table 24: United Arab Emirates APAC Smart Watch Industry Revenue (Million) Forecast, by Application 2019 & 2032
- Table 25: South Africa APAC Smart Watch Industry Revenue (Million) Forecast, by Application 2019 & 2032
- Table 26: Rest of Middle East and Africa APAC Smart Watch Industry Revenue (Million) Forecast, by Application 2019 & 2032
- Table 27: Global APAC Smart Watch Industry Revenue Million Forecast, by Operating Systems 2019 & 2032
- Table 28: Global APAC Smart Watch Industry Revenue Million Forecast, by Display Type 2019 & 2032
- Table 29: Global APAC Smart Watch Industry Revenue Million Forecast, by Application 2019 & 2032
- Table 30: Global APAC Smart Watch Industry Revenue Million Forecast, by Country 2019 & 2032
- Table 31: United States APAC Smart Watch Industry Revenue (Million) Forecast, by Application 2019 & 2032
- Table 32: Canada APAC Smart Watch Industry Revenue (Million) Forecast, by Application 2019 & 2032
- Table 33: Mexico APAC Smart Watch Industry Revenue (Million) Forecast, by Application 2019 & 2032
- Table 34: Global APAC Smart Watch Industry Revenue Million Forecast, by Operating Systems 2019 & 2032
- Table 35: Global APAC Smart Watch Industry Revenue Million Forecast, by Display Type 2019 & 2032
- Table 36: Global APAC Smart Watch Industry Revenue Million Forecast, by Application 2019 & 2032
- Table 37: Global APAC Smart Watch Industry Revenue Million Forecast, by Country 2019 & 2032
- Table 38: Brazil APAC Smart Watch Industry Revenue (Million) Forecast, by Application 2019 & 2032
- Table 39: Argentina APAC Smart Watch Industry Revenue (Million) Forecast, by Application 2019 & 2032
- Table 40: Rest of South America APAC Smart Watch Industry Revenue (Million) Forecast, by Application 2019 & 2032
- Table 41: Global APAC Smart Watch Industry Revenue Million Forecast, by Operating Systems 2019 & 2032
- Table 42: Global APAC Smart Watch Industry Revenue Million Forecast, by Display Type 2019 & 2032
- Table 43: Global APAC Smart Watch Industry Revenue Million Forecast, by Application 2019 & 2032
- Table 44: Global APAC Smart Watch Industry Revenue Million Forecast, by Country 2019 & 2032
- Table 45: United Kingdom APAC Smart Watch Industry Revenue (Million) Forecast, by Application 2019 & 2032
- Table 46: Germany APAC Smart Watch Industry Revenue (Million) Forecast, by Application 2019 & 2032
- Table 47: France APAC Smart Watch Industry Revenue (Million) Forecast, by Application 2019 & 2032
- Table 48: Italy APAC Smart Watch Industry Revenue (Million) Forecast, by Application 2019 & 2032
- Table 49: Spain APAC Smart Watch Industry Revenue (Million) Forecast, by Application 2019 & 2032
- Table 50: Russia APAC Smart Watch Industry Revenue (Million) Forecast, by Application 2019 & 2032
- Table 51: Benelux APAC Smart Watch Industry Revenue (Million) Forecast, by Application 2019 & 2032
- Table 52: Nordics APAC Smart Watch Industry Revenue (Million) Forecast, by Application 2019 & 2032
- Table 53: Rest of Europe APAC Smart Watch Industry Revenue (Million) Forecast, by Application 2019 & 2032
- Table 54: Global APAC Smart Watch Industry Revenue Million Forecast, by Operating Systems 2019 & 2032
- Table 55: Global APAC Smart Watch Industry Revenue Million Forecast, by Display Type 2019 & 2032
- Table 56: Global APAC Smart Watch Industry Revenue Million Forecast, by Application 2019 & 2032
- Table 57: Global APAC Smart Watch Industry Revenue Million Forecast, by Country 2019 & 2032
- Table 58: Turkey APAC Smart Watch Industry Revenue (Million) Forecast, by Application 2019 & 2032
- Table 59: Israel APAC Smart Watch Industry Revenue (Million) Forecast, by Application 2019 & 2032
- Table 60: GCC APAC Smart Watch Industry Revenue (Million) Forecast, by Application 2019 & 2032
- Table 61: North Africa APAC Smart Watch Industry Revenue (Million) Forecast, by Application 2019 & 2032
- Table 62: South Africa APAC Smart Watch Industry Revenue (Million) Forecast, by Application 2019 & 2032
- Table 63: Rest of Middle East & Africa APAC Smart Watch Industry Revenue (Million) Forecast, by Application 2019 & 2032
- Table 64: Global APAC Smart Watch Industry Revenue Million Forecast, by Operating Systems 2019 & 2032
- Table 65: Global APAC Smart Watch Industry Revenue Million Forecast, by Display Type 2019 & 2032
- Table 66: Global APAC Smart Watch Industry Revenue Million Forecast, by Application 2019 & 2032
- Table 67: Global APAC Smart Watch Industry Revenue Million Forecast, by Country 2019 & 2032
- Table 68: China APAC Smart Watch Industry Revenue (Million) Forecast, by Application 2019 & 2032
- Table 69: India APAC Smart Watch Industry Revenue (Million) Forecast, by Application 2019 & 2032
- Table 70: Japan APAC Smart Watch Industry Revenue (Million) Forecast, by Application 2019 & 2032
- Table 71: South Korea APAC Smart Watch Industry Revenue (Million) Forecast, by Application 2019 & 2032
- Table 72: ASEAN APAC Smart Watch Industry Revenue (Million) Forecast, by Application 2019 & 2032
- Table 73: Oceania APAC Smart Watch Industry Revenue (Million) Forecast, by Application 2019 & 2032
- Table 74: Rest of Asia Pacific APAC Smart Watch Industry Revenue (Million) Forecast, by Application 2019 & 2032
Frequently Asked Questions
1. What is the projected Compound Annual Growth Rate (CAGR) of the APAC Smart Watch Industry?
The projected CAGR is approximately 19.69%.
2. Which companies are prominent players in the APAC Smart Watch Industry?
Key companies in the market include Polar Electro OY, Huami Corporation, LG Electronics Inc, Lenovo Group Limited, Samsung Electronics Co Ltd, Garmin Ltd, Fitbit Inc, Huawei Technologies Co Ltd, Xiaomi Corporatio, Fossil Group Inc, Apple Inc, Sony Corporation.
3. What are the main segments of the APAC Smart Watch Industry?
The market segments include Operating Systems, Display Type, Application.
4. Can you provide details about the market size?
The market size is estimated to be USD 51.62 Million as of 2022.
5. What are some drivers contributing to market growth?
Increasing Technological Advancements in the Wearables Market; Increase in Health Awareness among the Consumer.
6. What are the notable trends driving market growth?
Increasing Internet Penetration in the Asia Pacific is Expected to Drive the Studied Market.
7. Are there any restraints impacting market growth?
Growing Complexity of Wearable Devices and Limited Use of Features. Augmented With Security Risks.
8. Can you provide examples of recent developments in the market?
November 2022 - Xiaomi announced the launch of its new watch S2 in China alongside the flagship Xiaomi 13 series, Buds 4, and a couple of new products. After the launch in China, the company could also aim to launch the watch in the global market.
9. What pricing options are available for accessing the report?
Pricing options include single-user, multi-user, and enterprise licenses priced at USD 4750, USD 4950, and USD 6800 respectively.
10. Is the market size provided in terms of value or volume?
The market size is provided in terms of value, measured in Million.
11. Are there any specific market keywords associated with the report?
Yes, the market keyword associated with the report is "APAC Smart Watch Industry," which aids in identifying and referencing the specific market segment covered.
12. How do I determine which pricing option suits my needs best?
The pricing options vary based on user requirements and access needs. Individual users may opt for single-user licenses, while businesses requiring broader access may choose multi-user or enterprise licenses for cost-effective access to the report.
13. Are there any additional resources or data provided in the APAC Smart Watch Industry report?
While the report offers comprehensive insights, it's advisable to review the specific contents or supplementary materials provided to ascertain if additional resources or data are available.
14. How can I stay updated on further developments or reports in the APAC Smart Watch Industry?
To stay informed about further developments, trends, and reports in the APAC Smart Watch Industry, consider subscribing to industry newsletters, following relevant companies and organizations, or regularly checking reputable industry news sources and publications.
Methodology
Step 1 - Identification of Relevant Samples Size from Population Database


Step 2 - Approaches for Defining Global Market Size (Value, Volume* & Price*)

Note*: In applicable scenarios
Step 3 - Data Sources
Primary Research
- Web Analytics
- Survey Reports
- Research Institute
- Latest Research Reports
- Opinion Leaders
Secondary Research
- Annual Reports
- White Paper
- Latest Press Release
- Industry Association
- Paid Database
- Investor Presentations

Step 4 - Data Triangulation
Involves using different sources of information in order to increase the validity of a study
These sources are likely to be stakeholders in a program - participants, other researchers, program staff, other community members, and so on.
Then we put all data in single framework & apply various statistical tools to find out the dynamic on the market.
During the analysis stage, feedback from the stakeholder groups would be compared to determine areas of agreement as well as areas of divergence


