
Key Insights
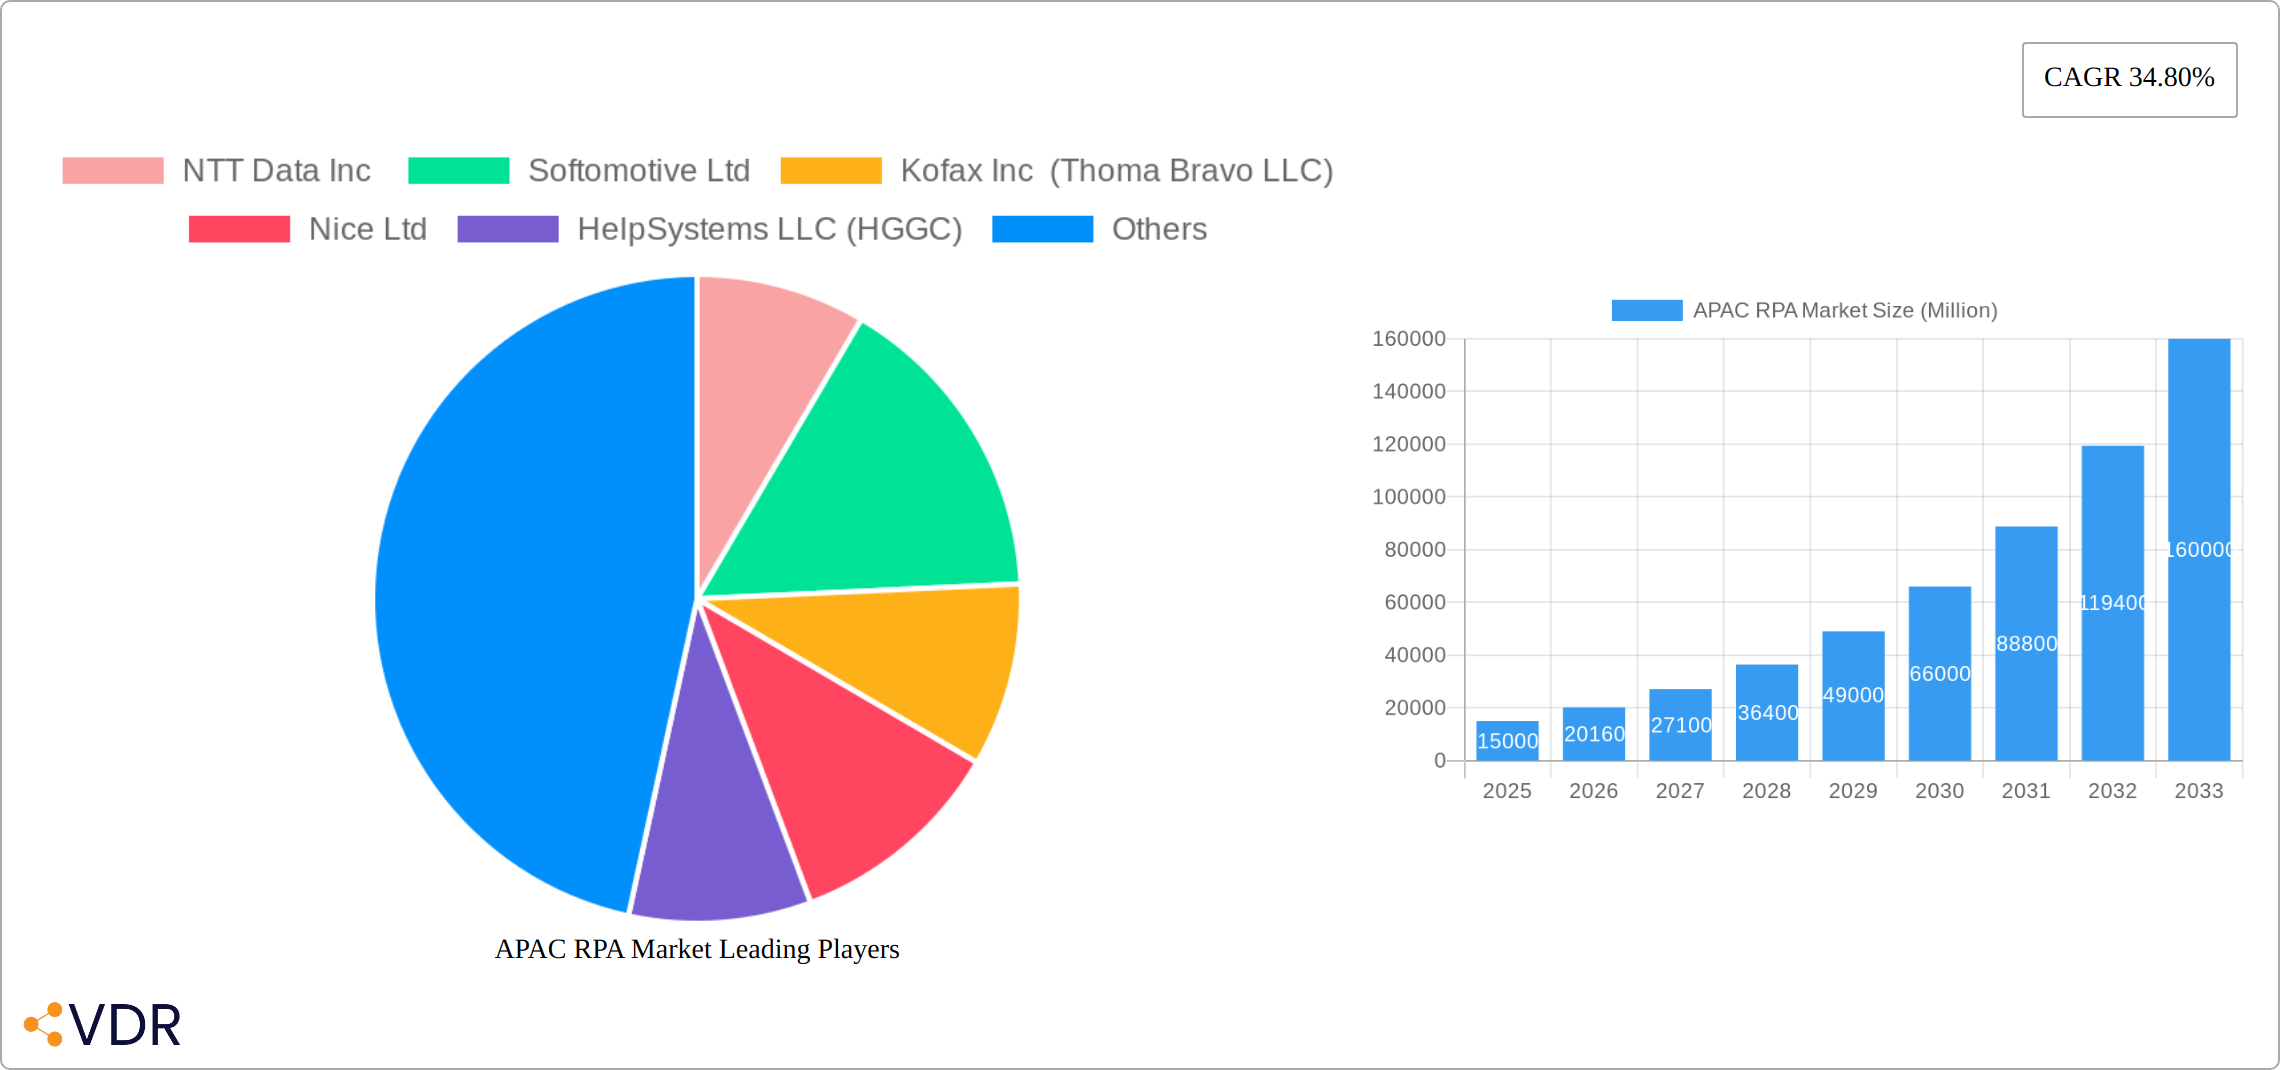
The Asia-Pacific (APAC) Robotic Process Automation (RPA) market is experiencing robust growth, fueled by increasing digitalization across various sectors and a rising need for operational efficiency. With a Compound Annual Growth Rate (CAGR) of 34.80% from 2019 to 2024, the market's value is substantial and projected to continue its upward trajectory. Key drivers include the escalating adoption of cloud-based solutions, the growing demand for automation in business processes across industries like BFSI (Banking, Financial Services, and Insurance), IT & Telecom, and Healthcare, and the increasing focus on improving customer experience through faster and more accurate service delivery. The market is segmented by solution (software and services), enterprise size (SMEs and large enterprises), and end-user industry, offering diverse opportunities for vendors. While initial investment costs and a lack of skilled RPA professionals pose challenges, the long-term benefits of increased productivity, reduced operational costs, and enhanced compliance are driving market expansion. The presence of major players like UiPath, Automation Anywhere, and Blue Prism, coupled with emerging regional vendors, fosters healthy competition and innovation within the APAC RPA landscape. Countries like China, India, Japan, and South Korea are leading the growth, reflecting their advanced technological infrastructure and significant investments in digital transformation initiatives.
The forecast period from 2025 to 2033 anticipates continued strong growth, although the CAGR might moderate slightly as the market matures. The increasing adoption of Artificial Intelligence (AI) and Machine Learning (ML) integrated with RPA solutions is expected to further enhance the market's capabilities and appeal. The focus will likely shift towards more sophisticated automation solutions addressing complex business processes and incorporating advanced analytics for better decision-making. However, the market's progress will be influenced by factors such as cybersecurity concerns related to automated systems and the ongoing need for workforce upskilling to manage and maintain these technologies effectively. The success of RPA deployments will hinge on the ability of organizations to effectively integrate RPA with existing IT infrastructure and address potential challenges associated with data security and integration complexities.
APAC RPA Market: A Comprehensive Report (2019-2033)
This in-depth report provides a comprehensive analysis of the Asia-Pacific Robotic Process Automation (RPA) market, encompassing market dynamics, growth trends, regional dominance, product landscape, key players, and future outlook. The study period covers 2019-2033, with 2025 as the base year and forecast period spanning 2025-2033. The report utilizes data from 2019-2024 as the historical period. Market values are presented in million units.
APAC RPA Market Dynamics & Structure
The APAC RPA market is experiencing significant growth fueled by technological advancements, increasing automation needs across various industries, and supportive government initiatives. Market concentration is moderate, with several key players vying for market share. The market is characterized by intense competition, driven by continuous product innovation and strategic mergers and acquisitions (M&A).
- Market Concentration: Moderate, with the top 5 players holding an estimated xx% market share in 2025.
- Technological Innovation: Rapid advancements in AI, ML, and cloud computing are driving the adoption of sophisticated RPA solutions. Innovation barriers include integration complexities and data security concerns.
- Regulatory Frameworks: Varying regulatory landscapes across APAC countries influence RPA adoption rates. Data privacy regulations are a major consideration.
- Competitive Product Substitutes: Traditional business process outsourcing (BPO) services and manual processes pose some competition.
- End-User Demographics: Large Enterprises are currently the primary adopters, but SMEs are showing increasing interest.
- M&A Trends: A significant number of M&A activities are observed, with xx deals recorded between 2019 and 2024. This trend is expected to continue, driving consolidation in the market.
APAC RPA Market Growth Trends & Insights
The APAC RPA market exhibits a robust growth trajectory, driven by increasing digitalization across industries and the need for operational efficiency. The market size is projected to reach xx million by 2033, exhibiting a Compound Annual Growth Rate (CAGR) of xx% during the forecast period. Adoption rates are highest in developed economies like Japan and South Korea, while emerging markets are showing rapid growth potential. Technological disruptions, particularly in AI and cloud-based solutions, are accelerating adoption. Consumer behavior shifts towards self-service and personalized experiences are further driving demand.

Dominant Regions, Countries, or Segments in APAC RPA Market
China and India are the leading countries driving APAC RPA market growth, followed by Japan and South Korea. The BFSI (Banking, Financial Services, and Insurance) and IT & Telecom sectors are the largest end-user industries. Large Enterprises represent a significant portion of the market. Software solutions dominate the market, but service offerings are also experiencing significant growth.
- Key Drivers:
- China: Strong government support for digital transformation, a large and growing IT sector.
- India: Large talent pool of skilled IT professionals, cost-effective outsourcing capabilities.
- Japan: High adoption of automation in manufacturing and financial sectors.
- South Korea: Focus on technological advancement and Industry 4.0 initiatives.
- BFSI: Stringent regulatory compliance requirements, need for fraud prevention and efficiency gains.
- IT & Telecom: Demand for automated network management and customer service.
- Large Enterprises: Resources and budgets to invest in RPA solutions.
- Software Solutions: Greater flexibility, scalability, and cost-effectiveness compared to services.
APAC RPA Market Product Landscape
The APAC RPA market features a diverse range of products, from basic rule-based automation tools to advanced AI-powered solutions. Key advancements include improved integration capabilities, enhanced security features, and the incorporation of natural language processing (NLP) and machine learning (ML) algorithms. These solutions offer unique selling propositions (USPs) such as increased productivity, reduced operational costs, and improved accuracy.
Key Drivers, Barriers & Challenges in APAC RPA Market
Key Drivers: Increasing labor costs, need for improved operational efficiency, growing adoption of cloud-based solutions, and government support for digital transformation.
Key Challenges: High initial investment costs, lack of skilled workforce, integration complexities, data security and privacy concerns, and resistance to change within organizations. These challenges pose significant barriers to widespread adoption, potentially reducing the market's growth by xx% in the next five years.
Emerging Opportunities in APAP RPA Market
Untapped potential exists within SMEs across various industries, including healthcare and retail. The rise of hyperautomation, combining RPA with other technologies, presents significant growth opportunities. Innovative applications, such as intelligent document processing (IDP) and process mining, are driving market expansion. The evolving consumer preference for personalized and efficient service also creates opportunities for RPA deployment.
Growth Accelerators in the APAC RPA Market Industry
Technological breakthroughs, specifically in AI and ML, are key growth accelerators. Strategic partnerships between RPA vendors and system integrators are facilitating wider adoption. Market expansion into previously underserved regions and industries further fuels growth. The increasing availability of cloud-based RPA solutions reduces implementation barriers and encourages broader market penetration.
Key Players Shaping the APAC RPA Market Market
- NTT Data Inc
- Softomotive Ltd
- Kofax Inc (Thoma Bravo LLC)
- Nice Ltd
- HelpSystems LLC (HGGC)
- WorFusion Inc
- UIPath Inc
- Datamatics Global Services Limited
- Automation Anywhere Inc
- Pegasystems Inc
- AutomationEdge Technologies Inc
- Blue Prism Group PLC
- AntWorks Pte Ltd
- Kryon System Ltd
Notable Milestones in APAC RPA Market Sector
- October 2022: Blue Prism Group PLC and SS&C combined RPA, BPM, AI, and no-code offerings, creating a comprehensive intelligent automation suite. This significantly broadened the scope of available solutions and enhanced market competitiveness.
- May 2022: Pegasystems Inc's acquisition of Everflow strengthened its process mining capabilities, providing clients with robust analytics for improved process optimization. This enhanced the value proposition of existing Pega solutions.
In-Depth APAC RPA Market Outlook
The APAC RPA market exhibits substantial future potential, driven by the continuous evolution of technologies like AI and the increasing focus on digital transformation across all sectors. Strategic partnerships and expansion into untapped markets will fuel market growth. The adoption of cloud-based and hyperautomation solutions will continue to be key drivers. The long-term outlook is optimistic, with strong growth potential throughout the forecast period.
APAC RPA Market Segmentation
-
1. Solution
- 1.1. Software
- 1.2. Service
-
2. Size of Enterprise
- 2.1. Small and Medium Enterprises
- 2.2. Large Enterprises
-
3. End-user Industry
- 3.1. IT and Telecom
- 3.2. BFSI
- 3.3. Healthcare
- 3.4. Retail
- 3.5. Manufacturing
- 3.6. Mining
- 3.7. Other End-user Industries
APAC RPA Market Segmentation By Geography
-
1. North America
- 1.1. United States
- 1.2. Canada
- 1.3. Mexico
-
2. South America
- 2.1. Brazil
- 2.2. Argentina
- 2.3. Rest of South America
-
3. Europe
- 3.1. United Kingdom
- 3.2. Germany
- 3.3. France
- 3.4. Italy
- 3.5. Spain
- 3.6. Russia
- 3.7. Benelux
- 3.8. Nordics
- 3.9. Rest of Europe
-
4. Middle East & Africa
- 4.1. Turkey
- 4.2. Israel
- 4.3. GCC
- 4.4. North Africa
- 4.5. South Africa
- 4.6. Rest of Middle East & Africa
-
5. Asia Pacific
- 5.1. China
- 5.2. India
- 5.3. Japan
- 5.4. South Korea
- 5.5. ASEAN
- 5.6. Oceania
- 5.7. Rest of Asia Pacific

APAC RPA Market REPORT HIGHLIGHTS
| Aspects | Details |
|---|---|
| Study Period | 2019-2033 |
| Base Year | 2024 |
| Estimated Year | 2025 |
| Forecast Period | 2025-2033 |
| Historical Period | 2019-2024 |
| Growth Rate | CAGR of 34.80% from 2019-2033 |
| Segmentation |
|
Table of Contents
- 1. Introduction
- 1.1. Research Scope
- 1.2. Market Segmentation
- 1.3. Research Methodology
- 1.4. Definitions and Assumptions
- 2. Executive Summary
- 2.1. Introduction
- 3. Market Dynamics
- 3.1. Introduction
- 3.2. Market Drivers
- 3.2.1 Reforms by Government and Localization of Documents
- 3.2.2 Support Systems
- 3.2.3 and Interfaces of various RPA Vendors; Increasing Need to Streamline Business Processes and Technological Advancements
- 3.3. Market Restrains
- 3.3.1. Lack of Awareness About Workforce Analytics
- 3.4. Market Trends
- 3.4.1. Mining Sector will Drive the Market Growth
- 4. Market Factor Analysis
- 4.1. Porters Five Forces
- 4.2. Supply/Value Chain
- 4.3. PESTEL analysis
- 4.4. Market Entropy
- 4.5. Patent/Trademark Analysis
- 5. Global APAC RPA Market Analysis, Insights and Forecast, 2019-2031
- 5.1. Market Analysis, Insights and Forecast - by Solution
- 5.1.1. Software
- 5.1.2. Service
- 5.2. Market Analysis, Insights and Forecast - by Size of Enterprise
- 5.2.1. Small and Medium Enterprises
- 5.2.2. Large Enterprises
- 5.3. Market Analysis, Insights and Forecast - by End-user Industry
- 5.3.1. IT and Telecom
- 5.3.2. BFSI
- 5.3.3. Healthcare
- 5.3.4. Retail
- 5.3.5. Manufacturing
- 5.3.6. Mining
- 5.3.7. Other End-user Industries
- 5.4. Market Analysis, Insights and Forecast - by Region
- 5.4.1. North America
- 5.4.2. South America
- 5.4.3. Europe
- 5.4.4. Middle East & Africa
- 5.4.5. Asia Pacific
- 5.1. Market Analysis, Insights and Forecast - by Solution
- 6. North America APAC RPA Market Analysis, Insights and Forecast, 2019-2031
- 6.1. Market Analysis, Insights and Forecast - by Solution
- 6.1.1. Software
- 6.1.2. Service
- 6.2. Market Analysis, Insights and Forecast - by Size of Enterprise
- 6.2.1. Small and Medium Enterprises
- 6.2.2. Large Enterprises
- 6.3. Market Analysis, Insights and Forecast - by End-user Industry
- 6.3.1. IT and Telecom
- 6.3.2. BFSI
- 6.3.3. Healthcare
- 6.3.4. Retail
- 6.3.5. Manufacturing
- 6.3.6. Mining
- 6.3.7. Other End-user Industries
- 6.1. Market Analysis, Insights and Forecast - by Solution
- 7. South America APAC RPA Market Analysis, Insights and Forecast, 2019-2031
- 7.1. Market Analysis, Insights and Forecast - by Solution
- 7.1.1. Software
- 7.1.2. Service
- 7.2. Market Analysis, Insights and Forecast - by Size of Enterprise
- 7.2.1. Small and Medium Enterprises
- 7.2.2. Large Enterprises
- 7.3. Market Analysis, Insights and Forecast - by End-user Industry
- 7.3.1. IT and Telecom
- 7.3.2. BFSI
- 7.3.3. Healthcare
- 7.3.4. Retail
- 7.3.5. Manufacturing
- 7.3.6. Mining
- 7.3.7. Other End-user Industries
- 7.1. Market Analysis, Insights and Forecast - by Solution
- 8. Europe APAC RPA Market Analysis, Insights and Forecast, 2019-2031
- 8.1. Market Analysis, Insights and Forecast - by Solution
- 8.1.1. Software
- 8.1.2. Service
- 8.2. Market Analysis, Insights and Forecast - by Size of Enterprise
- 8.2.1. Small and Medium Enterprises
- 8.2.2. Large Enterprises
- 8.3. Market Analysis, Insights and Forecast - by End-user Industry
- 8.3.1. IT and Telecom
- 8.3.2. BFSI
- 8.3.3. Healthcare
- 8.3.4. Retail
- 8.3.5. Manufacturing
- 8.3.6. Mining
- 8.3.7. Other End-user Industries
- 8.1. Market Analysis, Insights and Forecast - by Solution
- 9. Middle East & Africa APAC RPA Market Analysis, Insights and Forecast, 2019-2031
- 9.1. Market Analysis, Insights and Forecast - by Solution
- 9.1.1. Software
- 9.1.2. Service
- 9.2. Market Analysis, Insights and Forecast - by Size of Enterprise
- 9.2.1. Small and Medium Enterprises
- 9.2.2. Large Enterprises
- 9.3. Market Analysis, Insights and Forecast - by End-user Industry
- 9.3.1. IT and Telecom
- 9.3.2. BFSI
- 9.3.3. Healthcare
- 9.3.4. Retail
- 9.3.5. Manufacturing
- 9.3.6. Mining
- 9.3.7. Other End-user Industries
- 9.1. Market Analysis, Insights and Forecast - by Solution
- 10. Asia Pacific APAC RPA Market Analysis, Insights and Forecast, 2019-2031
- 10.1. Market Analysis, Insights and Forecast - by Solution
- 10.1.1. Software
- 10.1.2. Service
- 10.2. Market Analysis, Insights and Forecast - by Size of Enterprise
- 10.2.1. Small and Medium Enterprises
- 10.2.2. Large Enterprises
- 10.3. Market Analysis, Insights and Forecast - by End-user Industry
- 10.3.1. IT and Telecom
- 10.3.2. BFSI
- 10.3.3. Healthcare
- 10.3.4. Retail
- 10.3.5. Manufacturing
- 10.3.6. Mining
- 10.3.7. Other End-user Industries
- 10.1. Market Analysis, Insights and Forecast - by Solution
- 11. Competitive Analysis
- 11.1. Global Market Share Analysis 2024
- 11.2. Company Profiles
- 11.2.1 NTT Data Inc
- 11.2.1.1. Overview
- 11.2.1.2. Products
- 11.2.1.3. SWOT Analysis
- 11.2.1.4. Recent Developments
- 11.2.1.5. Financials (Based on Availability)
- 11.2.2 Softomotive Ltd
- 11.2.2.1. Overview
- 11.2.2.2. Products
- 11.2.2.3. SWOT Analysis
- 11.2.2.4. Recent Developments
- 11.2.2.5. Financials (Based on Availability)
- 11.2.3 Kofax Inc (Thoma Bravo LLC)
- 11.2.3.1. Overview
- 11.2.3.2. Products
- 11.2.3.3. SWOT Analysis
- 11.2.3.4. Recent Developments
- 11.2.3.5. Financials (Based on Availability)
- 11.2.4 Nice Ltd
- 11.2.4.1. Overview
- 11.2.4.2. Products
- 11.2.4.3. SWOT Analysis
- 11.2.4.4. Recent Developments
- 11.2.4.5. Financials (Based on Availability)
- 11.2.5 HelpSystems LLC (HGGC)
- 11.2.5.1. Overview
- 11.2.5.2. Products
- 11.2.5.3. SWOT Analysis
- 11.2.5.4. Recent Developments
- 11.2.5.5. Financials (Based on Availability)
- 11.2.6 WorFusion Inc
- 11.2.6.1. Overview
- 11.2.6.2. Products
- 11.2.6.3. SWOT Analysis
- 11.2.6.4. Recent Developments
- 11.2.6.5. Financials (Based on Availability)
- 11.2.7 UIPath Inc
- 11.2.7.1. Overview
- 11.2.7.2. Products
- 11.2.7.3. SWOT Analysis
- 11.2.7.4. Recent Developments
- 11.2.7.5. Financials (Based on Availability)
- 11.2.8 Datamatics Global Services Limited
- 11.2.8.1. Overview
- 11.2.8.2. Products
- 11.2.8.3. SWOT Analysis
- 11.2.8.4. Recent Developments
- 11.2.8.5. Financials (Based on Availability)
- 11.2.9 Automation Anywhere Inc
- 11.2.9.1. Overview
- 11.2.9.2. Products
- 11.2.9.3. SWOT Analysis
- 11.2.9.4. Recent Developments
- 11.2.9.5. Financials (Based on Availability)
- 11.2.10 Pegasystems Inc
- 11.2.10.1. Overview
- 11.2.10.2. Products
- 11.2.10.3. SWOT Analysis
- 11.2.10.4. Recent Developments
- 11.2.10.5. Financials (Based on Availability)
- 11.2.11 AutomationEdge Technologies Inc
- 11.2.11.1. Overview
- 11.2.11.2. Products
- 11.2.11.3. SWOT Analysis
- 11.2.11.4. Recent Developments
- 11.2.11.5. Financials (Based on Availability)
- 11.2.12 Blue Prism Group PLC
- 11.2.12.1. Overview
- 11.2.12.2. Products
- 11.2.12.3. SWOT Analysis
- 11.2.12.4. Recent Developments
- 11.2.12.5. Financials (Based on Availability)
- 11.2.13 AntWorks Pte Ltd
- 11.2.13.1. Overview
- 11.2.13.2. Products
- 11.2.13.3. SWOT Analysis
- 11.2.13.4. Recent Developments
- 11.2.13.5. Financials (Based on Availability)
- 11.2.14 Kryon System Ltd
- 11.2.14.1. Overview
- 11.2.14.2. Products
- 11.2.14.3. SWOT Analysis
- 11.2.14.4. Recent Developments
- 11.2.14.5. Financials (Based on Availability)
- 11.2.1 NTT Data Inc
List of Figures
- Figure 1: Global APAC RPA Market Revenue Breakdown (Million, %) by Region 2024 & 2032
- Figure 2: North America APAC RPA Market Revenue (Million), by Solution 2024 & 2032
- Figure 3: North America APAC RPA Market Revenue Share (%), by Solution 2024 & 2032
- Figure 4: North America APAC RPA Market Revenue (Million), by Size of Enterprise 2024 & 2032
- Figure 5: North America APAC RPA Market Revenue Share (%), by Size of Enterprise 2024 & 2032
- Figure 6: North America APAC RPA Market Revenue (Million), by End-user Industry 2024 & 2032
- Figure 7: North America APAC RPA Market Revenue Share (%), by End-user Industry 2024 & 2032
- Figure 8: North America APAC RPA Market Revenue (Million), by Country 2024 & 2032
- Figure 9: North America APAC RPA Market Revenue Share (%), by Country 2024 & 2032
- Figure 10: South America APAC RPA Market Revenue (Million), by Solution 2024 & 2032
- Figure 11: South America APAC RPA Market Revenue Share (%), by Solution 2024 & 2032
- Figure 12: South America APAC RPA Market Revenue (Million), by Size of Enterprise 2024 & 2032
- Figure 13: South America APAC RPA Market Revenue Share (%), by Size of Enterprise 2024 & 2032
- Figure 14: South America APAC RPA Market Revenue (Million), by End-user Industry 2024 & 2032
- Figure 15: South America APAC RPA Market Revenue Share (%), by End-user Industry 2024 & 2032
- Figure 16: South America APAC RPA Market Revenue (Million), by Country 2024 & 2032
- Figure 17: South America APAC RPA Market Revenue Share (%), by Country 2024 & 2032
- Figure 18: Europe APAC RPA Market Revenue (Million), by Solution 2024 & 2032
- Figure 19: Europe APAC RPA Market Revenue Share (%), by Solution 2024 & 2032
- Figure 20: Europe APAC RPA Market Revenue (Million), by Size of Enterprise 2024 & 2032
- Figure 21: Europe APAC RPA Market Revenue Share (%), by Size of Enterprise 2024 & 2032
- Figure 22: Europe APAC RPA Market Revenue (Million), by End-user Industry 2024 & 2032
- Figure 23: Europe APAC RPA Market Revenue Share (%), by End-user Industry 2024 & 2032
- Figure 24: Europe APAC RPA Market Revenue (Million), by Country 2024 & 2032
- Figure 25: Europe APAC RPA Market Revenue Share (%), by Country 2024 & 2032
- Figure 26: Middle East & Africa APAC RPA Market Revenue (Million), by Solution 2024 & 2032
- Figure 27: Middle East & Africa APAC RPA Market Revenue Share (%), by Solution 2024 & 2032
- Figure 28: Middle East & Africa APAC RPA Market Revenue (Million), by Size of Enterprise 2024 & 2032
- Figure 29: Middle East & Africa APAC RPA Market Revenue Share (%), by Size of Enterprise 2024 & 2032
- Figure 30: Middle East & Africa APAC RPA Market Revenue (Million), by End-user Industry 2024 & 2032
- Figure 31: Middle East & Africa APAC RPA Market Revenue Share (%), by End-user Industry 2024 & 2032
- Figure 32: Middle East & Africa APAC RPA Market Revenue (Million), by Country 2024 & 2032
- Figure 33: Middle East & Africa APAC RPA Market Revenue Share (%), by Country 2024 & 2032
- Figure 34: Asia Pacific APAC RPA Market Revenue (Million), by Solution 2024 & 2032
- Figure 35: Asia Pacific APAC RPA Market Revenue Share (%), by Solution 2024 & 2032
- Figure 36: Asia Pacific APAC RPA Market Revenue (Million), by Size of Enterprise 2024 & 2032
- Figure 37: Asia Pacific APAC RPA Market Revenue Share (%), by Size of Enterprise 2024 & 2032
- Figure 38: Asia Pacific APAC RPA Market Revenue (Million), by End-user Industry 2024 & 2032
- Figure 39: Asia Pacific APAC RPA Market Revenue Share (%), by End-user Industry 2024 & 2032
- Figure 40: Asia Pacific APAC RPA Market Revenue (Million), by Country 2024 & 2032
- Figure 41: Asia Pacific APAC RPA Market Revenue Share (%), by Country 2024 & 2032
List of Tables
- Table 1: Global APAC RPA Market Revenue Million Forecast, by Region 2019 & 2032
- Table 2: Global APAC RPA Market Revenue Million Forecast, by Solution 2019 & 2032
- Table 3: Global APAC RPA Market Revenue Million Forecast, by Size of Enterprise 2019 & 2032
- Table 4: Global APAC RPA Market Revenue Million Forecast, by End-user Industry 2019 & 2032
- Table 5: Global APAC RPA Market Revenue Million Forecast, by Region 2019 & 2032
- Table 6: Global APAC RPA Market Revenue Million Forecast, by Solution 2019 & 2032
- Table 7: Global APAC RPA Market Revenue Million Forecast, by Size of Enterprise 2019 & 2032
- Table 8: Global APAC RPA Market Revenue Million Forecast, by End-user Industry 2019 & 2032
- Table 9: Global APAC RPA Market Revenue Million Forecast, by Country 2019 & 2032
- Table 10: United States APAC RPA Market Revenue (Million) Forecast, by Application 2019 & 2032
- Table 11: Canada APAC RPA Market Revenue (Million) Forecast, by Application 2019 & 2032
- Table 12: Mexico APAC RPA Market Revenue (Million) Forecast, by Application 2019 & 2032
- Table 13: Global APAC RPA Market Revenue Million Forecast, by Solution 2019 & 2032
- Table 14: Global APAC RPA Market Revenue Million Forecast, by Size of Enterprise 2019 & 2032
- Table 15: Global APAC RPA Market Revenue Million Forecast, by End-user Industry 2019 & 2032
- Table 16: Global APAC RPA Market Revenue Million Forecast, by Country 2019 & 2032
- Table 17: Brazil APAC RPA Market Revenue (Million) Forecast, by Application 2019 & 2032
- Table 18: Argentina APAC RPA Market Revenue (Million) Forecast, by Application 2019 & 2032
- Table 19: Rest of South America APAC RPA Market Revenue (Million) Forecast, by Application 2019 & 2032
- Table 20: Global APAC RPA Market Revenue Million Forecast, by Solution 2019 & 2032
- Table 21: Global APAC RPA Market Revenue Million Forecast, by Size of Enterprise 2019 & 2032
- Table 22: Global APAC RPA Market Revenue Million Forecast, by End-user Industry 2019 & 2032
- Table 23: Global APAC RPA Market Revenue Million Forecast, by Country 2019 & 2032
- Table 24: United Kingdom APAC RPA Market Revenue (Million) Forecast, by Application 2019 & 2032
- Table 25: Germany APAC RPA Market Revenue (Million) Forecast, by Application 2019 & 2032
- Table 26: France APAC RPA Market Revenue (Million) Forecast, by Application 2019 & 2032
- Table 27: Italy APAC RPA Market Revenue (Million) Forecast, by Application 2019 & 2032
- Table 28: Spain APAC RPA Market Revenue (Million) Forecast, by Application 2019 & 2032
- Table 29: Russia APAC RPA Market Revenue (Million) Forecast, by Application 2019 & 2032
- Table 30: Benelux APAC RPA Market Revenue (Million) Forecast, by Application 2019 & 2032
- Table 31: Nordics APAC RPA Market Revenue (Million) Forecast, by Application 2019 & 2032
- Table 32: Rest of Europe APAC RPA Market Revenue (Million) Forecast, by Application 2019 & 2032
- Table 33: Global APAC RPA Market Revenue Million Forecast, by Solution 2019 & 2032
- Table 34: Global APAC RPA Market Revenue Million Forecast, by Size of Enterprise 2019 & 2032
- Table 35: Global APAC RPA Market Revenue Million Forecast, by End-user Industry 2019 & 2032
- Table 36: Global APAC RPA Market Revenue Million Forecast, by Country 2019 & 2032
- Table 37: Turkey APAC RPA Market Revenue (Million) Forecast, by Application 2019 & 2032
- Table 38: Israel APAC RPA Market Revenue (Million) Forecast, by Application 2019 & 2032
- Table 39: GCC APAC RPA Market Revenue (Million) Forecast, by Application 2019 & 2032
- Table 40: North Africa APAC RPA Market Revenue (Million) Forecast, by Application 2019 & 2032
- Table 41: South Africa APAC RPA Market Revenue (Million) Forecast, by Application 2019 & 2032
- Table 42: Rest of Middle East & Africa APAC RPA Market Revenue (Million) Forecast, by Application 2019 & 2032
- Table 43: Global APAC RPA Market Revenue Million Forecast, by Solution 2019 & 2032
- Table 44: Global APAC RPA Market Revenue Million Forecast, by Size of Enterprise 2019 & 2032
- Table 45: Global APAC RPA Market Revenue Million Forecast, by End-user Industry 2019 & 2032
- Table 46: Global APAC RPA Market Revenue Million Forecast, by Country 2019 & 2032
- Table 47: China APAC RPA Market Revenue (Million) Forecast, by Application 2019 & 2032
- Table 48: India APAC RPA Market Revenue (Million) Forecast, by Application 2019 & 2032
- Table 49: Japan APAC RPA Market Revenue (Million) Forecast, by Application 2019 & 2032
- Table 50: South Korea APAC RPA Market Revenue (Million) Forecast, by Application 2019 & 2032
- Table 51: ASEAN APAC RPA Market Revenue (Million) Forecast, by Application 2019 & 2032
- Table 52: Oceania APAC RPA Market Revenue (Million) Forecast, by Application 2019 & 2032
- Table 53: Rest of Asia Pacific APAC RPA Market Revenue (Million) Forecast, by Application 2019 & 2032
Frequently Asked Questions
1. What is the projected Compound Annual Growth Rate (CAGR) of the APAC RPA Market?
The projected CAGR is approximately 34.80%.
2. Which companies are prominent players in the APAC RPA Market?
Key companies in the market include NTT Data Inc , Softomotive Ltd, Kofax Inc (Thoma Bravo LLC), Nice Ltd, HelpSystems LLC (HGGC), WorFusion Inc, UIPath Inc, Datamatics Global Services Limited, Automation Anywhere Inc, Pegasystems Inc, AutomationEdge Technologies Inc, Blue Prism Group PLC, AntWorks Pte Ltd, Kryon System Ltd.
3. What are the main segments of the APAC RPA Market?
The market segments include Solution, Size of Enterprise, End-user Industry.
4. Can you provide details about the market size?
The market size is estimated to be USD XX Million as of 2022.
5. What are some drivers contributing to market growth?
Reforms by Government and Localization of Documents. Support Systems. and Interfaces of various RPA Vendors; Increasing Need to Streamline Business Processes and Technological Advancements.
6. What are the notable trends driving market growth?
Mining Sector will Drive the Market Growth.
7. Are there any restraints impacting market growth?
Lack of Awareness About Workforce Analytics.
8. Can you provide examples of recent developments in the market?
October 2022: Blue Prism Group PLC and SS&C combined robotic process automation (RPA), business process management (BPM), AI, and No-code offerings to deliver a comprehensive intelligent automation suite, whereas supported by technologies such as Process Intelligence, AI/ML, and Intelligent Document Processing, the portfolio enables businesses to unify the workforce, transform customer, employee and user journeys and scale enterprise-wide.
9. What pricing options are available for accessing the report?
Pricing options include single-user, multi-user, and enterprise licenses priced at USD 4750, USD 4950, and USD 6800 respectively.
10. Is the market size provided in terms of value or volume?
The market size is provided in terms of value, measured in Million.
11. Are there any specific market keywords associated with the report?
Yes, the market keyword associated with the report is "APAC RPA Market," which aids in identifying and referencing the specific market segment covered.
12. How do I determine which pricing option suits my needs best?
The pricing options vary based on user requirements and access needs. Individual users may opt for single-user licenses, while businesses requiring broader access may choose multi-user or enterprise licenses for cost-effective access to the report.
13. Are there any additional resources or data provided in the APAC RPA Market report?
While the report offers comprehensive insights, it's advisable to review the specific contents or supplementary materials provided to ascertain if additional resources or data are available.
14. How can I stay updated on further developments or reports in the APAC RPA Market?
To stay informed about further developments, trends, and reports in the APAC RPA Market, consider subscribing to industry newsletters, following relevant companies and organizations, or regularly checking reputable industry news sources and publications.
Methodology
Step 1 - Identification of Relevant Samples Size from Population Database


Step 2 - Approaches for Defining Global Market Size (Value, Volume* & Price*)

Note*: In applicable scenarios
Step 3 - Data Sources
Primary Research
- Web Analytics
- Survey Reports
- Research Institute
- Latest Research Reports
- Opinion Leaders
Secondary Research
- Annual Reports
- White Paper
- Latest Press Release
- Industry Association
- Paid Database
- Investor Presentations

Step 4 - Data Triangulation
Involves using different sources of information in order to increase the validity of a study
These sources are likely to be stakeholders in a program - participants, other researchers, program staff, other community members, and so on.
Then we put all data in single framework & apply various statistical tools to find out the dynamic on the market.
During the analysis stage, feedback from the stakeholder groups would be compared to determine areas of agreement as well as areas of divergence


