
Key Insights
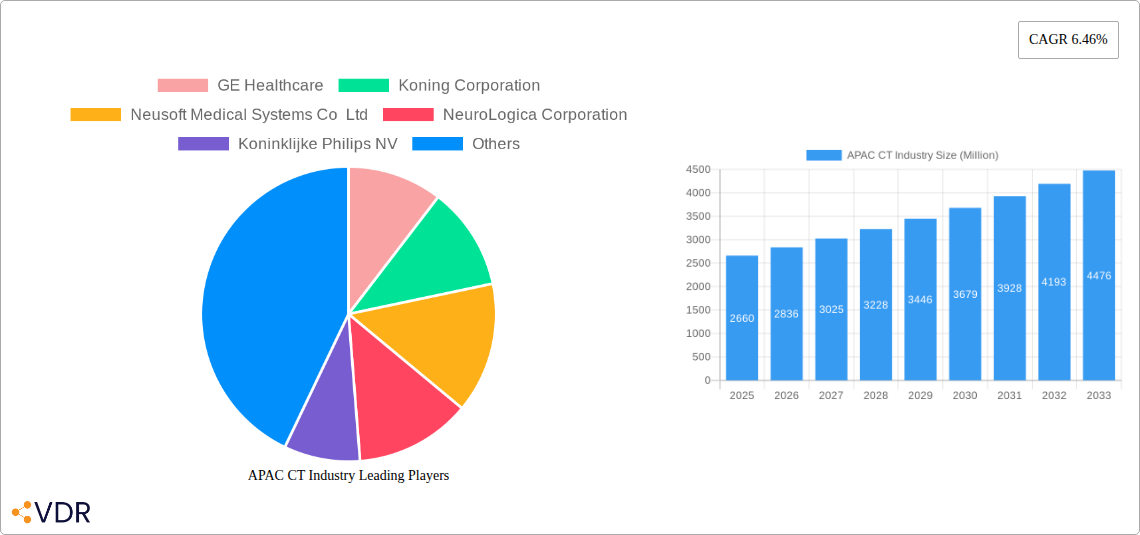
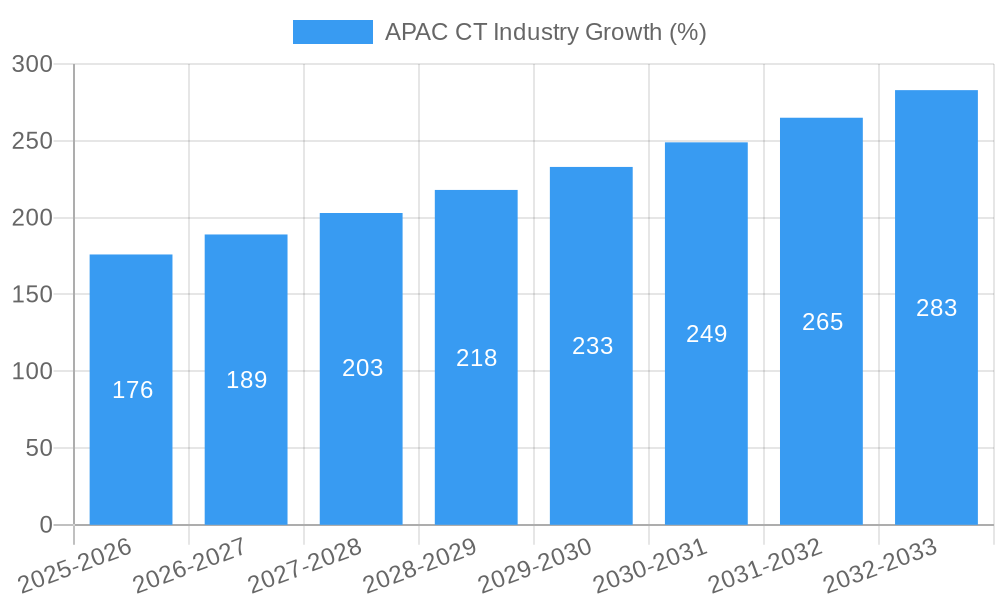
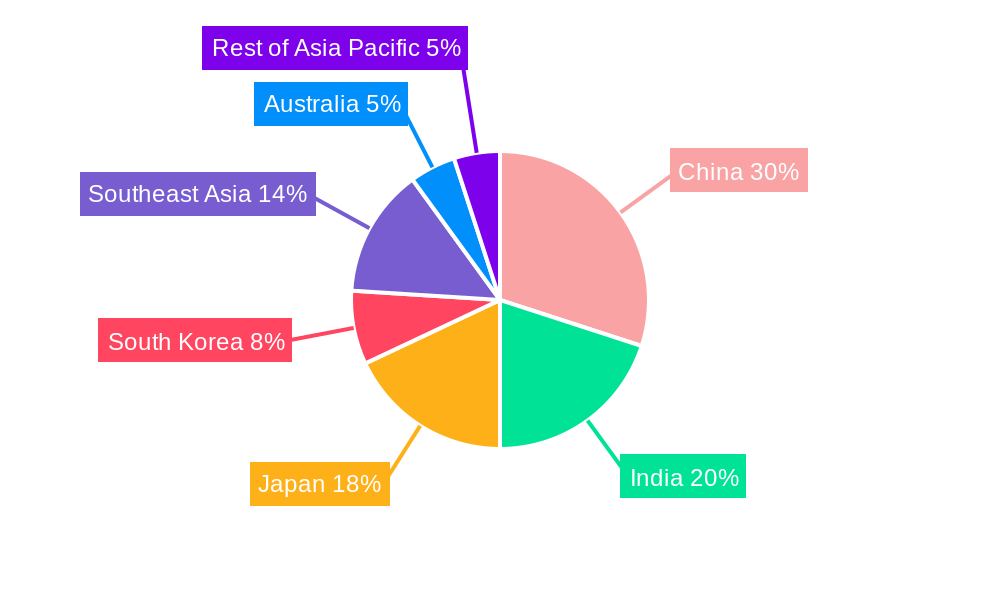
The Asia-Pacific (APAC) computed tomography (CT) industry is experiencing robust growth, driven by a confluence of factors. The market, valued at $2.66 billion in 2025, is projected to expand at a Compound Annual Growth Rate (CAGR) of 6.46% from 2025 to 2033. This growth is fueled by several key drivers: rising prevalence of chronic diseases like cancer and cardiovascular ailments necessitating advanced diagnostic tools, increasing healthcare expenditure across the region, particularly in rapidly developing economies like India and China, and technological advancements leading to higher-resolution imaging with reduced radiation exposure. Furthermore, the growing adoption of minimally invasive surgical procedures necessitates precise pre-operative imaging, further boosting demand for CT scans. The segment breakdown reveals a significant contribution from oncology applications, reflecting the high incidence of cancer in the region. Hospitals remain the dominant end-users, though the increasing penetration of advanced diagnostic services is fostering market expansion in this segment. However, challenges such as high equipment costs, limited access to advanced technology in certain regions, and the need for skilled professionals could partially restrain growth.
Despite these restraints, the long-term outlook for the APAC CT industry remains positive. The ongoing investments in healthcare infrastructure, coupled with supportive government initiatives promoting early disease detection, are expected to fuel market growth. Further segmentation reveals significant market share held by high-slice CT scanners indicating a preference for advanced technology, and robust growth is anticipated in countries like China, India, and Japan due to their large populations and expanding healthcare sectors. The competitive landscape includes major international players like GE Healthcare and Philips, alongside several regional companies vying for market share. This competitive environment is likely to drive innovation and further enhance the accessibility and affordability of CT technology in the APAC region.
APAC CT Industry Market Report: 2019-2033
This comprehensive report provides an in-depth analysis of the Asia-Pacific (APAC) Computed Tomography (CT) industry, covering market dynamics, growth trends, key players, and future outlook. The study period spans from 2019 to 2033, with a base year of 2025 and a forecast period from 2025 to 2033. This report is an essential resource for industry professionals, investors, and strategic decision-makers seeking to understand and capitalize on opportunities within this rapidly evolving market. The report segments the market by Type (Low Slice, Medium Slice, High Slice), Application (Oncology, Neurology, Cardiovascular, Musculoskeletal, Other Applications), and End-User (Hospitals, Clinics, Diagnostic Services, Other End-Users). The total market size is projected at xx Million units by 2033.
APAC CT Industry Market Dynamics & Structure
The APAC CT industry is characterized by a moderately concentrated market structure, with key players like GE Healthcare, Koninklijke Philips NV, and Siemens Healthineers holding significant market share. However, the presence of several regional players and emerging companies fosters competition. Technological innovation, driven by advancements in image quality, speed, and radiation dose reduction, is a primary growth driver. Stringent regulatory frameworks regarding medical device approvals influence market entry and operations. The market also faces competition from alternative imaging modalities like MRI and ultrasound. Growing prevalence of chronic diseases, expanding healthcare infrastructure, and rising disposable incomes across the region contribute to market expansion. M&A activity, while not extremely high, is steadily increasing, with larger players acquiring smaller companies to expand their product portfolios and market reach.
- Market Concentration: Moderately concentrated, with top 5 players holding approximately xx% market share in 2024.
- Technological Innovation: Focus on AI-powered image analysis, multi-slice technology, and dose reduction techniques.
- Regulatory Framework: Stringent regulatory approvals across different APAC countries.
- Competitive Substitutes: MRI, Ultrasound, and other advanced imaging technologies.
- End-User Demographics: Shift towards aging population driving demand for diagnostic imaging.
- M&A Trends: Moderate level of M&A activity, with strategic acquisitions driving market consolidation.
APAC CT Industry Growth Trends & Insights
The APAC CT market exhibited strong growth during the historical period (2019-2024), driven by factors such as increasing healthcare expenditure, rising prevalence of chronic diseases, and technological advancements. The market is expected to maintain a robust Compound Annual Growth Rate (CAGR) of xx% during the forecast period (2025-2033). Adoption rates are increasing, particularly in rapidly developing economies with expanding healthcare infrastructure. Technological disruptions, such as the integration of AI and machine learning into CT systems, are significantly impacting market dynamics, improving diagnostic accuracy and efficiency. Consumer behavior is shifting towards demand for higher-quality, faster, and more patient-friendly imaging solutions. Market penetration is expected to increase across various segments, especially in rural and underserved areas. The market size is estimated at xx Million units in 2025 and projected to reach xx Million units by 2033.
Dominant Regions, Countries, or Segments in APAC CT Industry
China and India are the dominant markets in the APAC CT industry, owing to their large populations, expanding healthcare infrastructure, and rising prevalence of chronic diseases. Within the segment breakdown:
- Type: High-slice CT scanners are dominating the market due to their superior image quality and faster scan times.
- Application: Oncology and Cardiovascular applications are major contributors to the market growth due to the high prevalence of related diseases.
- End-User: Hospitals represent the largest end-user segment due to their sophisticated diagnostic capabilities and high patient volumes.
Key growth drivers include favorable government policies supporting healthcare infrastructure development, increased investments in healthcare technology, and rising awareness about preventative healthcare. The strong growth potential in these regions is further driven by economic development and improvements in healthcare access.
APAC CT Industry Product Landscape
The APAC CT industry features a diverse product landscape, encompassing various types of CT scanners (low-slice, medium-slice, and high-slice) with varying functionalities and technological advancements. Manufacturers are focusing on improving image quality, reducing radiation dose, and enhancing speed and efficiency. Unique selling propositions include AI-powered image analysis, advanced reconstruction algorithms, and integrated workflow solutions. Technological advancements focus on multi-slice technology, iterative reconstruction, and spectral CT imaging, leading to better diagnostic accuracy and patient care.
Key Drivers, Barriers & Challenges in APAC CT Industry
Key Drivers:
- Rising prevalence of chronic diseases like cancer and cardiovascular diseases.
- Increasing healthcare expenditure and investments in medical infrastructure.
- Technological advancements in CT scanner technology, leading to improved image quality and reduced radiation dose.
- Growing awareness and demand for advanced diagnostic imaging techniques.
Challenges:
- High cost of CT scanners and associated maintenance.
- Stringent regulatory requirements and approvals for medical devices.
- Skilled personnel shortage in some regions.
- Competition from alternative imaging modalities.
Emerging Opportunities in APAP CT Industry
Emerging opportunities within the APAC CT industry include:
- Expansion into untapped markets in rural and underserved areas.
- Development of cost-effective and portable CT scanners for improved accessibility.
- Integration of AI and machine learning for enhanced diagnostic accuracy and workflow efficiency.
- Growing demand for specialized CT applications, such as cardiac CT and spectral CT.
Growth Accelerators in the APAC CT Industry
Long-term growth in the APAC CT industry will be fueled by technological innovations, such as AI-powered image analysis and spectral CT, improving diagnostic capabilities and efficiency. Strategic partnerships between manufacturers and healthcare providers will facilitate wider market adoption. Government initiatives to improve healthcare infrastructure and accessibility will further drive market growth. Expansion into underserved regions and the development of tailored solutions for specific needs will also contribute to sustained expansion.
Key Players Shaping the APAC CT Industry Market
- GE Healthcare
- Koning Corporation
- Neusoft Medical Systems Co Ltd
- NeuroLogica Corporation
- Koninklijke Philips NV
- Canon Medical Systems Corporation
- Hitachi Healthcare Systems
- Siemens Healthineers
- Shenzhen Anke High-Tech Co Ltd
- Fujifilm Holdings Corporation
- List Not Exhaustive
Notable Milestones in APAC CT Industry Sector
- December 2022: Fujifilm India partnered with Soorya Diagnostics LLP Center in Tirur, Kerala, installing a new CT scan machine to improve healthcare access.
- May 2022: Bayer Korea launched MEDRAD Centargo, a CT injection device, approved by the Ministry of Food and Drug Safety.
In-Depth APAC CT Industry Market Outlook
The APAC CT industry is poised for significant growth in the coming years. Continued technological advancements, strategic collaborations, and supportive government policies will drive market expansion. Untapped potential exists in emerging economies and underserved communities, presenting substantial opportunities for market players. Focus on innovative applications, such as AI-powered diagnostics and personalized medicine, will further fuel market growth. The long-term outlook remains positive, with substantial potential for both established players and new entrants.
APAC CT Industry Segmentation
-
1. Type
- 1.1. Low Slice
- 1.2. Medium Slice
- 1.3. High Slice
-
2. Application
- 2.1. Oncology
- 2.2. Neurology
- 2.3. Cardiovascular
- 2.4. Musculoskeletal
- 2.5. Other Applications
-
3. End-User
- 3.1. Hospitals
- 3.2. Clinics
- 3.3. Diagnostic Services
- 3.4. Other End-Users
-
4. Geography
- 4.1. China
- 4.2. Japan
- 4.3. India
- 4.4. Australia
- 4.5. South Korea
- 4.6. Rest of Asia-Pacific
APAC CT Industry Segmentation By Geography
- 1. China
- 2. Japan
- 3. India
- 4. Australia
- 5. South Korea
- 6. Rest of Asia Pacific
APAC CT Industry REPORT HIGHLIGHTS
| Aspects | Details |
|---|---|
| Study Period | 2019-2033 |
| Base Year | 2024 |
| Estimated Year | 2025 |
| Forecast Period | 2025-2033 |
| Historical Period | 2019-2024 |
| Growth Rate | CAGR of 6.46% from 2019-2033 |
| Segmentation |
|
Table of Contents
- 1. Introduction
- 1.1. Research Scope
- 1.2. Market Segmentation
- 1.3. Research Methodology
- 1.4. Definitions and Assumptions
- 2. Executive Summary
- 2.1. Introduction
- 3. Market Dynamics
- 3.1. Introduction
- 3.2. Market Drivers
- 3.2.1. Rising Geriatric Population and Increase in Incidences of Chronic Diseases; Increase in Shift of Medical Care Toward Image-guided Interventions; Technological Advancements
- 3.3. Market Restrains
- 3.3.1. Lack of Adequate Reimbursement; Stringent Regulatory Framework
- 3.4. Market Trends
- 3.4.1. Oncology Segment is Expected to Account for Largest Market Share During the Forecast Period
- 4. Market Factor Analysis
- 4.1. Porters Five Forces
- 4.2. Supply/Value Chain
- 4.3. PESTEL analysis
- 4.4. Market Entropy
- 4.5. Patent/Trademark Analysis
- 5. Global APAC CT Industry Analysis, Insights and Forecast, 2019-2031
- 5.1. Market Analysis, Insights and Forecast - by Type
- 5.1.1. Low Slice
- 5.1.2. Medium Slice
- 5.1.3. High Slice
- 5.2. Market Analysis, Insights and Forecast - by Application
- 5.2.1. Oncology
- 5.2.2. Neurology
- 5.2.3. Cardiovascular
- 5.2.4. Musculoskeletal
- 5.2.5. Other Applications
- 5.3. Market Analysis, Insights and Forecast - by End-User
- 5.3.1. Hospitals
- 5.3.2. Clinics
- 5.3.3. Diagnostic Services
- 5.3.4. Other End-Users
- 5.4. Market Analysis, Insights and Forecast - by Geography
- 5.4.1. China
- 5.4.2. Japan
- 5.4.3. India
- 5.4.4. Australia
- 5.4.5. South Korea
- 5.4.6. Rest of Asia-Pacific
- 5.5. Market Analysis, Insights and Forecast - by Region
- 5.5.1. China
- 5.5.2. Japan
- 5.5.3. India
- 5.5.4. Australia
- 5.5.5. South Korea
- 5.5.6. Rest of Asia Pacific
- 5.1. Market Analysis, Insights and Forecast - by Type
- 6. China APAC CT Industry Analysis, Insights and Forecast, 2019-2031
- 6.1. Market Analysis, Insights and Forecast - by Type
- 6.1.1. Low Slice
- 6.1.2. Medium Slice
- 6.1.3. High Slice
- 6.2. Market Analysis, Insights and Forecast - by Application
- 6.2.1. Oncology
- 6.2.2. Neurology
- 6.2.3. Cardiovascular
- 6.2.4. Musculoskeletal
- 6.2.5. Other Applications
- 6.3. Market Analysis, Insights and Forecast - by End-User
- 6.3.1. Hospitals
- 6.3.2. Clinics
- 6.3.3. Diagnostic Services
- 6.3.4. Other End-Users
- 6.4. Market Analysis, Insights and Forecast - by Geography
- 6.4.1. China
- 6.4.2. Japan
- 6.4.3. India
- 6.4.4. Australia
- 6.4.5. South Korea
- 6.4.6. Rest of Asia-Pacific
- 6.1. Market Analysis, Insights and Forecast - by Type
- 7. Japan APAC CT Industry Analysis, Insights and Forecast, 2019-2031
- 7.1. Market Analysis, Insights and Forecast - by Type
- 7.1.1. Low Slice
- 7.1.2. Medium Slice
- 7.1.3. High Slice
- 7.2. Market Analysis, Insights and Forecast - by Application
- 7.2.1. Oncology
- 7.2.2. Neurology
- 7.2.3. Cardiovascular
- 7.2.4. Musculoskeletal
- 7.2.5. Other Applications
- 7.3. Market Analysis, Insights and Forecast - by End-User
- 7.3.1. Hospitals
- 7.3.2. Clinics
- 7.3.3. Diagnostic Services
- 7.3.4. Other End-Users
- 7.4. Market Analysis, Insights and Forecast - by Geography
- 7.4.1. China
- 7.4.2. Japan
- 7.4.3. India
- 7.4.4. Australia
- 7.4.5. South Korea
- 7.4.6. Rest of Asia-Pacific
- 7.1. Market Analysis, Insights and Forecast - by Type
- 8. India APAC CT Industry Analysis, Insights and Forecast, 2019-2031
- 8.1. Market Analysis, Insights and Forecast - by Type
- 8.1.1. Low Slice
- 8.1.2. Medium Slice
- 8.1.3. High Slice
- 8.2. Market Analysis, Insights and Forecast - by Application
- 8.2.1. Oncology
- 8.2.2. Neurology
- 8.2.3. Cardiovascular
- 8.2.4. Musculoskeletal
- 8.2.5. Other Applications
- 8.3. Market Analysis, Insights and Forecast - by End-User
- 8.3.1. Hospitals
- 8.3.2. Clinics
- 8.3.3. Diagnostic Services
- 8.3.4. Other End-Users
- 8.4. Market Analysis, Insights and Forecast - by Geography
- 8.4.1. China
- 8.4.2. Japan
- 8.4.3. India
- 8.4.4. Australia
- 8.4.5. South Korea
- 8.4.6. Rest of Asia-Pacific
- 8.1. Market Analysis, Insights and Forecast - by Type
- 9. Australia APAC CT Industry Analysis, Insights and Forecast, 2019-2031
- 9.1. Market Analysis, Insights and Forecast - by Type
- 9.1.1. Low Slice
- 9.1.2. Medium Slice
- 9.1.3. High Slice
- 9.2. Market Analysis, Insights and Forecast - by Application
- 9.2.1. Oncology
- 9.2.2. Neurology
- 9.2.3. Cardiovascular
- 9.2.4. Musculoskeletal
- 9.2.5. Other Applications
- 9.3. Market Analysis, Insights and Forecast - by End-User
- 9.3.1. Hospitals
- 9.3.2. Clinics
- 9.3.3. Diagnostic Services
- 9.3.4. Other End-Users
- 9.4. Market Analysis, Insights and Forecast - by Geography
- 9.4.1. China
- 9.4.2. Japan
- 9.4.3. India
- 9.4.4. Australia
- 9.4.5. South Korea
- 9.4.6. Rest of Asia-Pacific
- 9.1. Market Analysis, Insights and Forecast - by Type
- 10. South Korea APAC CT Industry Analysis, Insights and Forecast, 2019-2031
- 10.1. Market Analysis, Insights and Forecast - by Type
- 10.1.1. Low Slice
- 10.1.2. Medium Slice
- 10.1.3. High Slice
- 10.2. Market Analysis, Insights and Forecast - by Application
- 10.2.1. Oncology
- 10.2.2. Neurology
- 10.2.3. Cardiovascular
- 10.2.4. Musculoskeletal
- 10.2.5. Other Applications
- 10.3. Market Analysis, Insights and Forecast - by End-User
- 10.3.1. Hospitals
- 10.3.2. Clinics
- 10.3.3. Diagnostic Services
- 10.3.4. Other End-Users
- 10.4. Market Analysis, Insights and Forecast - by Geography
- 10.4.1. China
- 10.4.2. Japan
- 10.4.3. India
- 10.4.4. Australia
- 10.4.5. South Korea
- 10.4.6. Rest of Asia-Pacific
- 10.1. Market Analysis, Insights and Forecast - by Type
- 11. Rest of Asia Pacific APAC CT Industry Analysis, Insights and Forecast, 2019-2031
- 11.1. Market Analysis, Insights and Forecast - by Type
- 11.1.1. Low Slice
- 11.1.2. Medium Slice
- 11.1.3. High Slice
- 11.2. Market Analysis, Insights and Forecast - by Application
- 11.2.1. Oncology
- 11.2.2. Neurology
- 11.2.3. Cardiovascular
- 11.2.4. Musculoskeletal
- 11.2.5. Other Applications
- 11.3. Market Analysis, Insights and Forecast - by End-User
- 11.3.1. Hospitals
- 11.3.2. Clinics
- 11.3.3. Diagnostic Services
- 11.3.4. Other End-Users
- 11.4. Market Analysis, Insights and Forecast - by Geography
- 11.4.1. China
- 11.4.2. Japan
- 11.4.3. India
- 11.4.4. Australia
- 11.4.5. South Korea
- 11.4.6. Rest of Asia-Pacific
- 11.1. Market Analysis, Insights and Forecast - by Type
- 12. China APAC CT Industry Analysis, Insights and Forecast, 2019-2031
- 13. Japan APAC CT Industry Analysis, Insights and Forecast, 2019-2031
- 14. India APAC CT Industry Analysis, Insights and Forecast, 2019-2031
- 15. South Korea APAC CT Industry Analysis, Insights and Forecast, 2019-2031
- 16. Southeast Asia APAC CT Industry Analysis, Insights and Forecast, 2019-2031
- 17. Australia APAC CT Industry Analysis, Insights and Forecast, 2019-2031
- 18. Rest of Asia Pacific APAC CT Industry Analysis, Insights and Forecast, 2019-2031
- 19. Competitive Analysis
- 19.1. Global Market Share Analysis 2024
- 19.2. Company Profiles
- 19.2.1 GE Healthcare
- 19.2.1.1. Overview
- 19.2.1.2. Products
- 19.2.1.3. SWOT Analysis
- 19.2.1.4. Recent Developments
- 19.2.1.5. Financials (Based on Availability)
- 19.2.2 Koning Corporation
- 19.2.2.1. Overview
- 19.2.2.2. Products
- 19.2.2.3. SWOT Analysis
- 19.2.2.4. Recent Developments
- 19.2.2.5. Financials (Based on Availability)
- 19.2.3 Neusoft Medical Systems Co Ltd
- 19.2.3.1. Overview
- 19.2.3.2. Products
- 19.2.3.3. SWOT Analysis
- 19.2.3.4. Recent Developments
- 19.2.3.5. Financials (Based on Availability)
- 19.2.4 NeuroLogica Corporation
- 19.2.4.1. Overview
- 19.2.4.2. Products
- 19.2.4.3. SWOT Analysis
- 19.2.4.4. Recent Developments
- 19.2.4.5. Financials (Based on Availability)
- 19.2.5 Koninklijke Philips NV
- 19.2.5.1. Overview
- 19.2.5.2. Products
- 19.2.5.3. SWOT Analysis
- 19.2.5.4. Recent Developments
- 19.2.5.5. Financials (Based on Availability)
- 19.2.6 Canon Medical Systems Corporation
- 19.2.6.1. Overview
- 19.2.6.2. Products
- 19.2.6.3. SWOT Analysis
- 19.2.6.4. Recent Developments
- 19.2.6.5. Financials (Based on Availability)
- 19.2.7 Hitachi Healthcare Systems
- 19.2.7.1. Overview
- 19.2.7.2. Products
- 19.2.7.3. SWOT Analysis
- 19.2.7.4. Recent Developments
- 19.2.7.5. Financials (Based on Availability)
- 19.2.8 Siemens Healthineers*List Not Exhaustive
- 19.2.8.1. Overview
- 19.2.8.2. Products
- 19.2.8.3. SWOT Analysis
- 19.2.8.4. Recent Developments
- 19.2.8.5. Financials (Based on Availability)
- 19.2.9 Shenzhen Anke High-Tech Co Ltd
- 19.2.9.1. Overview
- 19.2.9.2. Products
- 19.2.9.3. SWOT Analysis
- 19.2.9.4. Recent Developments
- 19.2.9.5. Financials (Based on Availability)
- 19.2.10 Fujifilm Holdings Corporation
- 19.2.10.1. Overview
- 19.2.10.2. Products
- 19.2.10.3. SWOT Analysis
- 19.2.10.4. Recent Developments
- 19.2.10.5. Financials (Based on Availability)
- 19.2.1 GE Healthcare
List of Figures
- Figure 1: Global APAC CT Industry Revenue Breakdown (Million, %) by Region 2024 & 2032
- Figure 2: Asia Pacific APAC CT Industry Revenue (Million), by Country 2024 & 2032
- Figure 3: Asia Pacific APAC CT Industry Revenue Share (%), by Country 2024 & 2032
- Figure 4: China APAC CT Industry Revenue (Million), by Type 2024 & 2032
- Figure 5: China APAC CT Industry Revenue Share (%), by Type 2024 & 2032
- Figure 6: China APAC CT Industry Revenue (Million), by Application 2024 & 2032
- Figure 7: China APAC CT Industry Revenue Share (%), by Application 2024 & 2032
- Figure 8: China APAC CT Industry Revenue (Million), by End-User 2024 & 2032
- Figure 9: China APAC CT Industry Revenue Share (%), by End-User 2024 & 2032
- Figure 10: China APAC CT Industry Revenue (Million), by Geography 2024 & 2032
- Figure 11: China APAC CT Industry Revenue Share (%), by Geography 2024 & 2032
- Figure 12: China APAC CT Industry Revenue (Million), by Country 2024 & 2032
- Figure 13: China APAC CT Industry Revenue Share (%), by Country 2024 & 2032
- Figure 14: Japan APAC CT Industry Revenue (Million), by Type 2024 & 2032
- Figure 15: Japan APAC CT Industry Revenue Share (%), by Type 2024 & 2032
- Figure 16: Japan APAC CT Industry Revenue (Million), by Application 2024 & 2032
- Figure 17: Japan APAC CT Industry Revenue Share (%), by Application 2024 & 2032
- Figure 18: Japan APAC CT Industry Revenue (Million), by End-User 2024 & 2032
- Figure 19: Japan APAC CT Industry Revenue Share (%), by End-User 2024 & 2032
- Figure 20: Japan APAC CT Industry Revenue (Million), by Geography 2024 & 2032
- Figure 21: Japan APAC CT Industry Revenue Share (%), by Geography 2024 & 2032
- Figure 22: Japan APAC CT Industry Revenue (Million), by Country 2024 & 2032
- Figure 23: Japan APAC CT Industry Revenue Share (%), by Country 2024 & 2032
- Figure 24: India APAC CT Industry Revenue (Million), by Type 2024 & 2032
- Figure 25: India APAC CT Industry Revenue Share (%), by Type 2024 & 2032
- Figure 26: India APAC CT Industry Revenue (Million), by Application 2024 & 2032
- Figure 27: India APAC CT Industry Revenue Share (%), by Application 2024 & 2032
- Figure 28: India APAC CT Industry Revenue (Million), by End-User 2024 & 2032
- Figure 29: India APAC CT Industry Revenue Share (%), by End-User 2024 & 2032
- Figure 30: India APAC CT Industry Revenue (Million), by Geography 2024 & 2032
- Figure 31: India APAC CT Industry Revenue Share (%), by Geography 2024 & 2032
- Figure 32: India APAC CT Industry Revenue (Million), by Country 2024 & 2032
- Figure 33: India APAC CT Industry Revenue Share (%), by Country 2024 & 2032
- Figure 34: Australia APAC CT Industry Revenue (Million), by Type 2024 & 2032
- Figure 35: Australia APAC CT Industry Revenue Share (%), by Type 2024 & 2032
- Figure 36: Australia APAC CT Industry Revenue (Million), by Application 2024 & 2032
- Figure 37: Australia APAC CT Industry Revenue Share (%), by Application 2024 & 2032
- Figure 38: Australia APAC CT Industry Revenue (Million), by End-User 2024 & 2032
- Figure 39: Australia APAC CT Industry Revenue Share (%), by End-User 2024 & 2032
- Figure 40: Australia APAC CT Industry Revenue (Million), by Geography 2024 & 2032
- Figure 41: Australia APAC CT Industry Revenue Share (%), by Geography 2024 & 2032
- Figure 42: Australia APAC CT Industry Revenue (Million), by Country 2024 & 2032
- Figure 43: Australia APAC CT Industry Revenue Share (%), by Country 2024 & 2032
- Figure 44: South Korea APAC CT Industry Revenue (Million), by Type 2024 & 2032
- Figure 45: South Korea APAC CT Industry Revenue Share (%), by Type 2024 & 2032
- Figure 46: South Korea APAC CT Industry Revenue (Million), by Application 2024 & 2032
- Figure 47: South Korea APAC CT Industry Revenue Share (%), by Application 2024 & 2032
- Figure 48: South Korea APAC CT Industry Revenue (Million), by End-User 2024 & 2032
- Figure 49: South Korea APAC CT Industry Revenue Share (%), by End-User 2024 & 2032
- Figure 50: South Korea APAC CT Industry Revenue (Million), by Geography 2024 & 2032
- Figure 51: South Korea APAC CT Industry Revenue Share (%), by Geography 2024 & 2032
- Figure 52: South Korea APAC CT Industry Revenue (Million), by Country 2024 & 2032
- Figure 53: South Korea APAC CT Industry Revenue Share (%), by Country 2024 & 2032
- Figure 54: Rest of Asia Pacific APAC CT Industry Revenue (Million), by Type 2024 & 2032
- Figure 55: Rest of Asia Pacific APAC CT Industry Revenue Share (%), by Type 2024 & 2032
- Figure 56: Rest of Asia Pacific APAC CT Industry Revenue (Million), by Application 2024 & 2032
- Figure 57: Rest of Asia Pacific APAC CT Industry Revenue Share (%), by Application 2024 & 2032
- Figure 58: Rest of Asia Pacific APAC CT Industry Revenue (Million), by End-User 2024 & 2032
- Figure 59: Rest of Asia Pacific APAC CT Industry Revenue Share (%), by End-User 2024 & 2032
- Figure 60: Rest of Asia Pacific APAC CT Industry Revenue (Million), by Geography 2024 & 2032
- Figure 61: Rest of Asia Pacific APAC CT Industry Revenue Share (%), by Geography 2024 & 2032
- Figure 62: Rest of Asia Pacific APAC CT Industry Revenue (Million), by Country 2024 & 2032
- Figure 63: Rest of Asia Pacific APAC CT Industry Revenue Share (%), by Country 2024 & 2032
List of Tables
- Table 1: Global APAC CT Industry Revenue Million Forecast, by Region 2019 & 2032
- Table 2: Global APAC CT Industry Revenue Million Forecast, by Type 2019 & 2032
- Table 3: Global APAC CT Industry Revenue Million Forecast, by Application 2019 & 2032
- Table 4: Global APAC CT Industry Revenue Million Forecast, by End-User 2019 & 2032
- Table 5: Global APAC CT Industry Revenue Million Forecast, by Geography 2019 & 2032
- Table 6: Global APAC CT Industry Revenue Million Forecast, by Region 2019 & 2032
- Table 7: Global APAC CT Industry Revenue Million Forecast, by Country 2019 & 2032
- Table 8: China APAC CT Industry Revenue (Million) Forecast, by Application 2019 & 2032
- Table 9: Japan APAC CT Industry Revenue (Million) Forecast, by Application 2019 & 2032
- Table 10: India APAC CT Industry Revenue (Million) Forecast, by Application 2019 & 2032
- Table 11: South Korea APAC CT Industry Revenue (Million) Forecast, by Application 2019 & 2032
- Table 12: Southeast Asia APAC CT Industry Revenue (Million) Forecast, by Application 2019 & 2032
- Table 13: Australia APAC CT Industry Revenue (Million) Forecast, by Application 2019 & 2032
- Table 14: Rest of Asia Pacific APAC CT Industry Revenue (Million) Forecast, by Application 2019 & 2032
- Table 15: Global APAC CT Industry Revenue Million Forecast, by Type 2019 & 2032
- Table 16: Global APAC CT Industry Revenue Million Forecast, by Application 2019 & 2032
- Table 17: Global APAC CT Industry Revenue Million Forecast, by End-User 2019 & 2032
- Table 18: Global APAC CT Industry Revenue Million Forecast, by Geography 2019 & 2032
- Table 19: Global APAC CT Industry Revenue Million Forecast, by Country 2019 & 2032
- Table 20: Global APAC CT Industry Revenue Million Forecast, by Type 2019 & 2032
- Table 21: Global APAC CT Industry Revenue Million Forecast, by Application 2019 & 2032
- Table 22: Global APAC CT Industry Revenue Million Forecast, by End-User 2019 & 2032
- Table 23: Global APAC CT Industry Revenue Million Forecast, by Geography 2019 & 2032
- Table 24: Global APAC CT Industry Revenue Million Forecast, by Country 2019 & 2032
- Table 25: Global APAC CT Industry Revenue Million Forecast, by Type 2019 & 2032
- Table 26: Global APAC CT Industry Revenue Million Forecast, by Application 2019 & 2032
- Table 27: Global APAC CT Industry Revenue Million Forecast, by End-User 2019 & 2032
- Table 28: Global APAC CT Industry Revenue Million Forecast, by Geography 2019 & 2032
- Table 29: Global APAC CT Industry Revenue Million Forecast, by Country 2019 & 2032
- Table 30: Global APAC CT Industry Revenue Million Forecast, by Type 2019 & 2032
- Table 31: Global APAC CT Industry Revenue Million Forecast, by Application 2019 & 2032
- Table 32: Global APAC CT Industry Revenue Million Forecast, by End-User 2019 & 2032
- Table 33: Global APAC CT Industry Revenue Million Forecast, by Geography 2019 & 2032
- Table 34: Global APAC CT Industry Revenue Million Forecast, by Country 2019 & 2032
- Table 35: Global APAC CT Industry Revenue Million Forecast, by Type 2019 & 2032
- Table 36: Global APAC CT Industry Revenue Million Forecast, by Application 2019 & 2032
- Table 37: Global APAC CT Industry Revenue Million Forecast, by End-User 2019 & 2032
- Table 38: Global APAC CT Industry Revenue Million Forecast, by Geography 2019 & 2032
- Table 39: Global APAC CT Industry Revenue Million Forecast, by Country 2019 & 2032
- Table 40: Global APAC CT Industry Revenue Million Forecast, by Type 2019 & 2032
- Table 41: Global APAC CT Industry Revenue Million Forecast, by Application 2019 & 2032
- Table 42: Global APAC CT Industry Revenue Million Forecast, by End-User 2019 & 2032
- Table 43: Global APAC CT Industry Revenue Million Forecast, by Geography 2019 & 2032
- Table 44: Global APAC CT Industry Revenue Million Forecast, by Country 2019 & 2032
Frequently Asked Questions
1. What is the projected Compound Annual Growth Rate (CAGR) of the APAC CT Industry?
The projected CAGR is approximately 6.46%.
2. Which companies are prominent players in the APAC CT Industry?
Key companies in the market include GE Healthcare, Koning Corporation, Neusoft Medical Systems Co Ltd, NeuroLogica Corporation, Koninklijke Philips NV, Canon Medical Systems Corporation, Hitachi Healthcare Systems, Siemens Healthineers*List Not Exhaustive, Shenzhen Anke High-Tech Co Ltd, Fujifilm Holdings Corporation.
3. What are the main segments of the APAC CT Industry?
The market segments include Type, Application, End-User, Geography.
4. Can you provide details about the market size?
The market size is estimated to be USD 2.66 Million as of 2022.
5. What are some drivers contributing to market growth?
Rising Geriatric Population and Increase in Incidences of Chronic Diseases; Increase in Shift of Medical Care Toward Image-guided Interventions; Technological Advancements.
6. What are the notable trends driving market growth?
Oncology Segment is Expected to Account for Largest Market Share During the Forecast Period.
7. Are there any restraints impacting market growth?
Lack of Adequate Reimbursement; Stringent Regulatory Framework.
8. Can you provide examples of recent developments in the market?
Dec 2022: Fujifilm India partnered with Soorya Diagnostics LLP Center in Tirur, Kerala. As part of this collaboration, Fujifilm installed its most recent CT Scan machine at Soorya Diagnostics Center in order to promote screening culture and provide people in the region with access to quality healthcare services.
9. What pricing options are available for accessing the report?
Pricing options include single-user, multi-user, and enterprise licenses priced at USD 4750, USD 5250, and USD 8750 respectively.
10. Is the market size provided in terms of value or volume?
The market size is provided in terms of value, measured in Million.
11. Are there any specific market keywords associated with the report?
Yes, the market keyword associated with the report is "APAC CT Industry," which aids in identifying and referencing the specific market segment covered.
12. How do I determine which pricing option suits my needs best?
The pricing options vary based on user requirements and access needs. Individual users may opt for single-user licenses, while businesses requiring broader access may choose multi-user or enterprise licenses for cost-effective access to the report.
13. Are there any additional resources or data provided in the APAC CT Industry report?
While the report offers comprehensive insights, it's advisable to review the specific contents or supplementary materials provided to ascertain if additional resources or data are available.
14. How can I stay updated on further developments or reports in the APAC CT Industry?
To stay informed about further developments, trends, and reports in the APAC CT Industry, consider subscribing to industry newsletters, following relevant companies and organizations, or regularly checking reputable industry news sources and publications.
Methodology
Step 1 - Identification of Relevant Samples Size from Population Database


Step 2 - Approaches for Defining Global Market Size (Value, Volume* & Price*)

Note*: In applicable scenarios
Step 3 - Data Sources
Primary Research
- Web Analytics
- Survey Reports
- Research Institute
- Latest Research Reports
- Opinion Leaders
Secondary Research
- Annual Reports
- White Paper
- Latest Press Release
- Industry Association
- Paid Database
- Investor Presentations

Step 4 - Data Triangulation
Involves using different sources of information in order to increase the validity of a study
These sources are likely to be stakeholders in a program - participants, other researchers, program staff, other community members, and so on.
Then we put all data in single framework & apply various statistical tools to find out the dynamic on the market.
During the analysis stage, feedback from the stakeholder groups would be compared to determine areas of agreement as well as areas of divergence


