
Key Insights
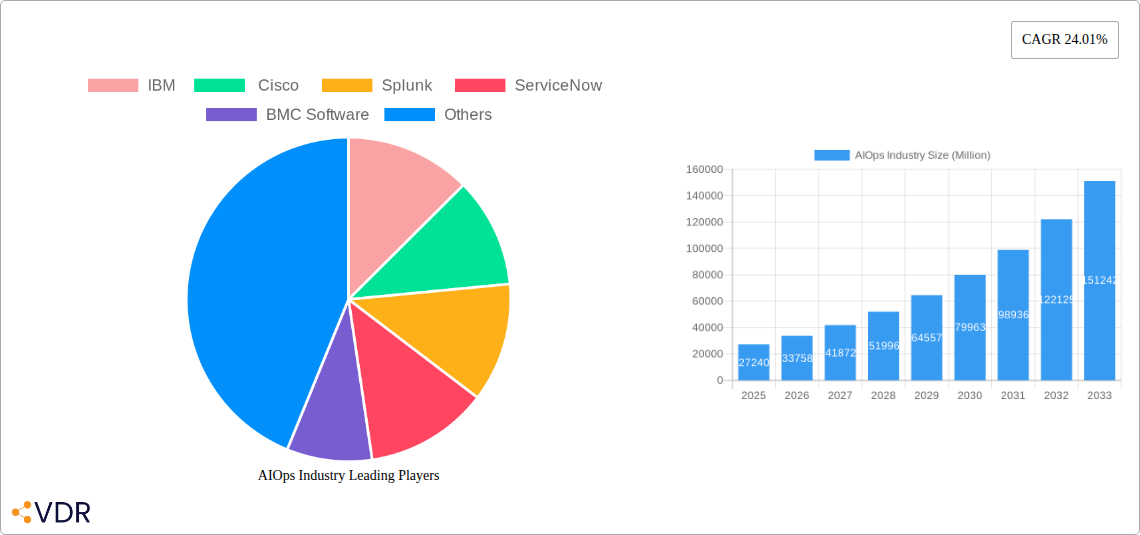
The AIOps market, valued at $27.24 billion in 2025, is experiencing robust growth, projected to expand at a Compound Annual Growth Rate (CAGR) of 24.01% from 2025 to 2033. This surge is driven by several key factors. The increasing complexity of IT infrastructures, coupled with the exponential growth of data generated by these systems, necessitates intelligent automation for efficient monitoring and management. Businesses are actively seeking to improve operational efficiency, reduce downtime, and enhance customer experience, all of which AIOps solutions directly address. The shift towards cloud-based deployments is further fueling market expansion, offering scalability and flexibility that traditional on-premise solutions lack. Specific industry verticals like BFSI (Banking, Financial Services, and Insurance), IT and Telecom, and Media and Entertainment are leading adopters, given their reliance on sophisticated IT systems and the critical need for uninterrupted operations. Large enterprises are driving a significant portion of the market demand due to their larger IT budgets and more complex infrastructure needs. Competitive landscape analysis shows established players like IBM, Cisco, Splunk, ServiceNow, and BMC Software are actively involved in innovation and market expansion, indicating a dynamic and competitive market with opportunities for both established players and emerging startups.
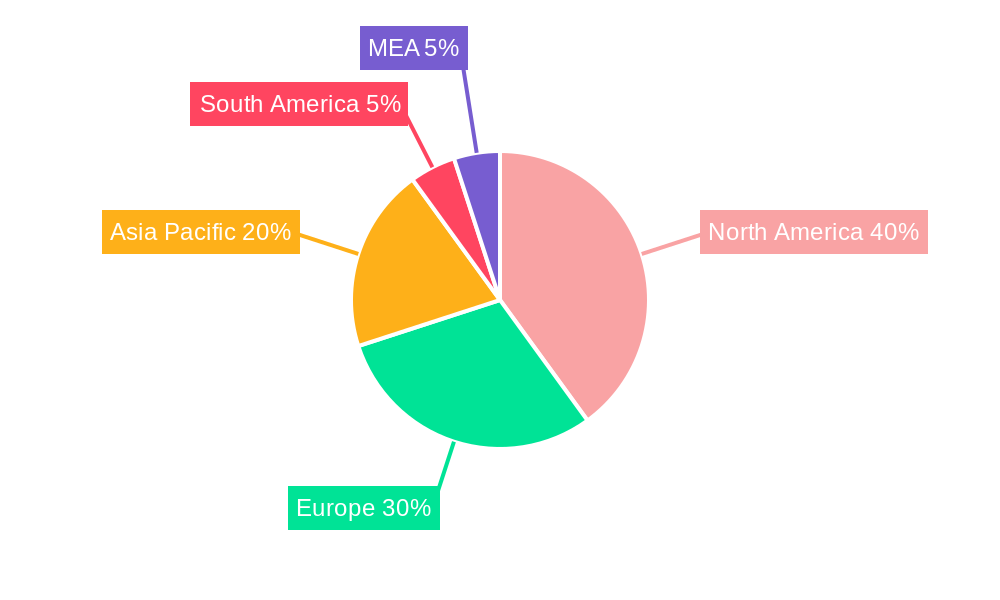
The geographical distribution of the AIOps market demonstrates significant regional variations. North America currently holds a substantial market share, driven by early adoption and strong technological advancements. However, regions like Asia-Pacific are exhibiting rapid growth, fueled by increasing digital transformation initiatives and expanding IT infrastructure investments in countries like China, India, and Japan. Europe also shows considerable potential for expansion, with strong government support for digitalization and a high concentration of tech-savvy businesses. The continued growth will likely depend on factors such as the pace of cloud adoption, advancements in AI and machine learning algorithms, and successful integration of AIOps with existing IT management tools. Addressing challenges related to data security, skilled labor shortages, and the complexity of implementing AIOps solutions effectively will be critical for sustained market growth.
AIOps Industry Market Report: 2019-2033
This comprehensive report provides a detailed analysis of the AIOps industry, encompassing market dynamics, growth trends, regional dominance, product landscapes, key players, and future outlook. The study period covers 2019-2033, with 2025 as the base and estimated year. The report leverages extensive data and insights to offer a valuable resource for industry professionals, investors, and strategic decision-makers.
The AIOps market, encompassing both the parent market of IT operations management and the child market of AI-driven solutions, is projected to reach xx Million by 2033.
AIOps Industry Market Dynamics & Structure
The AIOps market is characterized by moderate concentration, with key players such as IBM, Cisco, Splunk, ServiceNow, and BMC Software holding significant market share. However, the landscape is dynamic, with continuous technological innovation driving new entrants and product differentiation. Regulatory frameworks, particularly concerning data privacy and security, influence market growth, while the availability of robust and reliable data sources remains a crucial factor. The market also sees increased activity in mergers and acquisitions (M&A), with xx deals recorded between 2019 and 2024, representing a xx% increase from the previous period. The increasing adoption of cloud-based solutions is also pushing the market growth.
- Market Concentration: Moderately concentrated, with top 5 players holding xx% market share in 2024.
- Technological Innovation: AI/ML advancements, big data analytics, and automation are key drivers.
- Regulatory Frameworks: GDPR, CCPA, and other data privacy regulations significantly impact adoption and deployment strategies.
- Competitive Substitutes: Traditional IT monitoring tools and manual processes pose competition.
- End-User Demographics: Large enterprises currently dominate, but SME adoption is rapidly increasing.
- M&A Trends: Increasing consolidation driven by the need for enhanced capabilities and broader market reach. xx M&A deals recorded from 2019-2024.
AIOps Industry Growth Trends & Insights
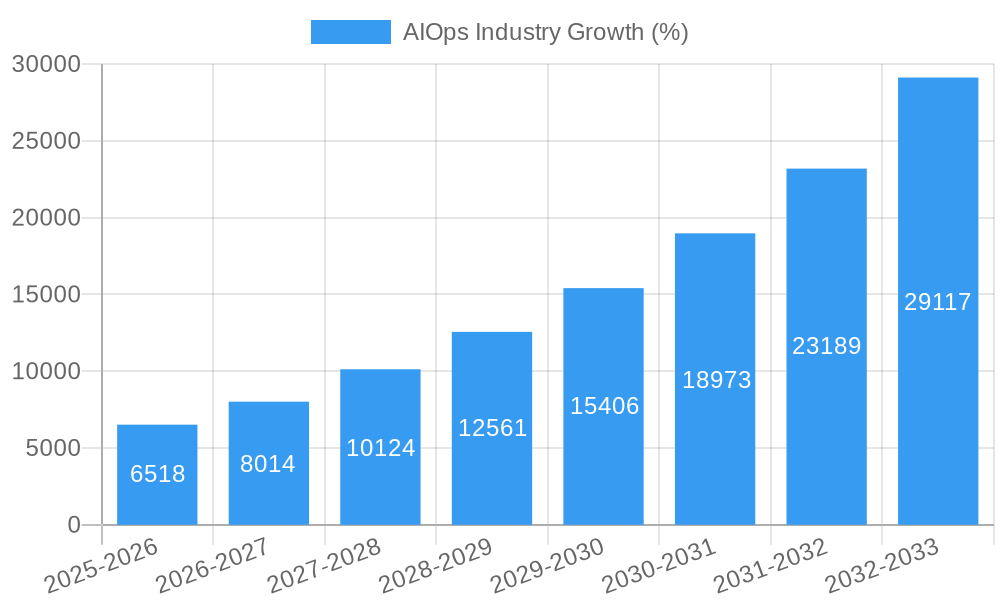
The AIOps market experienced significant growth during the historical period (2019-2024), with a CAGR of xx%. This growth is attributed to the increasing volume and complexity of IT data, the need for proactive IT management, and the rising adoption of cloud-based infrastructure. The market is projected to continue its expansion during the forecast period (2025-2033), with a projected CAGR of xx%, driven by factors such as increased digital transformation initiatives, the expansion of 5G networks, and the growing adoption of AIOps solutions across various end-user industries. The market penetration rate is expected to reach xx% by 2033. Technological disruptions, particularly advancements in AI and machine learning, are continuously reshaping the market landscape and driving greater automation and predictive capabilities. Consumer behavior shifts towards greater reliance on cloud-based services and demand for proactive IT solutions are major contributing factors.
Dominant Regions, Countries, or Segments in AIOps Industry
North America currently dominates the AIOps market, holding a xx% market share in 2024, driven by high IT spending, early adoption of advanced technologies, and the presence of major technology vendors. However, the Asia-Pacific region is expected to exhibit the highest growth rate during the forecast period due to increasing digitalization efforts and burgeoning IT infrastructure development. The Cloud/SaaS deployment model is experiencing the fastest growth, surpassing on-premise deployments, as organizations prioritize agility, scalability, and cost-effectiveness. Large enterprises represent the largest segment in terms of revenue, but SMEs are increasingly adopting AIOps solutions as their IT complexity grows. The IT and Telecom and BFSI sectors are significant end-user industries driving substantial market demand.
- Key Drivers (North America): High IT spending, early technology adoption, presence of major technology vendors.
- Key Drivers (Asia-Pacific): Increased digitalization, burgeoning IT infrastructure, government support for technology adoption.
- Cloud/SaaS Dominance: Flexibility, scalability, and cost-effectiveness drive rapid adoption.
- Large Enterprise Adoption: High IT complexity and resources justify AIOps investment.
- High-Growth End-User Sectors: IT & Telecom, BFSI, and Healthcare show strong growth potential.
AIOps Industry Product Landscape
The AIOps product landscape is characterized by a wide range of solutions catering to diverse IT needs, from basic monitoring and alerting to advanced predictive analytics and automation. Products are differentiated by their capabilities in areas like anomaly detection, root cause analysis, automated remediation, and integration with existing IT infrastructure. Key features include AI-powered insights dashboards, self-healing capabilities, and enhanced collaboration tools. Technological advancements such as explainable AI (XAI) and generative AI are enhancing the usability and effectiveness of AIOps platforms.
Key Drivers, Barriers & Challenges in AIOps Industry
Key Drivers: The increasing complexity of IT environments, the need for improved IT efficiency and cost optimization, and the growing demand for proactive IT management are all key drivers propelling AIOps market growth. The rise of cloud-based services and the adoption of DevOps methodologies are also significantly contributing factors. Government initiatives promoting digital transformation and technological advancements in AI and machine learning further enhance the market demand.
Challenges & Restraints: Data silos, integration complexities, lack of skilled professionals, and high initial investment costs pose significant barriers to wider AIOps adoption. Concerns regarding data security, privacy, and vendor lock-in also limit market expansion. Competitive pressures from established IT management vendors and emerging players also challenge market growth. The impact of these challenges, estimated at xx Million in revenue losses in 2024, is expected to decrease as technology matures and adoption increases.
Emerging Opportunities in AIOps Industry
Untapped markets in developing economies, particularly in regions with rapidly growing IT infrastructure, present significant opportunities for AIOps vendors. The integration of AIOps with other emerging technologies, such as edge computing and IoT, will unlock new applications and use cases. The increasing focus on AIOps for cybersecurity operations presents another promising avenue for growth. Finally, evolving consumer preferences towards personalized and proactive IT services will fuel market demand in the coming years.
Growth Accelerators in the AIOps Industry Industry
Technological breakthroughs in AI and machine learning, resulting in more accurate predictive analytics and automation, will significantly fuel market expansion. Strategic partnerships between AIOps vendors and cloud providers will streamline deployment and integration processes. Market expansion strategies targeting underserved industries, such as manufacturing and education, will broaden the market base.
Key Players Shaping the AIOps Industry Market
Notable Milestones in AIOps Industry Sector
- October 2022: IBM announced version 3.5 of IBM Cloud Pak for Watson AIOps, enhancing business context visualization and KPI linking.
- September 2022: Fortinet introduced AI-based network services management for 5G/LTE gateways, expanding AIOps capabilities in networking.
- March 2022: Deloitte launched AIOPS.D, a plug-and-play modular services platform for autonomous business process management.
In-Depth AIOps Industry Market Outlook
The AIOps market exhibits substantial long-term growth potential, driven by technological advancements, increased adoption across diverse industries, and the continuous need for efficient and proactive IT management. Strategic opportunities lie in developing innovative solutions leveraging AI and machine learning, expanding into untapped markets, and fostering strategic partnerships to enhance market penetration and broaden product offerings. The market is poised for significant expansion as organizations increasingly recognize the value of AIOps in optimizing their IT operations and driving business efficiency.
AIOps Industry Segmentation
-
1. Organization Type
- 1.1. Small and Medium Enterprises
- 1.2. Large Enterprise
-
2. Deployment
- 2.1. On-Premise
- 2.2. Cloud/SaaS
-
3. End-User Industry
- 3.1. Media and Entertainment
- 3.2. IT and Telecom
- 3.3. Retail
- 3.4. Healthcare
- 3.5. BFSI
- 3.6. Other End-User Industries
AIOps Industry Segmentation By Geography
- 1. North America
- 2. Europe
- 3. Asia Pacific
- 4. Latin America
- 5. Middle East and Africa
AIOps Industry REPORT HIGHLIGHTS
| Aspects | Details |
|---|---|
| Study Period | 2019-2033 |
| Base Year | 2024 |
| Estimated Year | 2025 |
| Forecast Period | 2025-2033 |
| Historical Period | 2019-2024 |
| Growth Rate | CAGR of 24.01% from 2019-2033 |
| Segmentation |
|
Table of Contents
- 1. Introduction
- 1.1. Research Scope
- 1.2. Market Segmentation
- 1.3. Research Methodology
- 1.4. Definitions and Assumptions
- 2. Executive Summary
- 2.1. Introduction
- 3. Market Dynamics
- 3.1. Introduction
- 3.2. Market Drivers
- 3.2.1. Growing demand for AI-based services in IT operations; Increasing end-to-end business application assurance and uptime
- 3.3. Market Restrains
- 3.3.1. Increasing number of changes in IT operations
- 3.4. Market Trends
- 3.4.1. BFSI is Expected to Hold Significant Share
- 4. Market Factor Analysis
- 4.1. Porters Five Forces
- 4.2. Supply/Value Chain
- 4.3. PESTEL analysis
- 4.4. Market Entropy
- 4.5. Patent/Trademark Analysis
- 5. Global AIOps Industry Analysis, Insights and Forecast, 2019-2031
- 5.1. Market Analysis, Insights and Forecast - by Organization Type
- 5.1.1. Small and Medium Enterprises
- 5.1.2. Large Enterprise
- 5.2. Market Analysis, Insights and Forecast - by Deployment
- 5.2.1. On-Premise
- 5.2.2. Cloud/SaaS
- 5.3. Market Analysis, Insights and Forecast - by End-User Industry
- 5.3.1. Media and Entertainment
- 5.3.2. IT and Telecom
- 5.3.3. Retail
- 5.3.4. Healthcare
- 5.3.5. BFSI
- 5.3.6. Other End-User Industries
- 5.4. Market Analysis, Insights and Forecast - by Region
- 5.4.1. North America
- 5.4.2. Europe
- 5.4.3. Asia Pacific
- 5.4.4. Latin America
- 5.4.5. Middle East and Africa
- 5.1. Market Analysis, Insights and Forecast - by Organization Type
- 6. North America AIOps Industry Analysis, Insights and Forecast, 2019-2031
- 6.1. Market Analysis, Insights and Forecast - by Organization Type
- 6.1.1. Small and Medium Enterprises
- 6.1.2. Large Enterprise
- 6.2. Market Analysis, Insights and Forecast - by Deployment
- 6.2.1. On-Premise
- 6.2.2. Cloud/SaaS
- 6.3. Market Analysis, Insights and Forecast - by End-User Industry
- 6.3.1. Media and Entertainment
- 6.3.2. IT and Telecom
- 6.3.3. Retail
- 6.3.4. Healthcare
- 6.3.5. BFSI
- 6.3.6. Other End-User Industries
- 6.1. Market Analysis, Insights and Forecast - by Organization Type
- 7. Europe AIOps Industry Analysis, Insights and Forecast, 2019-2031
- 7.1. Market Analysis, Insights and Forecast - by Organization Type
- 7.1.1. Small and Medium Enterprises
- 7.1.2. Large Enterprise
- 7.2. Market Analysis, Insights and Forecast - by Deployment
- 7.2.1. On-Premise
- 7.2.2. Cloud/SaaS
- 7.3. Market Analysis, Insights and Forecast - by End-User Industry
- 7.3.1. Media and Entertainment
- 7.3.2. IT and Telecom
- 7.3.3. Retail
- 7.3.4. Healthcare
- 7.3.5. BFSI
- 7.3.6. Other End-User Industries
- 7.1. Market Analysis, Insights and Forecast - by Organization Type
- 8. Asia Pacific AIOps Industry Analysis, Insights and Forecast, 2019-2031
- 8.1. Market Analysis, Insights and Forecast - by Organization Type
- 8.1.1. Small and Medium Enterprises
- 8.1.2. Large Enterprise
- 8.2. Market Analysis, Insights and Forecast - by Deployment
- 8.2.1. On-Premise
- 8.2.2. Cloud/SaaS
- 8.3. Market Analysis, Insights and Forecast - by End-User Industry
- 8.3.1. Media and Entertainment
- 8.3.2. IT and Telecom
- 8.3.3. Retail
- 8.3.4. Healthcare
- 8.3.5. BFSI
- 8.3.6. Other End-User Industries
- 8.1. Market Analysis, Insights and Forecast - by Organization Type
- 9. Latin America AIOps Industry Analysis, Insights and Forecast, 2019-2031
- 9.1. Market Analysis, Insights and Forecast - by Organization Type
- 9.1.1. Small and Medium Enterprises
- 9.1.2. Large Enterprise
- 9.2. Market Analysis, Insights and Forecast - by Deployment
- 9.2.1. On-Premise
- 9.2.2. Cloud/SaaS
- 9.3. Market Analysis, Insights and Forecast - by End-User Industry
- 9.3.1. Media and Entertainment
- 9.3.2. IT and Telecom
- 9.3.3. Retail
- 9.3.4. Healthcare
- 9.3.5. BFSI
- 9.3.6. Other End-User Industries
- 9.1. Market Analysis, Insights and Forecast - by Organization Type
- 10. Middle East and Africa AIOps Industry Analysis, Insights and Forecast, 2019-2031
- 10.1. Market Analysis, Insights and Forecast - by Organization Type
- 10.1.1. Small and Medium Enterprises
- 10.1.2. Large Enterprise
- 10.2. Market Analysis, Insights and Forecast - by Deployment
- 10.2.1. On-Premise
- 10.2.2. Cloud/SaaS
- 10.3. Market Analysis, Insights and Forecast - by End-User Industry
- 10.3.1. Media and Entertainment
- 10.3.2. IT and Telecom
- 10.3.3. Retail
- 10.3.4. Healthcare
- 10.3.5. BFSI
- 10.3.6. Other End-User Industries
- 10.1. Market Analysis, Insights and Forecast - by Organization Type
- 11. North America AIOps Industry Analysis, Insights and Forecast, 2019-2031
- 11.1. Market Analysis, Insights and Forecast - By Country/Sub-region
- 11.1.1 United States
- 11.1.2 Canada
- 11.1.3 Mexico
- 12. Europe AIOps Industry Analysis, Insights and Forecast, 2019-2031
- 12.1. Market Analysis, Insights and Forecast - By Country/Sub-region
- 12.1.1 Germany
- 12.1.2 United Kingdom
- 12.1.3 France
- 12.1.4 Spain
- 12.1.5 Italy
- 12.1.6 Spain
- 12.1.7 Belgium
- 12.1.8 Netherland
- 12.1.9 Nordics
- 12.1.10 Rest of Europe
- 13. Asia Pacific AIOps Industry Analysis, Insights and Forecast, 2019-2031
- 13.1. Market Analysis, Insights and Forecast - By Country/Sub-region
- 13.1.1 China
- 13.1.2 Japan
- 13.1.3 India
- 13.1.4 South Korea
- 13.1.5 Southeast Asia
- 13.1.6 Australia
- 13.1.7 Indonesia
- 13.1.8 Phillipes
- 13.1.9 Singapore
- 13.1.10 Thailandc
- 13.1.11 Rest of Asia Pacific
- 14. South America AIOps Industry Analysis, Insights and Forecast, 2019-2031
- 14.1. Market Analysis, Insights and Forecast - By Country/Sub-region
- 14.1.1 Brazil
- 14.1.2 Argentina
- 14.1.3 Peru
- 14.1.4 Chile
- 14.1.5 Colombia
- 14.1.6 Ecuador
- 14.1.7 Venezuela
- 14.1.8 Rest of South America
- 15. MEA AIOps Industry Analysis, Insights and Forecast, 2019-2031
- 15.1. Market Analysis, Insights and Forecast - By Country/Sub-region
- 15.1.1 United Arab Emirates
- 15.1.2 Saudi Arabia
- 15.1.3 South Africa
- 15.1.4 Rest of Middle East and Africa
- 16. Competitive Analysis
- 16.1. Global Market Share Analysis 2024
- 16.2. Company Profiles
- 16.2.1 IBM
- 16.2.1.1. Overview
- 16.2.1.2. Products
- 16.2.1.3. SWOT Analysis
- 16.2.1.4. Recent Developments
- 16.2.1.5. Financials (Based on Availability)
- 16.2.2 Cisco
- 16.2.2.1. Overview
- 16.2.2.2. Products
- 16.2.2.3. SWOT Analysis
- 16.2.2.4. Recent Developments
- 16.2.2.5. Financials (Based on Availability)
- 16.2.3 Splunk
- 16.2.3.1. Overview
- 16.2.3.2. Products
- 16.2.3.3. SWOT Analysis
- 16.2.3.4. Recent Developments
- 16.2.3.5. Financials (Based on Availability)
- 16.2.4 ServiceNow
- 16.2.4.1. Overview
- 16.2.4.2. Products
- 16.2.4.3. SWOT Analysis
- 16.2.4.4. Recent Developments
- 16.2.4.5. Financials (Based on Availability)
- 16.2.5 BMC Software
- 16.2.5.1. Overview
- 16.2.5.2. Products
- 16.2.5.3. SWOT Analysis
- 16.2.5.4. Recent Developments
- 16.2.5.5. Financials (Based on Availability)
- 16.2.1 IBM
List of Figures
- Figure 1: Global AIOps Industry Revenue Breakdown (Million, %) by Region 2024 & 2032
- Figure 2: North America AIOps Industry Revenue (Million), by Country 2024 & 2032
- Figure 3: North America AIOps Industry Revenue Share (%), by Country 2024 & 2032
- Figure 4: Europe AIOps Industry Revenue (Million), by Country 2024 & 2032
- Figure 5: Europe AIOps Industry Revenue Share (%), by Country 2024 & 2032
- Figure 6: Asia Pacific AIOps Industry Revenue (Million), by Country 2024 & 2032
- Figure 7: Asia Pacific AIOps Industry Revenue Share (%), by Country 2024 & 2032
- Figure 8: South America AIOps Industry Revenue (Million), by Country 2024 & 2032
- Figure 9: South America AIOps Industry Revenue Share (%), by Country 2024 & 2032
- Figure 10: MEA AIOps Industry Revenue (Million), by Country 2024 & 2032
- Figure 11: MEA AIOps Industry Revenue Share (%), by Country 2024 & 2032
- Figure 12: North America AIOps Industry Revenue (Million), by Organization Type 2024 & 2032
- Figure 13: North America AIOps Industry Revenue Share (%), by Organization Type 2024 & 2032
- Figure 14: North America AIOps Industry Revenue (Million), by Deployment 2024 & 2032
- Figure 15: North America AIOps Industry Revenue Share (%), by Deployment 2024 & 2032
- Figure 16: North America AIOps Industry Revenue (Million), by End-User Industry 2024 & 2032
- Figure 17: North America AIOps Industry Revenue Share (%), by End-User Industry 2024 & 2032
- Figure 18: North America AIOps Industry Revenue (Million), by Country 2024 & 2032
- Figure 19: North America AIOps Industry Revenue Share (%), by Country 2024 & 2032
- Figure 20: Europe AIOps Industry Revenue (Million), by Organization Type 2024 & 2032
- Figure 21: Europe AIOps Industry Revenue Share (%), by Organization Type 2024 & 2032
- Figure 22: Europe AIOps Industry Revenue (Million), by Deployment 2024 & 2032
- Figure 23: Europe AIOps Industry Revenue Share (%), by Deployment 2024 & 2032
- Figure 24: Europe AIOps Industry Revenue (Million), by End-User Industry 2024 & 2032
- Figure 25: Europe AIOps Industry Revenue Share (%), by End-User Industry 2024 & 2032
- Figure 26: Europe AIOps Industry Revenue (Million), by Country 2024 & 2032
- Figure 27: Europe AIOps Industry Revenue Share (%), by Country 2024 & 2032
- Figure 28: Asia Pacific AIOps Industry Revenue (Million), by Organization Type 2024 & 2032
- Figure 29: Asia Pacific AIOps Industry Revenue Share (%), by Organization Type 2024 & 2032
- Figure 30: Asia Pacific AIOps Industry Revenue (Million), by Deployment 2024 & 2032
- Figure 31: Asia Pacific AIOps Industry Revenue Share (%), by Deployment 2024 & 2032
- Figure 32: Asia Pacific AIOps Industry Revenue (Million), by End-User Industry 2024 & 2032
- Figure 33: Asia Pacific AIOps Industry Revenue Share (%), by End-User Industry 2024 & 2032
- Figure 34: Asia Pacific AIOps Industry Revenue (Million), by Country 2024 & 2032
- Figure 35: Asia Pacific AIOps Industry Revenue Share (%), by Country 2024 & 2032
- Figure 36: Latin America AIOps Industry Revenue (Million), by Organization Type 2024 & 2032
- Figure 37: Latin America AIOps Industry Revenue Share (%), by Organization Type 2024 & 2032
- Figure 38: Latin America AIOps Industry Revenue (Million), by Deployment 2024 & 2032
- Figure 39: Latin America AIOps Industry Revenue Share (%), by Deployment 2024 & 2032
- Figure 40: Latin America AIOps Industry Revenue (Million), by End-User Industry 2024 & 2032
- Figure 41: Latin America AIOps Industry Revenue Share (%), by End-User Industry 2024 & 2032
- Figure 42: Latin America AIOps Industry Revenue (Million), by Country 2024 & 2032
- Figure 43: Latin America AIOps Industry Revenue Share (%), by Country 2024 & 2032
- Figure 44: Middle East and Africa AIOps Industry Revenue (Million), by Organization Type 2024 & 2032
- Figure 45: Middle East and Africa AIOps Industry Revenue Share (%), by Organization Type 2024 & 2032
- Figure 46: Middle East and Africa AIOps Industry Revenue (Million), by Deployment 2024 & 2032
- Figure 47: Middle East and Africa AIOps Industry Revenue Share (%), by Deployment 2024 & 2032
- Figure 48: Middle East and Africa AIOps Industry Revenue (Million), by End-User Industry 2024 & 2032
- Figure 49: Middle East and Africa AIOps Industry Revenue Share (%), by End-User Industry 2024 & 2032
- Figure 50: Middle East and Africa AIOps Industry Revenue (Million), by Country 2024 & 2032
- Figure 51: Middle East and Africa AIOps Industry Revenue Share (%), by Country 2024 & 2032
List of Tables
- Table 1: Global AIOps Industry Revenue Million Forecast, by Region 2019 & 2032
- Table 2: Global AIOps Industry Revenue Million Forecast, by Organization Type 2019 & 2032
- Table 3: Global AIOps Industry Revenue Million Forecast, by Deployment 2019 & 2032
- Table 4: Global AIOps Industry Revenue Million Forecast, by End-User Industry 2019 & 2032
- Table 5: Global AIOps Industry Revenue Million Forecast, by Region 2019 & 2032
- Table 6: Global AIOps Industry Revenue Million Forecast, by Country 2019 & 2032
- Table 7: United States AIOps Industry Revenue (Million) Forecast, by Application 2019 & 2032
- Table 8: Canada AIOps Industry Revenue (Million) Forecast, by Application 2019 & 2032
- Table 9: Mexico AIOps Industry Revenue (Million) Forecast, by Application 2019 & 2032
- Table 10: Global AIOps Industry Revenue Million Forecast, by Country 2019 & 2032
- Table 11: Germany AIOps Industry Revenue (Million) Forecast, by Application 2019 & 2032
- Table 12: United Kingdom AIOps Industry Revenue (Million) Forecast, by Application 2019 & 2032
- Table 13: France AIOps Industry Revenue (Million) Forecast, by Application 2019 & 2032
- Table 14: Spain AIOps Industry Revenue (Million) Forecast, by Application 2019 & 2032
- Table 15: Italy AIOps Industry Revenue (Million) Forecast, by Application 2019 & 2032
- Table 16: Spain AIOps Industry Revenue (Million) Forecast, by Application 2019 & 2032
- Table 17: Belgium AIOps Industry Revenue (Million) Forecast, by Application 2019 & 2032
- Table 18: Netherland AIOps Industry Revenue (Million) Forecast, by Application 2019 & 2032
- Table 19: Nordics AIOps Industry Revenue (Million) Forecast, by Application 2019 & 2032
- Table 20: Rest of Europe AIOps Industry Revenue (Million) Forecast, by Application 2019 & 2032
- Table 21: Global AIOps Industry Revenue Million Forecast, by Country 2019 & 2032
- Table 22: China AIOps Industry Revenue (Million) Forecast, by Application 2019 & 2032
- Table 23: Japan AIOps Industry Revenue (Million) Forecast, by Application 2019 & 2032
- Table 24: India AIOps Industry Revenue (Million) Forecast, by Application 2019 & 2032
- Table 25: South Korea AIOps Industry Revenue (Million) Forecast, by Application 2019 & 2032
- Table 26: Southeast Asia AIOps Industry Revenue (Million) Forecast, by Application 2019 & 2032
- Table 27: Australia AIOps Industry Revenue (Million) Forecast, by Application 2019 & 2032
- Table 28: Indonesia AIOps Industry Revenue (Million) Forecast, by Application 2019 & 2032
- Table 29: Phillipes AIOps Industry Revenue (Million) Forecast, by Application 2019 & 2032
- Table 30: Singapore AIOps Industry Revenue (Million) Forecast, by Application 2019 & 2032
- Table 31: Thailandc AIOps Industry Revenue (Million) Forecast, by Application 2019 & 2032
- Table 32: Rest of Asia Pacific AIOps Industry Revenue (Million) Forecast, by Application 2019 & 2032
- Table 33: Global AIOps Industry Revenue Million Forecast, by Country 2019 & 2032
- Table 34: Brazil AIOps Industry Revenue (Million) Forecast, by Application 2019 & 2032
- Table 35: Argentina AIOps Industry Revenue (Million) Forecast, by Application 2019 & 2032
- Table 36: Peru AIOps Industry Revenue (Million) Forecast, by Application 2019 & 2032
- Table 37: Chile AIOps Industry Revenue (Million) Forecast, by Application 2019 & 2032
- Table 38: Colombia AIOps Industry Revenue (Million) Forecast, by Application 2019 & 2032
- Table 39: Ecuador AIOps Industry Revenue (Million) Forecast, by Application 2019 & 2032
- Table 40: Venezuela AIOps Industry Revenue (Million) Forecast, by Application 2019 & 2032
- Table 41: Rest of South America AIOps Industry Revenue (Million) Forecast, by Application 2019 & 2032
- Table 42: Global AIOps Industry Revenue Million Forecast, by Country 2019 & 2032
- Table 43: United Arab Emirates AIOps Industry Revenue (Million) Forecast, by Application 2019 & 2032
- Table 44: Saudi Arabia AIOps Industry Revenue (Million) Forecast, by Application 2019 & 2032
- Table 45: South Africa AIOps Industry Revenue (Million) Forecast, by Application 2019 & 2032
- Table 46: Rest of Middle East and Africa AIOps Industry Revenue (Million) Forecast, by Application 2019 & 2032
- Table 47: Global AIOps Industry Revenue Million Forecast, by Organization Type 2019 & 2032
- Table 48: Global AIOps Industry Revenue Million Forecast, by Deployment 2019 & 2032
- Table 49: Global AIOps Industry Revenue Million Forecast, by End-User Industry 2019 & 2032
- Table 50: Global AIOps Industry Revenue Million Forecast, by Country 2019 & 2032
- Table 51: Global AIOps Industry Revenue Million Forecast, by Organization Type 2019 & 2032
- Table 52: Global AIOps Industry Revenue Million Forecast, by Deployment 2019 & 2032
- Table 53: Global AIOps Industry Revenue Million Forecast, by End-User Industry 2019 & 2032
- Table 54: Global AIOps Industry Revenue Million Forecast, by Country 2019 & 2032
- Table 55: Global AIOps Industry Revenue Million Forecast, by Organization Type 2019 & 2032
- Table 56: Global AIOps Industry Revenue Million Forecast, by Deployment 2019 & 2032
- Table 57: Global AIOps Industry Revenue Million Forecast, by End-User Industry 2019 & 2032
- Table 58: Global AIOps Industry Revenue Million Forecast, by Country 2019 & 2032
- Table 59: Global AIOps Industry Revenue Million Forecast, by Organization Type 2019 & 2032
- Table 60: Global AIOps Industry Revenue Million Forecast, by Deployment 2019 & 2032
- Table 61: Global AIOps Industry Revenue Million Forecast, by End-User Industry 2019 & 2032
- Table 62: Global AIOps Industry Revenue Million Forecast, by Country 2019 & 2032
- Table 63: Global AIOps Industry Revenue Million Forecast, by Organization Type 2019 & 2032
- Table 64: Global AIOps Industry Revenue Million Forecast, by Deployment 2019 & 2032
- Table 65: Global AIOps Industry Revenue Million Forecast, by End-User Industry 2019 & 2032
- Table 66: Global AIOps Industry Revenue Million Forecast, by Country 2019 & 2032
Frequently Asked Questions
1. What is the projected Compound Annual Growth Rate (CAGR) of the AIOps Industry?
The projected CAGR is approximately 24.01%.
2. Which companies are prominent players in the AIOps Industry?
Key companies in the market include IBM , Cisco , Splunk , ServiceNow , BMC Software.
3. What are the main segments of the AIOps Industry?
The market segments include Organization Type, Deployment, End-User Industry.
4. Can you provide details about the market size?
The market size is estimated to be USD 27.24 Million as of 2022.
5. What are some drivers contributing to market growth?
Growing demand for AI-based services in IT operations; Increasing end-to-end business application assurance and uptime.
6. What are the notable trends driving market growth?
BFSI is Expected to Hold Significant Share.
7. Are there any restraints impacting market growth?
Increasing number of changes in IT operations.
8. Can you provide examples of recent developments in the market?
October 2022- IBM announced version 3.5 availability of the IBM Cloud Pak for Watson AIOps. With an emphasis on the capability to assist the users in understanding priorities among all IT stories in the context of a business line or service, IBM Cloud Pak for Watson AIOps v3.5 seeks to close this gap. Business context data is made available on an AIOps Insights Dashboard by Cloud Pak for Watson AIOps v3.5, a new offering feature in this release. It provides an illustration of the buyer context for the stakeholders to link business key performance indicators (KPIs) to application problems and rank repair options according to their potential effect.
9. What pricing options are available for accessing the report?
Pricing options include single-user, multi-user, and enterprise licenses priced at USD 4750, USD 5250, and USD 8750 respectively.
10. Is the market size provided in terms of value or volume?
The market size is provided in terms of value, measured in Million.
11. Are there any specific market keywords associated with the report?
Yes, the market keyword associated with the report is "AIOps Industry," which aids in identifying and referencing the specific market segment covered.
12. How do I determine which pricing option suits my needs best?
The pricing options vary based on user requirements and access needs. Individual users may opt for single-user licenses, while businesses requiring broader access may choose multi-user or enterprise licenses for cost-effective access to the report.
13. Are there any additional resources or data provided in the AIOps Industry report?
While the report offers comprehensive insights, it's advisable to review the specific contents or supplementary materials provided to ascertain if additional resources or data are available.
14. How can I stay updated on further developments or reports in the AIOps Industry?
To stay informed about further developments, trends, and reports in the AIOps Industry, consider subscribing to industry newsletters, following relevant companies and organizations, or regularly checking reputable industry news sources and publications.
Methodology
Step 1 - Identification of Relevant Samples Size from Population Database


Step 2 - Approaches for Defining Global Market Size (Value, Volume* & Price*)

Note*: In applicable scenarios
Step 3 - Data Sources
Primary Research
- Web Analytics
- Survey Reports
- Research Institute
- Latest Research Reports
- Opinion Leaders
Secondary Research
- Annual Reports
- White Paper
- Latest Press Release
- Industry Association
- Paid Database
- Investor Presentations

Step 4 - Data Triangulation
Involves using different sources of information in order to increase the validity of a study
These sources are likely to be stakeholders in a program - participants, other researchers, program staff, other community members, and so on.
Then we put all data in single framework & apply various statistical tools to find out the dynamic on the market.
During the analysis stage, feedback from the stakeholder groups would be compared to determine areas of agreement as well as areas of divergence


