
Key Insights
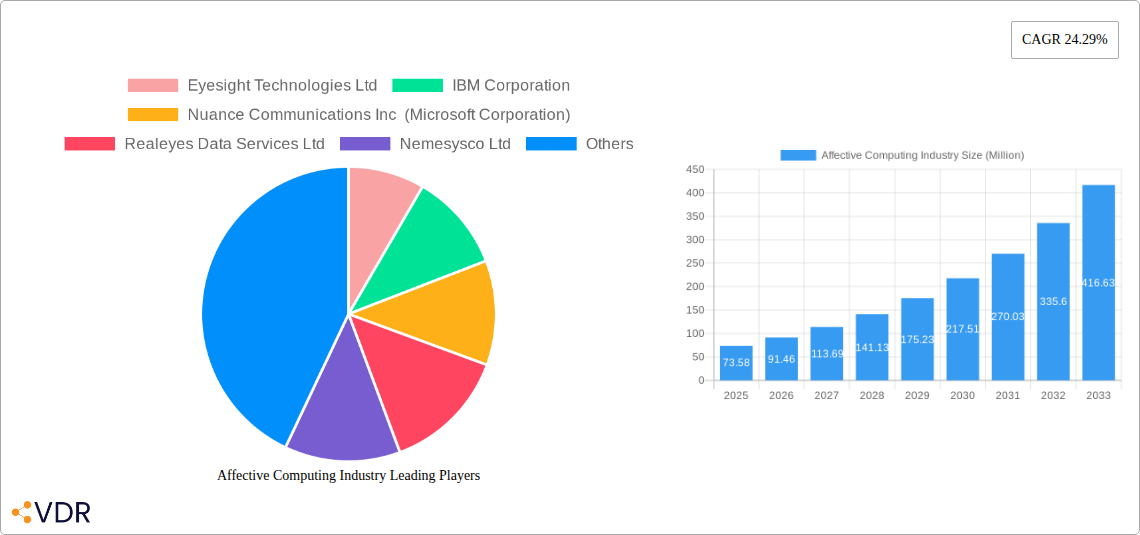
The Affective Computing market, valued at $73.58 million in 2025, is poised for significant growth, exhibiting a Compound Annual Growth Rate (CAGR) of 24.29% from 2025 to 2033. This robust expansion is driven by several key factors. Increasing demand for personalized user experiences across various sectors, particularly healthcare (patient monitoring and mental health applications) and automotive (driver monitoring and in-car assistance systems), fuels market growth. Advancements in artificial intelligence (AI) and machine learning (ML) are enabling more accurate and nuanced emotion recognition, further propelling adoption. The integration of affective computing into wearable technology and other connected devices expands market reach, while the rising awareness of mental health and the need for effective emotional support contribute to increasing demand for related solutions. However, challenges remain, including concerns around data privacy and ethical implications related to emotion recognition technologies. The market's segmentation by component (hardware and software) and end-user industry highlights the diverse applications of affective computing, with hardware components likely commanding a larger share due to the integration of sensors and processing units in devices.
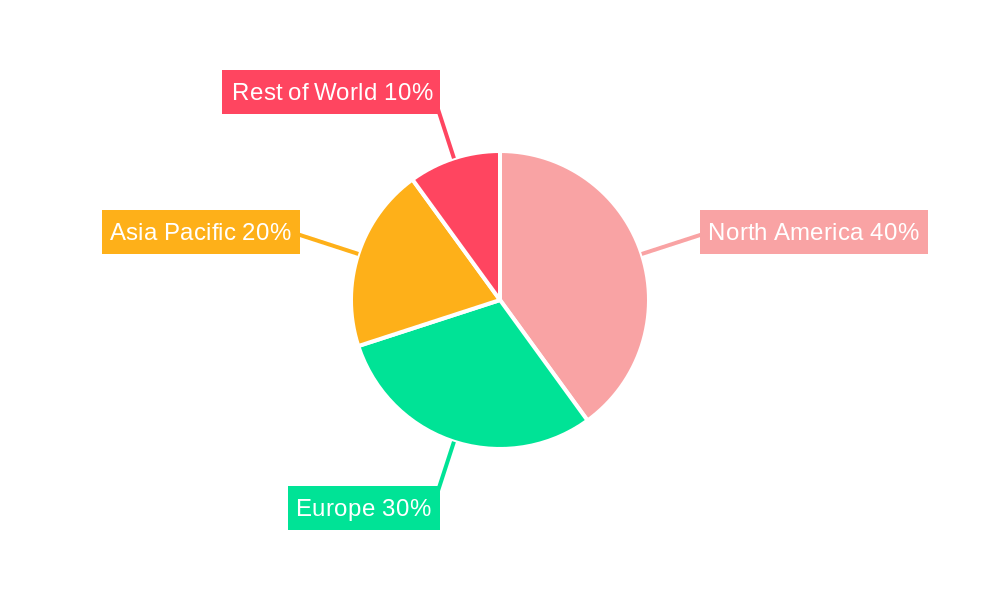
The regional breakdown reveals a strong presence across North America and Europe, driven by technological advancements and early adoption of innovative solutions. However, the Asia-Pacific region is expected to witness substantial growth, fueled by a rising middle class, increasing smartphone penetration, and a burgeoning tech industry. While precise regional market shares are not provided, based on general market trends, North America likely holds the largest share initially, followed by Europe, with Asia-Pacific showing the strongest growth potential over the forecast period. The competitive landscape is dynamic, with established tech giants like IBM and Microsoft alongside specialized firms like Eyesight Technologies and Affectiva actively vying for market share. This competition fosters innovation and drives down costs, making affective computing technology increasingly accessible. The continuous development of advanced algorithms and the expansion into new applications will be key to maintaining the market's high growth trajectory.
Affective Computing Industry Market Report: 2019-2033
This comprehensive report provides an in-depth analysis of the Affective Computing industry, covering market dynamics, growth trends, key players, and future outlook. The study period spans from 2019 to 2033, with 2025 as the base and estimated year. The report segments the market by component (Hardware, Software) and end-user industry (Healthcare, Automotive, Retail, Others), offering granular insights for informed decision-making. The market is projected to reach xx Million by 2033.
Affective Computing Industry Market Dynamics & Structure
The Affective Computing market exhibits a moderately fragmented landscape, with several established players and emerging startups vying for market share. Technological innovation, particularly in AI and machine learning, is a primary growth driver, constantly pushing the boundaries of emotion recognition and response capabilities. Regulatory frameworks surrounding data privacy and ethical considerations are shaping market dynamics, demanding robust compliance measures. The market faces competition from traditional human-centric interaction methods, however the growing demand for personalized and efficient human-computer interaction is expected to accelerate adoption. Mergers and acquisitions (M&A) activity is expected to be moderate over the forecast period, with strategic partnerships and collaborations increasing.
- Market Concentration: Moderately Fragmented
- Technological Innovation: Rapid advancements in AI and machine learning are key drivers.
- Regulatory Framework: Data privacy regulations (GDPR, CCPA) significantly influence market development.
- Competitive Substitutes: Traditional human interaction methods pose competition.
- End-User Demographics: Growing adoption across diverse sectors, particularly in healthcare and automotive.
- M&A Trends: Moderate activity anticipated, with a focus on strategic partnerships. xx M&A deals projected between 2025 and 2033.
Affective Computing Industry Growth Trends & Insights
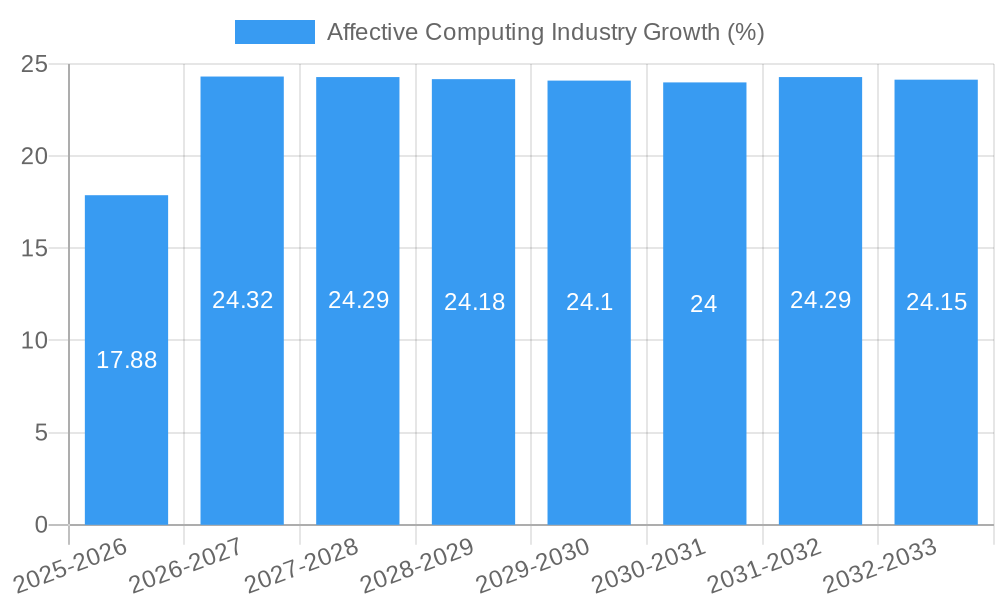
The Affective Computing market is experiencing robust growth, driven by increasing demand for personalized user experiences and the need for efficient human-computer interaction across various sectors. The market size has shown significant expansion in recent years, exhibiting a Compound Annual Growth Rate (CAGR) of xx% during the historical period (2019-2024) and is projected to grow at a CAGR of xx% during the forecast period (2025-2033). Market penetration is increasing across various sectors, with healthcare and automotive leading the adoption. Technological disruptions such as advancements in sensor technology and cloud computing are accelerating market expansion. Consumer behavior shifts towards personalized experiences and increasing comfort with AI-powered technologies are also key growth factors.
Dominant Regions, Countries, or Segments in Affective Computing Industry
North America currently holds the largest market share in the Affective Computing industry, driven by strong technological advancements and high adoption rates in the healthcare and automotive sectors. However, the Asia-Pacific region is poised for significant growth, fueled by increasing investments in AI and a burgeoning demand for personalized digital experiences.
By Component:
- Software: Holds the largest market share due to its versatility and cost-effectiveness.
- Hardware: Growth is projected to be driven by the advancements in sensor technology.
By End-user Industry:
- Healthcare: High adoption due to the potential for improved patient care and diagnostics.
- Automotive: Increasing demand for in-car infotainment systems and driver monitoring.
- Retail: Growth driven by personalized shopping experiences and improved customer engagement.
Affective Computing Industry Product Landscape
The Affective Computing industry offers a diverse range of products, including emotion recognition software, biometric sensors, and AI-powered platforms. These products leverage advanced algorithms and machine learning techniques to accurately detect and interpret human emotions, facilitating a wide array of applications in healthcare, marketing, and customer service. Recent innovations focus on improving accuracy, reducing latency, and enhancing user privacy, paving the way for wider adoption across various sectors.
Key Drivers, Barriers & Challenges in Affective Computing Industry
Key Drivers:
- Growing demand for personalized user experiences.
- Advancements in artificial intelligence and machine learning.
- Increasing adoption across diverse sectors like healthcare and automotive.
Challenges & Restraints:
- Data privacy and security concerns. xx% of businesses cite data privacy as a significant barrier.
- High implementation costs, especially for hardware-intensive applications.
- Ethical considerations surrounding emotion recognition technology.
Emerging Opportunities in Affective Computing Industry
- Untapped Markets: Expansion into developing economies, especially within healthcare and education sectors.
- Innovative Applications: Development of emotion-aware robots for education and therapy.
- Evolving Consumer Preferences: Growing demand for seamless and personalized digital experiences.
Growth Accelerators in the Affective Computing Industry
Technological breakthroughs, particularly in the areas of deep learning and computer vision, are playing a major role in accelerating the growth of the Affective Computing industry. Strategic partnerships between technology companies and healthcare providers are fostering innovation and market penetration. Market expansion into new sectors and regions, particularly developing economies, will provide considerable growth opportunities.
Key Players Shaping the Affective Computing Industry Market
- Eyesight Technologies Ltd
- IBM Corporation
- Nuance Communications Inc (Microsoft Corporation)
- Realeyes Data Services Ltd
- Nemesysco Ltd
- Kairos AR Inc
- Affectiva Inc
- Amazon Web Services Inc
- audEERING GmbH
- Emotibot Technologies Limited
- Element Human Ltd
- Gesturetek Inc
Notable Milestones in Affective Computing Industry Sector
- September 2022: Nuance Communications, Inc. expanded its Nuance Dragon TV service for Virgin Media O2, enhancing accessibility for visually impaired users.
- August 2022: CallMiner integrated with Genesys Cloud CX and Amazon Connect, providing real-time analytics capabilities for contact centers.
- May 2022: A workshop on Affective Computing and social robots in autism rehabilitation was held at Gdansk University of Technology.
In-Depth Affective Computing Industry Market Outlook
The Affective Computing industry is poised for substantial growth in the coming years, driven by continuous technological innovation and expanding applications across various sectors. Strategic partnerships, particularly in the healthcare and automotive industries, will play a crucial role in shaping market dynamics. The focus on enhancing data privacy and addressing ethical concerns will be vital for fostering trust and wider market adoption, unlocking significant growth potential and solidifying the industry’s future trajectory.
Affective Computing Industry Segmentation
-
1. Component
-
1.1. Hardware
- 1.1.1. Sensors
- 1.1.2. Cameras
- 1.1.3. Storage Devices and Processors
- 1.1.4. Other Components
-
1.2. Software
- 1.2.1. Analytics Software
- 1.2.2. Enterprise Software
- 1.2.3. Facial Recognition
- 1.2.4. Gesture Recognition
- 1.2.5. Speech Recognition
-
1.1. Hardware
-
2. End-user Industry
- 2.1. Healthcare
- 2.2. Automotive
- 2.3. Retail
- 2.4. Other End-user Industries
Affective Computing Industry Segmentation By Geography
- 1. North America
- 2. Europe
- 3. Asia
- 4. Latin America
- 5. Middle East and Africa
Affective Computing Industry REPORT HIGHLIGHTS
| Aspects | Details |
|---|---|
| Study Period | 2019-2033 |
| Base Year | 2024 |
| Estimated Year | 2025 |
| Forecast Period | 2025-2033 |
| Historical Period | 2019-2024 |
| Growth Rate | CAGR of 24.29% from 2019-2033 |
| Segmentation |
|
Table of Contents
- 1. Introduction
- 1.1. Research Scope
- 1.2. Market Segmentation
- 1.3. Research Methodology
- 1.4. Definitions and Assumptions
- 2. Executive Summary
- 2.1. Introduction
- 3. Market Dynamics
- 3.1. Introduction
- 3.2. Market Drivers
- 3.2.1. Increased Automation in Contact Centers; Increasing Adoption of Cloud-based Solutions and Online Solutions; Rising Technology Adoptions in Various Industries such as Automotive
- 3.3. Market Restrains
- 3.3.1. ; High Cost of RF Power
- 3.4. Market Trends
- 3.4.1. Rising Technology Adoptions in Various Industries such as Automotive
- 4. Market Factor Analysis
- 4.1. Porters Five Forces
- 4.2. Supply/Value Chain
- 4.3. PESTEL analysis
- 4.4. Market Entropy
- 4.5. Patent/Trademark Analysis
- 5. Global Affective Computing Industry Analysis, Insights and Forecast, 2019-2031
- 5.1. Market Analysis, Insights and Forecast - by Component
- 5.1.1. Hardware
- 5.1.1.1. Sensors
- 5.1.1.2. Cameras
- 5.1.1.3. Storage Devices and Processors
- 5.1.1.4. Other Components
- 5.1.2. Software
- 5.1.2.1. Analytics Software
- 5.1.2.2. Enterprise Software
- 5.1.2.3. Facial Recognition
- 5.1.2.4. Gesture Recognition
- 5.1.2.5. Speech Recognition
- 5.1.1. Hardware
- 5.2. Market Analysis, Insights and Forecast - by End-user Industry
- 5.2.1. Healthcare
- 5.2.2. Automotive
- 5.2.3. Retail
- 5.2.4. Other End-user Industries
- 5.3. Market Analysis, Insights and Forecast - by Region
- 5.3.1. North America
- 5.3.2. Europe
- 5.3.3. Asia
- 5.3.4. Latin America
- 5.3.5. Middle East and Africa
- 5.1. Market Analysis, Insights and Forecast - by Component
- 6. North America Affective Computing Industry Analysis, Insights and Forecast, 2019-2031
- 6.1. Market Analysis, Insights and Forecast - by Component
- 6.1.1. Hardware
- 6.1.1.1. Sensors
- 6.1.1.2. Cameras
- 6.1.1.3. Storage Devices and Processors
- 6.1.1.4. Other Components
- 6.1.2. Software
- 6.1.2.1. Analytics Software
- 6.1.2.2. Enterprise Software
- 6.1.2.3. Facial Recognition
- 6.1.2.4. Gesture Recognition
- 6.1.2.5. Speech Recognition
- 6.1.1. Hardware
- 6.2. Market Analysis, Insights and Forecast - by End-user Industry
- 6.2.1. Healthcare
- 6.2.2. Automotive
- 6.2.3. Retail
- 6.2.4. Other End-user Industries
- 6.1. Market Analysis, Insights and Forecast - by Component
- 7. Europe Affective Computing Industry Analysis, Insights and Forecast, 2019-2031
- 7.1. Market Analysis, Insights and Forecast - by Component
- 7.1.1. Hardware
- 7.1.1.1. Sensors
- 7.1.1.2. Cameras
- 7.1.1.3. Storage Devices and Processors
- 7.1.1.4. Other Components
- 7.1.2. Software
- 7.1.2.1. Analytics Software
- 7.1.2.2. Enterprise Software
- 7.1.2.3. Facial Recognition
- 7.1.2.4. Gesture Recognition
- 7.1.2.5. Speech Recognition
- 7.1.1. Hardware
- 7.2. Market Analysis, Insights and Forecast - by End-user Industry
- 7.2.1. Healthcare
- 7.2.2. Automotive
- 7.2.3. Retail
- 7.2.4. Other End-user Industries
- 7.1. Market Analysis, Insights and Forecast - by Component
- 8. Asia Affective Computing Industry Analysis, Insights and Forecast, 2019-2031
- 8.1. Market Analysis, Insights and Forecast - by Component
- 8.1.1. Hardware
- 8.1.1.1. Sensors
- 8.1.1.2. Cameras
- 8.1.1.3. Storage Devices and Processors
- 8.1.1.4. Other Components
- 8.1.2. Software
- 8.1.2.1. Analytics Software
- 8.1.2.2. Enterprise Software
- 8.1.2.3. Facial Recognition
- 8.1.2.4. Gesture Recognition
- 8.1.2.5. Speech Recognition
- 8.1.1. Hardware
- 8.2. Market Analysis, Insights and Forecast - by End-user Industry
- 8.2.1. Healthcare
- 8.2.2. Automotive
- 8.2.3. Retail
- 8.2.4. Other End-user Industries
- 8.1. Market Analysis, Insights and Forecast - by Component
- 9. Latin America Affective Computing Industry Analysis, Insights and Forecast, 2019-2031
- 9.1. Market Analysis, Insights and Forecast - by Component
- 9.1.1. Hardware
- 9.1.1.1. Sensors
- 9.1.1.2. Cameras
- 9.1.1.3. Storage Devices and Processors
- 9.1.1.4. Other Components
- 9.1.2. Software
- 9.1.2.1. Analytics Software
- 9.1.2.2. Enterprise Software
- 9.1.2.3. Facial Recognition
- 9.1.2.4. Gesture Recognition
- 9.1.2.5. Speech Recognition
- 9.1.1. Hardware
- 9.2. Market Analysis, Insights and Forecast - by End-user Industry
- 9.2.1. Healthcare
- 9.2.2. Automotive
- 9.2.3. Retail
- 9.2.4. Other End-user Industries
- 9.1. Market Analysis, Insights and Forecast - by Component
- 10. Middle East and Africa Affective Computing Industry Analysis, Insights and Forecast, 2019-2031
- 10.1. Market Analysis, Insights and Forecast - by Component
- 10.1.1. Hardware
- 10.1.1.1. Sensors
- 10.1.1.2. Cameras
- 10.1.1.3. Storage Devices and Processors
- 10.1.1.4. Other Components
- 10.1.2. Software
- 10.1.2.1. Analytics Software
- 10.1.2.2. Enterprise Software
- 10.1.2.3. Facial Recognition
- 10.1.2.4. Gesture Recognition
- 10.1.2.5. Speech Recognition
- 10.1.1. Hardware
- 10.2. Market Analysis, Insights and Forecast - by End-user Industry
- 10.2.1. Healthcare
- 10.2.2. Automotive
- 10.2.3. Retail
- 10.2.4. Other End-user Industries
- 10.1. Market Analysis, Insights and Forecast - by Component
- 11. North America Affective Computing Industry Analysis, Insights and Forecast, 2019-2031
- 11.1. Market Analysis, Insights and Forecast - By Country/Sub-region
- 11.1.1 United States
- 11.1.2 Canada
- 11.1.3 Mexico
- 12. Europe Affective Computing Industry Analysis, Insights and Forecast, 2019-2031
- 12.1. Market Analysis, Insights and Forecast - By Country/Sub-region
- 12.1.1 Germany
- 12.1.2 United Kingdom
- 12.1.3 France
- 12.1.4 Spain
- 12.1.5 Italy
- 12.1.6 Spain
- 12.1.7 Belgium
- 12.1.8 Netherland
- 12.1.9 Nordics
- 12.1.10 Rest of Europe
- 13. Asia Pacific Affective Computing Industry Analysis, Insights and Forecast, 2019-2031
- 13.1. Market Analysis, Insights and Forecast - By Country/Sub-region
- 13.1.1 China
- 13.1.2 Japan
- 13.1.3 India
- 13.1.4 South Korea
- 13.1.5 Southeast Asia
- 13.1.6 Australia
- 13.1.7 Indonesia
- 13.1.8 Phillipes
- 13.1.9 Singapore
- 13.1.10 Thailandc
- 13.1.11 Rest of Asia Pacific
- 14. South America Affective Computing Industry Analysis, Insights and Forecast, 2019-2031
- 14.1. Market Analysis, Insights and Forecast - By Country/Sub-region
- 14.1.1 Brazil
- 14.1.2 Argentina
- 14.1.3 Peru
- 14.1.4 Chile
- 14.1.5 Colombia
- 14.1.6 Ecuador
- 14.1.7 Venezuela
- 14.1.8 Rest of South America
- 15. North America Affective Computing Industry Analysis, Insights and Forecast, 2019-2031
- 15.1. Market Analysis, Insights and Forecast - By Country/Sub-region
- 15.1.1 United States
- 15.1.2 Canada
- 15.1.3 Mexico
- 16. MEA Affective Computing Industry Analysis, Insights and Forecast, 2019-2031
- 16.1. Market Analysis, Insights and Forecast - By Country/Sub-region
- 16.1.1 United Arab Emirates
- 16.1.2 Saudi Arabia
- 16.1.3 South Africa
- 16.1.4 Rest of Middle East and Africa
- 17. Competitive Analysis
- 17.1. Global Market Share Analysis 2024
- 17.2. Company Profiles
- 17.2.1 Eyesight Technologies Ltd
- 17.2.1.1. Overview
- 17.2.1.2. Products
- 17.2.1.3. SWOT Analysis
- 17.2.1.4. Recent Developments
- 17.2.1.5. Financials (Based on Availability)
- 17.2.2 IBM Corporation
- 17.2.2.1. Overview
- 17.2.2.2. Products
- 17.2.2.3. SWOT Analysis
- 17.2.2.4. Recent Developments
- 17.2.2.5. Financials (Based on Availability)
- 17.2.3 Nuance Communications Inc (Microsoft Corporation)
- 17.2.3.1. Overview
- 17.2.3.2. Products
- 17.2.3.3. SWOT Analysis
- 17.2.3.4. Recent Developments
- 17.2.3.5. Financials (Based on Availability)
- 17.2.4 Realeyes Data Services Ltd
- 17.2.4.1. Overview
- 17.2.4.2. Products
- 17.2.4.3. SWOT Analysis
- 17.2.4.4. Recent Developments
- 17.2.4.5. Financials (Based on Availability)
- 17.2.5 Nemesysco Ltd
- 17.2.5.1. Overview
- 17.2.5.2. Products
- 17.2.5.3. SWOT Analysis
- 17.2.5.4. Recent Developments
- 17.2.5.5. Financials (Based on Availability)
- 17.2.6 Kairos AR Inc
- 17.2.6.1. Overview
- 17.2.6.2. Products
- 17.2.6.3. SWOT Analysis
- 17.2.6.4. Recent Developments
- 17.2.6.5. Financials (Based on Availability)
- 17.2.7 Affectiva Inc
- 17.2.7.1. Overview
- 17.2.7.2. Products
- 17.2.7.3. SWOT Analysis
- 17.2.7.4. Recent Developments
- 17.2.7.5. Financials (Based on Availability)
- 17.2.8 Amazon Web Services Inc
- 17.2.8.1. Overview
- 17.2.8.2. Products
- 17.2.8.3. SWOT Analysis
- 17.2.8.4. Recent Developments
- 17.2.8.5. Financials (Based on Availability)
- 17.2.9 audEERING GmbH
- 17.2.9.1. Overview
- 17.2.9.2. Products
- 17.2.9.3. SWOT Analysis
- 17.2.9.4. Recent Developments
- 17.2.9.5. Financials (Based on Availability)
- 17.2.10 Emotibot Technologies Limited
- 17.2.10.1. Overview
- 17.2.10.2. Products
- 17.2.10.3. SWOT Analysis
- 17.2.10.4. Recent Developments
- 17.2.10.5. Financials (Based on Availability)
- 17.2.11 Element Human Ltd
- 17.2.11.1. Overview
- 17.2.11.2. Products
- 17.2.11.3. SWOT Analysis
- 17.2.11.4. Recent Developments
- 17.2.11.5. Financials (Based on Availability)
- 17.2.12 Gesturetek Inc
- 17.2.12.1. Overview
- 17.2.12.2. Products
- 17.2.12.3. SWOT Analysis
- 17.2.12.4. Recent Developments
- 17.2.12.5. Financials (Based on Availability)
- 17.2.1 Eyesight Technologies Ltd
List of Figures
- Figure 1: Global Affective Computing Industry Revenue Breakdown (Million, %) by Region 2024 & 2032
- Figure 2: Global Affective Computing Industry Volume Breakdown (K Unit, %) by Region 2024 & 2032
- Figure 3: North America Affective Computing Industry Revenue (Million), by Country 2024 & 2032
- Figure 4: North America Affective Computing Industry Volume (K Unit), by Country 2024 & 2032
- Figure 5: North America Affective Computing Industry Revenue Share (%), by Country 2024 & 2032
- Figure 6: North America Affective Computing Industry Volume Share (%), by Country 2024 & 2032
- Figure 7: Europe Affective Computing Industry Revenue (Million), by Country 2024 & 2032
- Figure 8: Europe Affective Computing Industry Volume (K Unit), by Country 2024 & 2032
- Figure 9: Europe Affective Computing Industry Revenue Share (%), by Country 2024 & 2032
- Figure 10: Europe Affective Computing Industry Volume Share (%), by Country 2024 & 2032
- Figure 11: Asia Pacific Affective Computing Industry Revenue (Million), by Country 2024 & 2032
- Figure 12: Asia Pacific Affective Computing Industry Volume (K Unit), by Country 2024 & 2032
- Figure 13: Asia Pacific Affective Computing Industry Revenue Share (%), by Country 2024 & 2032
- Figure 14: Asia Pacific Affective Computing Industry Volume Share (%), by Country 2024 & 2032
- Figure 15: South America Affective Computing Industry Revenue (Million), by Country 2024 & 2032
- Figure 16: South America Affective Computing Industry Volume (K Unit), by Country 2024 & 2032
- Figure 17: South America Affective Computing Industry Revenue Share (%), by Country 2024 & 2032
- Figure 18: South America Affective Computing Industry Volume Share (%), by Country 2024 & 2032
- Figure 19: North America Affective Computing Industry Revenue (Million), by Country 2024 & 2032
- Figure 20: North America Affective Computing Industry Volume (K Unit), by Country 2024 & 2032
- Figure 21: North America Affective Computing Industry Revenue Share (%), by Country 2024 & 2032
- Figure 22: North America Affective Computing Industry Volume Share (%), by Country 2024 & 2032
- Figure 23: MEA Affective Computing Industry Revenue (Million), by Country 2024 & 2032
- Figure 24: MEA Affective Computing Industry Volume (K Unit), by Country 2024 & 2032
- Figure 25: MEA Affective Computing Industry Revenue Share (%), by Country 2024 & 2032
- Figure 26: MEA Affective Computing Industry Volume Share (%), by Country 2024 & 2032
- Figure 27: North America Affective Computing Industry Revenue (Million), by Component 2024 & 2032
- Figure 28: North America Affective Computing Industry Volume (K Unit), by Component 2024 & 2032
- Figure 29: North America Affective Computing Industry Revenue Share (%), by Component 2024 & 2032
- Figure 30: North America Affective Computing Industry Volume Share (%), by Component 2024 & 2032
- Figure 31: North America Affective Computing Industry Revenue (Million), by End-user Industry 2024 & 2032
- Figure 32: North America Affective Computing Industry Volume (K Unit), by End-user Industry 2024 & 2032
- Figure 33: North America Affective Computing Industry Revenue Share (%), by End-user Industry 2024 & 2032
- Figure 34: North America Affective Computing Industry Volume Share (%), by End-user Industry 2024 & 2032
- Figure 35: North America Affective Computing Industry Revenue (Million), by Country 2024 & 2032
- Figure 36: North America Affective Computing Industry Volume (K Unit), by Country 2024 & 2032
- Figure 37: North America Affective Computing Industry Revenue Share (%), by Country 2024 & 2032
- Figure 38: North America Affective Computing Industry Volume Share (%), by Country 2024 & 2032
- Figure 39: Europe Affective Computing Industry Revenue (Million), by Component 2024 & 2032
- Figure 40: Europe Affective Computing Industry Volume (K Unit), by Component 2024 & 2032
- Figure 41: Europe Affective Computing Industry Revenue Share (%), by Component 2024 & 2032
- Figure 42: Europe Affective Computing Industry Volume Share (%), by Component 2024 & 2032
- Figure 43: Europe Affective Computing Industry Revenue (Million), by End-user Industry 2024 & 2032
- Figure 44: Europe Affective Computing Industry Volume (K Unit), by End-user Industry 2024 & 2032
- Figure 45: Europe Affective Computing Industry Revenue Share (%), by End-user Industry 2024 & 2032
- Figure 46: Europe Affective Computing Industry Volume Share (%), by End-user Industry 2024 & 2032
- Figure 47: Europe Affective Computing Industry Revenue (Million), by Country 2024 & 2032
- Figure 48: Europe Affective Computing Industry Volume (K Unit), by Country 2024 & 2032
- Figure 49: Europe Affective Computing Industry Revenue Share (%), by Country 2024 & 2032
- Figure 50: Europe Affective Computing Industry Volume Share (%), by Country 2024 & 2032
- Figure 51: Asia Affective Computing Industry Revenue (Million), by Component 2024 & 2032
- Figure 52: Asia Affective Computing Industry Volume (K Unit), by Component 2024 & 2032
- Figure 53: Asia Affective Computing Industry Revenue Share (%), by Component 2024 & 2032
- Figure 54: Asia Affective Computing Industry Volume Share (%), by Component 2024 & 2032
- Figure 55: Asia Affective Computing Industry Revenue (Million), by End-user Industry 2024 & 2032
- Figure 56: Asia Affective Computing Industry Volume (K Unit), by End-user Industry 2024 & 2032
- Figure 57: Asia Affective Computing Industry Revenue Share (%), by End-user Industry 2024 & 2032
- Figure 58: Asia Affective Computing Industry Volume Share (%), by End-user Industry 2024 & 2032
- Figure 59: Asia Affective Computing Industry Revenue (Million), by Country 2024 & 2032
- Figure 60: Asia Affective Computing Industry Volume (K Unit), by Country 2024 & 2032
- Figure 61: Asia Affective Computing Industry Revenue Share (%), by Country 2024 & 2032
- Figure 62: Asia Affective Computing Industry Volume Share (%), by Country 2024 & 2032
- Figure 63: Latin America Affective Computing Industry Revenue (Million), by Component 2024 & 2032
- Figure 64: Latin America Affective Computing Industry Volume (K Unit), by Component 2024 & 2032
- Figure 65: Latin America Affective Computing Industry Revenue Share (%), by Component 2024 & 2032
- Figure 66: Latin America Affective Computing Industry Volume Share (%), by Component 2024 & 2032
- Figure 67: Latin America Affective Computing Industry Revenue (Million), by End-user Industry 2024 & 2032
- Figure 68: Latin America Affective Computing Industry Volume (K Unit), by End-user Industry 2024 & 2032
- Figure 69: Latin America Affective Computing Industry Revenue Share (%), by End-user Industry 2024 & 2032
- Figure 70: Latin America Affective Computing Industry Volume Share (%), by End-user Industry 2024 & 2032
- Figure 71: Latin America Affective Computing Industry Revenue (Million), by Country 2024 & 2032
- Figure 72: Latin America Affective Computing Industry Volume (K Unit), by Country 2024 & 2032
- Figure 73: Latin America Affective Computing Industry Revenue Share (%), by Country 2024 & 2032
- Figure 74: Latin America Affective Computing Industry Volume Share (%), by Country 2024 & 2032
- Figure 75: Middle East and Africa Affective Computing Industry Revenue (Million), by Component 2024 & 2032
- Figure 76: Middle East and Africa Affective Computing Industry Volume (K Unit), by Component 2024 & 2032
- Figure 77: Middle East and Africa Affective Computing Industry Revenue Share (%), by Component 2024 & 2032
- Figure 78: Middle East and Africa Affective Computing Industry Volume Share (%), by Component 2024 & 2032
- Figure 79: Middle East and Africa Affective Computing Industry Revenue (Million), by End-user Industry 2024 & 2032
- Figure 80: Middle East and Africa Affective Computing Industry Volume (K Unit), by End-user Industry 2024 & 2032
- Figure 81: Middle East and Africa Affective Computing Industry Revenue Share (%), by End-user Industry 2024 & 2032
- Figure 82: Middle East and Africa Affective Computing Industry Volume Share (%), by End-user Industry 2024 & 2032
- Figure 83: Middle East and Africa Affective Computing Industry Revenue (Million), by Country 2024 & 2032
- Figure 84: Middle East and Africa Affective Computing Industry Volume (K Unit), by Country 2024 & 2032
- Figure 85: Middle East and Africa Affective Computing Industry Revenue Share (%), by Country 2024 & 2032
- Figure 86: Middle East and Africa Affective Computing Industry Volume Share (%), by Country 2024 & 2032
List of Tables
- Table 1: Global Affective Computing Industry Revenue Million Forecast, by Region 2019 & 2032
- Table 2: Global Affective Computing Industry Volume K Unit Forecast, by Region 2019 & 2032
- Table 3: Global Affective Computing Industry Revenue Million Forecast, by Component 2019 & 2032
- Table 4: Global Affective Computing Industry Volume K Unit Forecast, by Component 2019 & 2032
- Table 5: Global Affective Computing Industry Revenue Million Forecast, by End-user Industry 2019 & 2032
- Table 6: Global Affective Computing Industry Volume K Unit Forecast, by End-user Industry 2019 & 2032
- Table 7: Global Affective Computing Industry Revenue Million Forecast, by Region 2019 & 2032
- Table 8: Global Affective Computing Industry Volume K Unit Forecast, by Region 2019 & 2032
- Table 9: Global Affective Computing Industry Revenue Million Forecast, by Country 2019 & 2032
- Table 10: Global Affective Computing Industry Volume K Unit Forecast, by Country 2019 & 2032
- Table 11: United States Affective Computing Industry Revenue (Million) Forecast, by Application 2019 & 2032
- Table 12: United States Affective Computing Industry Volume (K Unit) Forecast, by Application 2019 & 2032
- Table 13: Canada Affective Computing Industry Revenue (Million) Forecast, by Application 2019 & 2032
- Table 14: Canada Affective Computing Industry Volume (K Unit) Forecast, by Application 2019 & 2032
- Table 15: Mexico Affective Computing Industry Revenue (Million) Forecast, by Application 2019 & 2032
- Table 16: Mexico Affective Computing Industry Volume (K Unit) Forecast, by Application 2019 & 2032
- Table 17: Global Affective Computing Industry Revenue Million Forecast, by Country 2019 & 2032
- Table 18: Global Affective Computing Industry Volume K Unit Forecast, by Country 2019 & 2032
- Table 19: Germany Affective Computing Industry Revenue (Million) Forecast, by Application 2019 & 2032
- Table 20: Germany Affective Computing Industry Volume (K Unit) Forecast, by Application 2019 & 2032
- Table 21: United Kingdom Affective Computing Industry Revenue (Million) Forecast, by Application 2019 & 2032
- Table 22: United Kingdom Affective Computing Industry Volume (K Unit) Forecast, by Application 2019 & 2032
- Table 23: France Affective Computing Industry Revenue (Million) Forecast, by Application 2019 & 2032
- Table 24: France Affective Computing Industry Volume (K Unit) Forecast, by Application 2019 & 2032
- Table 25: Spain Affective Computing Industry Revenue (Million) Forecast, by Application 2019 & 2032
- Table 26: Spain Affective Computing Industry Volume (K Unit) Forecast, by Application 2019 & 2032
- Table 27: Italy Affective Computing Industry Revenue (Million) Forecast, by Application 2019 & 2032
- Table 28: Italy Affective Computing Industry Volume (K Unit) Forecast, by Application 2019 & 2032
- Table 29: Spain Affective Computing Industry Revenue (Million) Forecast, by Application 2019 & 2032
- Table 30: Spain Affective Computing Industry Volume (K Unit) Forecast, by Application 2019 & 2032
- Table 31: Belgium Affective Computing Industry Revenue (Million) Forecast, by Application 2019 & 2032
- Table 32: Belgium Affective Computing Industry Volume (K Unit) Forecast, by Application 2019 & 2032
- Table 33: Netherland Affective Computing Industry Revenue (Million) Forecast, by Application 2019 & 2032
- Table 34: Netherland Affective Computing Industry Volume (K Unit) Forecast, by Application 2019 & 2032
- Table 35: Nordics Affective Computing Industry Revenue (Million) Forecast, by Application 2019 & 2032
- Table 36: Nordics Affective Computing Industry Volume (K Unit) Forecast, by Application 2019 & 2032
- Table 37: Rest of Europe Affective Computing Industry Revenue (Million) Forecast, by Application 2019 & 2032
- Table 38: Rest of Europe Affective Computing Industry Volume (K Unit) Forecast, by Application 2019 & 2032
- Table 39: Global Affective Computing Industry Revenue Million Forecast, by Country 2019 & 2032
- Table 40: Global Affective Computing Industry Volume K Unit Forecast, by Country 2019 & 2032
- Table 41: China Affective Computing Industry Revenue (Million) Forecast, by Application 2019 & 2032
- Table 42: China Affective Computing Industry Volume (K Unit) Forecast, by Application 2019 & 2032
- Table 43: Japan Affective Computing Industry Revenue (Million) Forecast, by Application 2019 & 2032
- Table 44: Japan Affective Computing Industry Volume (K Unit) Forecast, by Application 2019 & 2032
- Table 45: India Affective Computing Industry Revenue (Million) Forecast, by Application 2019 & 2032
- Table 46: India Affective Computing Industry Volume (K Unit) Forecast, by Application 2019 & 2032
- Table 47: South Korea Affective Computing Industry Revenue (Million) Forecast, by Application 2019 & 2032
- Table 48: South Korea Affective Computing Industry Volume (K Unit) Forecast, by Application 2019 & 2032
- Table 49: Southeast Asia Affective Computing Industry Revenue (Million) Forecast, by Application 2019 & 2032
- Table 50: Southeast Asia Affective Computing Industry Volume (K Unit) Forecast, by Application 2019 & 2032
- Table 51: Australia Affective Computing Industry Revenue (Million) Forecast, by Application 2019 & 2032
- Table 52: Australia Affective Computing Industry Volume (K Unit) Forecast, by Application 2019 & 2032
- Table 53: Indonesia Affective Computing Industry Revenue (Million) Forecast, by Application 2019 & 2032
- Table 54: Indonesia Affective Computing Industry Volume (K Unit) Forecast, by Application 2019 & 2032
- Table 55: Phillipes Affective Computing Industry Revenue (Million) Forecast, by Application 2019 & 2032
- Table 56: Phillipes Affective Computing Industry Volume (K Unit) Forecast, by Application 2019 & 2032
- Table 57: Singapore Affective Computing Industry Revenue (Million) Forecast, by Application 2019 & 2032
- Table 58: Singapore Affective Computing Industry Volume (K Unit) Forecast, by Application 2019 & 2032
- Table 59: Thailandc Affective Computing Industry Revenue (Million) Forecast, by Application 2019 & 2032
- Table 60: Thailandc Affective Computing Industry Volume (K Unit) Forecast, by Application 2019 & 2032
- Table 61: Rest of Asia Pacific Affective Computing Industry Revenue (Million) Forecast, by Application 2019 & 2032
- Table 62: Rest of Asia Pacific Affective Computing Industry Volume (K Unit) Forecast, by Application 2019 & 2032
- Table 63: Global Affective Computing Industry Revenue Million Forecast, by Country 2019 & 2032
- Table 64: Global Affective Computing Industry Volume K Unit Forecast, by Country 2019 & 2032
- Table 65: Brazil Affective Computing Industry Revenue (Million) Forecast, by Application 2019 & 2032
- Table 66: Brazil Affective Computing Industry Volume (K Unit) Forecast, by Application 2019 & 2032
- Table 67: Argentina Affective Computing Industry Revenue (Million) Forecast, by Application 2019 & 2032
- Table 68: Argentina Affective Computing Industry Volume (K Unit) Forecast, by Application 2019 & 2032
- Table 69: Peru Affective Computing Industry Revenue (Million) Forecast, by Application 2019 & 2032
- Table 70: Peru Affective Computing Industry Volume (K Unit) Forecast, by Application 2019 & 2032
- Table 71: Chile Affective Computing Industry Revenue (Million) Forecast, by Application 2019 & 2032
- Table 72: Chile Affective Computing Industry Volume (K Unit) Forecast, by Application 2019 & 2032
- Table 73: Colombia Affective Computing Industry Revenue (Million) Forecast, by Application 2019 & 2032
- Table 74: Colombia Affective Computing Industry Volume (K Unit) Forecast, by Application 2019 & 2032
- Table 75: Ecuador Affective Computing Industry Revenue (Million) Forecast, by Application 2019 & 2032
- Table 76: Ecuador Affective Computing Industry Volume (K Unit) Forecast, by Application 2019 & 2032
- Table 77: Venezuela Affective Computing Industry Revenue (Million) Forecast, by Application 2019 & 2032
- Table 78: Venezuela Affective Computing Industry Volume (K Unit) Forecast, by Application 2019 & 2032
- Table 79: Rest of South America Affective Computing Industry Revenue (Million) Forecast, by Application 2019 & 2032
- Table 80: Rest of South America Affective Computing Industry Volume (K Unit) Forecast, by Application 2019 & 2032
- Table 81: Global Affective Computing Industry Revenue Million Forecast, by Country 2019 & 2032
- Table 82: Global Affective Computing Industry Volume K Unit Forecast, by Country 2019 & 2032
- Table 83: United States Affective Computing Industry Revenue (Million) Forecast, by Application 2019 & 2032
- Table 84: United States Affective Computing Industry Volume (K Unit) Forecast, by Application 2019 & 2032
- Table 85: Canada Affective Computing Industry Revenue (Million) Forecast, by Application 2019 & 2032
- Table 86: Canada Affective Computing Industry Volume (K Unit) Forecast, by Application 2019 & 2032
- Table 87: Mexico Affective Computing Industry Revenue (Million) Forecast, by Application 2019 & 2032
- Table 88: Mexico Affective Computing Industry Volume (K Unit) Forecast, by Application 2019 & 2032
- Table 89: Global Affective Computing Industry Revenue Million Forecast, by Country 2019 & 2032
- Table 90: Global Affective Computing Industry Volume K Unit Forecast, by Country 2019 & 2032
- Table 91: United Arab Emirates Affective Computing Industry Revenue (Million) Forecast, by Application 2019 & 2032
- Table 92: United Arab Emirates Affective Computing Industry Volume (K Unit) Forecast, by Application 2019 & 2032
- Table 93: Saudi Arabia Affective Computing Industry Revenue (Million) Forecast, by Application 2019 & 2032
- Table 94: Saudi Arabia Affective Computing Industry Volume (K Unit) Forecast, by Application 2019 & 2032
- Table 95: South Africa Affective Computing Industry Revenue (Million) Forecast, by Application 2019 & 2032
- Table 96: South Africa Affective Computing Industry Volume (K Unit) Forecast, by Application 2019 & 2032
- Table 97: Rest of Middle East and Africa Affective Computing Industry Revenue (Million) Forecast, by Application 2019 & 2032
- Table 98: Rest of Middle East and Africa Affective Computing Industry Volume (K Unit) Forecast, by Application 2019 & 2032
- Table 99: Global Affective Computing Industry Revenue Million Forecast, by Component 2019 & 2032
- Table 100: Global Affective Computing Industry Volume K Unit Forecast, by Component 2019 & 2032
- Table 101: Global Affective Computing Industry Revenue Million Forecast, by End-user Industry 2019 & 2032
- Table 102: Global Affective Computing Industry Volume K Unit Forecast, by End-user Industry 2019 & 2032
- Table 103: Global Affective Computing Industry Revenue Million Forecast, by Country 2019 & 2032
- Table 104: Global Affective Computing Industry Volume K Unit Forecast, by Country 2019 & 2032
- Table 105: Global Affective Computing Industry Revenue Million Forecast, by Component 2019 & 2032
- Table 106: Global Affective Computing Industry Volume K Unit Forecast, by Component 2019 & 2032
- Table 107: Global Affective Computing Industry Revenue Million Forecast, by End-user Industry 2019 & 2032
- Table 108: Global Affective Computing Industry Volume K Unit Forecast, by End-user Industry 2019 & 2032
- Table 109: Global Affective Computing Industry Revenue Million Forecast, by Country 2019 & 2032
- Table 110: Global Affective Computing Industry Volume K Unit Forecast, by Country 2019 & 2032
- Table 111: Global Affective Computing Industry Revenue Million Forecast, by Component 2019 & 2032
- Table 112: Global Affective Computing Industry Volume K Unit Forecast, by Component 2019 & 2032
- Table 113: Global Affective Computing Industry Revenue Million Forecast, by End-user Industry 2019 & 2032
- Table 114: Global Affective Computing Industry Volume K Unit Forecast, by End-user Industry 2019 & 2032
- Table 115: Global Affective Computing Industry Revenue Million Forecast, by Country 2019 & 2032
- Table 116: Global Affective Computing Industry Volume K Unit Forecast, by Country 2019 & 2032
- Table 117: Global Affective Computing Industry Revenue Million Forecast, by Component 2019 & 2032
- Table 118: Global Affective Computing Industry Volume K Unit Forecast, by Component 2019 & 2032
- Table 119: Global Affective Computing Industry Revenue Million Forecast, by End-user Industry 2019 & 2032
- Table 120: Global Affective Computing Industry Volume K Unit Forecast, by End-user Industry 2019 & 2032
- Table 121: Global Affective Computing Industry Revenue Million Forecast, by Country 2019 & 2032
- Table 122: Global Affective Computing Industry Volume K Unit Forecast, by Country 2019 & 2032
- Table 123: Global Affective Computing Industry Revenue Million Forecast, by Component 2019 & 2032
- Table 124: Global Affective Computing Industry Volume K Unit Forecast, by Component 2019 & 2032
- Table 125: Global Affective Computing Industry Revenue Million Forecast, by End-user Industry 2019 & 2032
- Table 126: Global Affective Computing Industry Volume K Unit Forecast, by End-user Industry 2019 & 2032
- Table 127: Global Affective Computing Industry Revenue Million Forecast, by Country 2019 & 2032
- Table 128: Global Affective Computing Industry Volume K Unit Forecast, by Country 2019 & 2032
Frequently Asked Questions
1. What is the projected Compound Annual Growth Rate (CAGR) of the Affective Computing Industry?
The projected CAGR is approximately 24.29%.
2. Which companies are prominent players in the Affective Computing Industry?
Key companies in the market include Eyesight Technologies Ltd, IBM Corporation, Nuance Communications Inc (Microsoft Corporation), Realeyes Data Services Ltd, Nemesysco Ltd, Kairos AR Inc, Affectiva Inc, Amazon Web Services Inc, audEERING GmbH, Emotibot Technologies Limited, Element Human Ltd, Gesturetek Inc.
3. What are the main segments of the Affective Computing Industry?
The market segments include Component, End-user Industry.
4. Can you provide details about the market size?
The market size is estimated to be USD 73.58 Million as of 2022.
5. What are some drivers contributing to market growth?
Increased Automation in Contact Centers; Increasing Adoption of Cloud-based Solutions and Online Solutions; Rising Technology Adoptions in Various Industries such as Automotive.
6. What are the notable trends driving market growth?
Rising Technology Adoptions in Various Industries such as Automotive.
7. Are there any restraints impacting market growth?
; High Cost of RF Power.
8. Can you provide examples of recent developments in the market?
September 2022: Nuance Communications, Inc. announced that Liberty Global expanded its use of Nuance Dragon TV for Virgin Media O2 customers in the United Kingdom. The expansion included new capabilities that provided enhanced support for visually impaired customers, such as reading aloud program information.
9. What pricing options are available for accessing the report?
Pricing options include single-user, multi-user, and enterprise licenses priced at USD 4750, USD 5250, and USD 8750 respectively.
10. Is the market size provided in terms of value or volume?
The market size is provided in terms of value, measured in Million and volume, measured in K Unit.
11. Are there any specific market keywords associated with the report?
Yes, the market keyword associated with the report is "Affective Computing Industry," which aids in identifying and referencing the specific market segment covered.
12. How do I determine which pricing option suits my needs best?
The pricing options vary based on user requirements and access needs. Individual users may opt for single-user licenses, while businesses requiring broader access may choose multi-user or enterprise licenses for cost-effective access to the report.
13. Are there any additional resources or data provided in the Affective Computing Industry report?
While the report offers comprehensive insights, it's advisable to review the specific contents or supplementary materials provided to ascertain if additional resources or data are available.
14. How can I stay updated on further developments or reports in the Affective Computing Industry?
To stay informed about further developments, trends, and reports in the Affective Computing Industry, consider subscribing to industry newsletters, following relevant companies and organizations, or regularly checking reputable industry news sources and publications.
Methodology
Step 1 - Identification of Relevant Samples Size from Population Database


Step 2 - Approaches for Defining Global Market Size (Value, Volume* & Price*)

Note*: In applicable scenarios
Step 3 - Data Sources
Primary Research
- Web Analytics
- Survey Reports
- Research Institute
- Latest Research Reports
- Opinion Leaders
Secondary Research
- Annual Reports
- White Paper
- Latest Press Release
- Industry Association
- Paid Database
- Investor Presentations

Step 4 - Data Triangulation
Involves using different sources of information in order to increase the validity of a study
These sources are likely to be stakeholders in a program - participants, other researchers, program staff, other community members, and so on.
Then we put all data in single framework & apply various statistical tools to find out the dynamic on the market.
During the analysis stage, feedback from the stakeholder groups would be compared to determine areas of agreement as well as areas of divergence


