
Key Insights
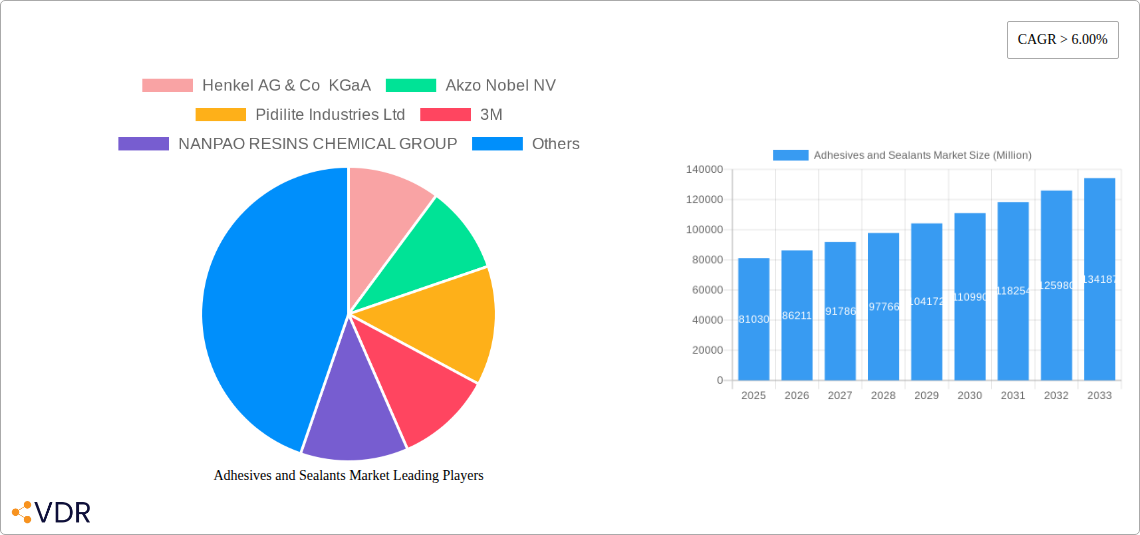
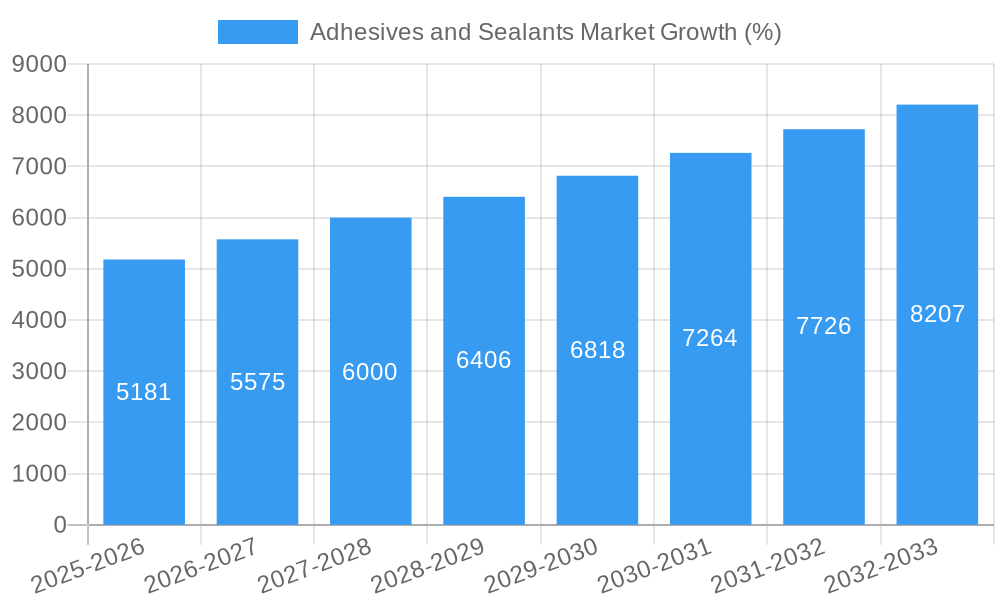
The global adhesives and sealants market, valued at $81.03 billion in 2025, is projected to experience robust growth, exceeding a compound annual growth rate (CAGR) of 6.00% from 2025 to 2033. This expansion is driven by several key factors. The burgeoning construction industry, particularly in developing economies, fuels significant demand for construction adhesives and sealants. Similarly, the automotive sector's continuous innovation and the increasing use of lightweight materials are driving the adoption of high-performance adhesives. The growth of the packaging industry, demand for durable and sustainable packaging solutions, further contributes to market expansion. Advances in adhesive technology, such as the development of eco-friendly water-borne and UV-cured adhesives, are also shaping market dynamics, attracting environmentally conscious consumers and manufacturers. The increasing adoption of automation in manufacturing processes further supports the market's growth trajectory.
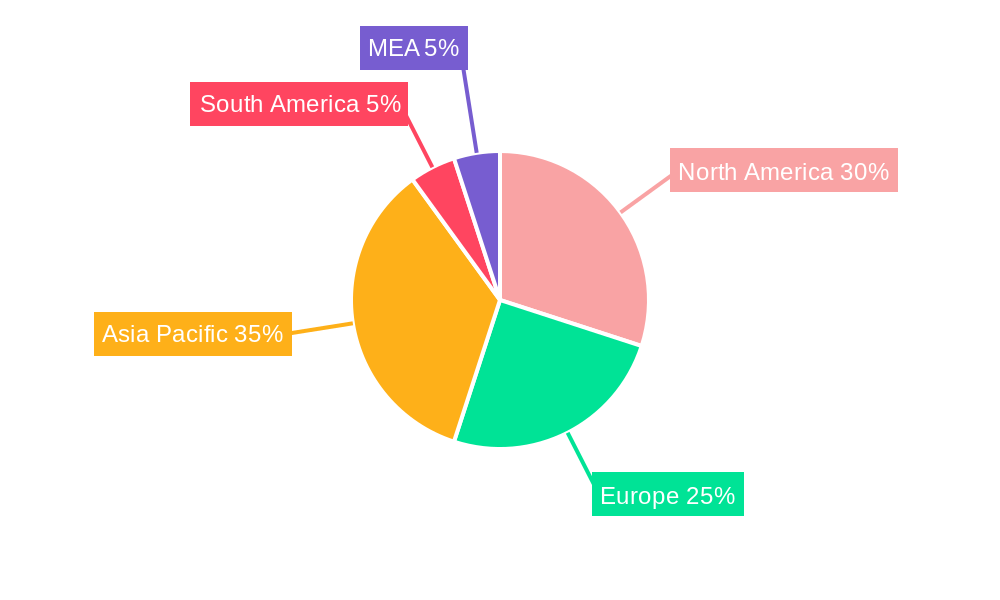
However, certain restraints affect the market's growth. Fluctuations in raw material prices, particularly for petroleum-based resins, impact production costs and profitability. Furthermore, stringent environmental regulations regarding volatile organic compounds (VOCs) in adhesives and sealants necessitate the development and adoption of eco-friendly alternatives, which can present challenges for some manufacturers. Competition among established players and the emergence of new entrants also impact market dynamics, with companies focusing on product innovation and strategic partnerships to maintain their market share. Regional variations in growth rates are expected, with Asia-Pacific projected to lead the market due to rapid infrastructure development and industrialization in countries like China and India. North America and Europe will also show significant growth, driven by strong construction sectors and the adoption of advanced adhesive technologies.
Adhesives and Sealants Market: A Comprehensive Market Report (2019-2033)
This comprehensive report provides a detailed analysis of the Adhesives and Sealants Market, encompassing market dynamics, growth trends, regional dominance, product landscape, key challenges, emerging opportunities, and key players. The study period covers 2019-2033, with a base year of 2025 and a forecast period of 2025-2033. The report utilizes data from the historical period (2019-2024) to project future market trends. The market is segmented by end-user industry, adhesive resin, adhesives technology, and sealant resin. The total market size is projected to reach xx Million units by 2033.
Adhesives and Sealants Market Market Dynamics & Structure
The Adhesives and Sealants Market is characterized by a moderately concentrated structure with several multinational corporations holding significant market share. Henkel AG & Co KGaA, 3M, Akzo Nobel NV, and others command a large portion of the global market. Technological innovation is a key driver, with continuous development in materials science leading to improved adhesive and sealant performance. Stringent environmental regulations, particularly concerning volatile organic compounds (VOCs), are shaping product development towards more sustainable solutions. The market witnesses considerable M&A activity, reflecting companies' strategies to expand their product portfolios and geographic reach. Competitive substitutes exist, including mechanical fasteners and welding, but adhesives and sealants remain favored for their versatility and cost-effectiveness in many applications. The market is strongly influenced by end-user demographics and industry trends, with growth primarily driven by the building and construction, automotive, and packaging sectors.
- Market Concentration: Moderately concentrated, with top players holding approximately xx% market share.
- Technological Innovation: Continuous development in adhesive resin chemistry, resulting in high-performance products.
- Regulatory Framework: Stringent environmental regulations driving the adoption of eco-friendly adhesives and sealants.
- Competitive Substitutes: Mechanical fasteners and welding pose some level of competition, but adhesives offer unique advantages.
- M&A Activity: Significant M&A activity observed in recent years, with xx deals recorded in the past 5 years. (estimated value)
- End-user Demographics: Growth strongly correlated with expanding construction, automotive, and packaging industries.
Adhesives and Sealants Market Growth Trends & Insights
The Adhesives and Sealants Market exhibits robust growth, driven by increasing demand from various end-use sectors. The market size has grown steadily over the historical period and is projected to maintain a significant compound annual growth rate (CAGR) of xx% during the forecast period. Adoption rates are high in developed economies and are rapidly increasing in developing regions, fueled by infrastructure development and industrialization. Technological advancements, particularly in areas like UV-cured and water-borne adhesives, are influencing market trends. Consumer behavior shifts towards sustainable and eco-friendly products are also playing a vital role, leading to increased demand for bio-based and low-VOC adhesives. Market penetration continues to grow across all major segments, with significant potential for expansion in emerging markets. (This section will leverage external data sources to support the claims and projections outlined here and will include details of the CAGR and market penetration figures.)
Dominant Regions, Countries, or Segments in Adhesives and Sealants Market
The building and construction sector remains the dominant end-user industry, accounting for approximately xx% of the market. Geographically, North America and Europe hold significant market share due to established infrastructure and strong industrial activity. However, Asia-Pacific is experiencing rapid growth, driven by increasing urbanization and infrastructural investments. Within adhesive resins, polyurethane and silicone hold leading positions owing to their versatility and performance characteristics. In sealant resins, silicone also dominates due to its durability and resistance.
- Key Drivers: Rapid urbanization, infrastructure development, industrial expansion, and technological advancement.
- Dominant Regions: North America and Europe, with rapidly growing markets in Asia-Pacific.
- Dominant Segments: Building & Construction (End-user), Polyurethane & Silicone (Adhesive Resin), Silicone (Sealant Resin)
- Market Share: (detailed breakdown for each segment and region will be provided)
- Growth Potential: High growth potential in developing economies, particularly in Asia-Pacific and Latin America.
Adhesives and Sealants Market Product Landscape
The adhesives and sealants market offers a diverse range of products tailored to specific applications, encompassing various resin types, technologies, and performance characteristics. Recent innovations focus on high-performance materials with improved adhesion strength, durability, and environmental compatibility. Unique selling propositions include faster curing times, enhanced flexibility, improved resistance to chemicals, and higher temperature tolerance. Technological advancements include the development of more sustainable, bio-based adhesives and sealants, as well as smart adhesives with integrated sensors.
Key Drivers, Barriers & Challenges in Adhesives and Sealants Market
Key Drivers:
- Increasing demand from various industries (e.g., automotive, construction).
- Technological advancements leading to improved performance and sustainability.
- Growing focus on eco-friendly products.
Key Challenges and Restraints:
- Fluctuations in raw material prices impacting profitability.
- Stringent environmental regulations increasing manufacturing costs.
- Intense competition among established players and emerging market entrants. (quantifiable impact to be added based on external data analysis)
Emerging Opportunities in Adhesives and Sealants Market
- Growing demand for sustainable and bio-based adhesives.
- Expansion into niche markets such as medical devices and aerospace.
- Development of smart adhesives and self-healing materials.
- Increased adoption of advanced manufacturing technologies such as additive manufacturing.
Growth Accelerators in the Adhesives and Sealants Market Industry
Long-term growth in the adhesives and sealants market will be propelled by sustained investment in R&D, focusing on innovative materials and technologies. Strategic partnerships and collaborations between material suppliers and end-users will further accelerate growth. Market expansion strategies targeting emerging markets will also play a critical role in driving future growth. Continued focus on sustainable products, improving supply chain efficiency, and adopting lean manufacturing principles will be essential to support growth.
Key Players Shaping the Adhesives and Sealants Market Market
- Henkel AG & Co KGaA
- Akzo Nobel NV
- Pidilite Industries Ltd
- 3M
- NANPAO RESINS CHEMICAL GROUP
- Illinois Tool Works Inc
- Arkema Group
- Huntsman International LLC
- DuPont
- Dow
- H B Fuller Company
- Aica Kogyo Co Ltd
- Sika AG
- MAPEI SpA
- AVERY DENNISON CORPORATION
- Soudal Holding NV
Notable Milestones in Adhesives and Sealants Market Sector
- May 2023: Henkel AG & Co. KGaA opens new Technology Center in Bridgewater, New Jersey, expanding its innovation capabilities.
- September 2022: Henkel AG & Co. KGaA expands production of thermal interface material adhesives for electronics and automotive sectors.
- January 2022: Bostik (Arkema) expands distribution of its Born2Bond engineering adhesives in EMEA through a partnership with DGE Group.
In-Depth Adhesives and Sealants Market Market Outlook
The Adhesives and Sealants Market is poised for continued growth, driven by ongoing technological advancements, expansion into new applications, and increased demand from key end-use sectors. Strategic investments in R&D, coupled with sustainable product development, will shape the future of this dynamic market. Companies focusing on innovation and diversification will be best positioned to capitalize on the significant growth opportunities anticipated in the coming years.
Adhesives and Sealants Market Segmentation
-
1. Adhesive Resin
- 1.1. Polyurethane
- 1.2. Epoxy
- 1.3. Acrylic
- 1.4. Silicone
- 1.5. Cyanoacrylate
- 1.6. VAE/EVA
- 1.7. Other Resins (Polyester, Rubber, etc.)
-
2. Adhesives Technology
- 2.1. Solvent-borne
- 2.2. Reactive
- 2.3. Hot Melt
- 2.4. UV-cured Adhesives
- 2.5. Water-borne
-
3. Sealant Resin
- 3.1. Silicone
- 3.2. Polyurethane
- 3.3. Acrylic
- 3.4. Epoxy
- 3.5. Other Re
-
4. End-user Industry
- 4.1. Aerospace
- 4.2. Automotive
- 4.3. Building and Construction
- 4.4. Footwear and Leather
- 4.5. Healthcare
- 4.6. Packaging
- 4.7. Woodwork and Joinery
- 4.8. Other En
Adhesives and Sealants Market Segmentation By Geography
-
1. Asia Pacific
- 1.1. China
- 1.2. India
- 1.3. Japan
- 1.4. South Korea
- 1.5. Indonesia
- 1.6. Malaysia
- 1.7. Thailand
- 1.8. Vietnam
- 1.9. Rest of Asia Pacific
-
2. North America
- 2.1. United States
- 2.2. Canada
- 2.3. Mexico
-
3. Europe
- 3.1. Germany
- 3.2. United Kingdom
- 3.3. France
- 3.4. Italy
- 3.5. Spain
- 3.6. Russia
- 3.7. Turkey
- 3.8. NORDIC Countries
- 3.9. Rest of Europe
-
4. South America
- 4.1. Brazil
- 4.2. Argentina
- 4.3. Colombia
- 4.4. Rest of South America
-
5. Middle East and Africa
- 5.1. Saudi Arabia
- 5.2. South Africa
- 5.3. Qatar
- 5.4. United Arab Emirates
- 5.5. Egypt
- 5.6. Algeria
- 5.7. Rest of Middle East and Africa
Adhesives and Sealants Market REPORT HIGHLIGHTS
| Aspects | Details |
|---|---|
| Study Period | 2019-2033 |
| Base Year | 2024 |
| Estimated Year | 2025 |
| Forecast Period | 2025-2033 |
| Historical Period | 2019-2024 |
| Growth Rate | CAGR of > 6.00% from 2019-2033 |
| Segmentation |
|
Table of Contents
- 1. Introduction
- 1.1. Research Scope
- 1.2. Market Segmentation
- 1.3. Research Methodology
- 1.4. Definitions and Assumptions
- 2. Executive Summary
- 2.1. Introduction
- 3. Market Dynamics
- 3.1. Introduction
- 3.2. Market Drivers
- 3.2.1. Expanding Building and Construction Sector; Increasing Demand from the Packaging Industry; Other Drivers
- 3.3. Market Restrains
- 3.3.1. Stringent Environmental Regulations Regarding VOC Emissions; High Fluctuations in Raw Material Pricing
- 3.4. Market Trends
- 3.4.1. Packaging Industry to Dominate the Market
- 4. Market Factor Analysis
- 4.1. Porters Five Forces
- 4.2. Supply/Value Chain
- 4.3. PESTEL analysis
- 4.4. Market Entropy
- 4.5. Patent/Trademark Analysis
- 5. Global Adhesives and Sealants Market Analysis, Insights and Forecast, 2019-2031
- 5.1. Market Analysis, Insights and Forecast - by Adhesive Resin
- 5.1.1. Polyurethane
- 5.1.2. Epoxy
- 5.1.3. Acrylic
- 5.1.4. Silicone
- 5.1.5. Cyanoacrylate
- 5.1.6. VAE/EVA
- 5.1.7. Other Resins (Polyester, Rubber, etc.)
- 5.2. Market Analysis, Insights and Forecast - by Adhesives Technology
- 5.2.1. Solvent-borne
- 5.2.2. Reactive
- 5.2.3. Hot Melt
- 5.2.4. UV-cured Adhesives
- 5.2.5. Water-borne
- 5.3. Market Analysis, Insights and Forecast - by Sealant Resin
- 5.3.1. Silicone
- 5.3.2. Polyurethane
- 5.3.3. Acrylic
- 5.3.4. Epoxy
- 5.3.5. Other Re
- 5.4. Market Analysis, Insights and Forecast - by End-user Industry
- 5.4.1. Aerospace
- 5.4.2. Automotive
- 5.4.3. Building and Construction
- 5.4.4. Footwear and Leather
- 5.4.5. Healthcare
- 5.4.6. Packaging
- 5.4.7. Woodwork and Joinery
- 5.4.8. Other En
- 5.5. Market Analysis, Insights and Forecast - by Region
- 5.5.1. Asia Pacific
- 5.5.2. North America
- 5.5.3. Europe
- 5.5.4. South America
- 5.5.5. Middle East and Africa
- 5.1. Market Analysis, Insights and Forecast - by Adhesive Resin
- 6. Asia Pacific Adhesives and Sealants Market Analysis, Insights and Forecast, 2019-2031
- 6.1. Market Analysis, Insights and Forecast - by Adhesive Resin
- 6.1.1. Polyurethane
- 6.1.2. Epoxy
- 6.1.3. Acrylic
- 6.1.4. Silicone
- 6.1.5. Cyanoacrylate
- 6.1.6. VAE/EVA
- 6.1.7. Other Resins (Polyester, Rubber, etc.)
- 6.2. Market Analysis, Insights and Forecast - by Adhesives Technology
- 6.2.1. Solvent-borne
- 6.2.2. Reactive
- 6.2.3. Hot Melt
- 6.2.4. UV-cured Adhesives
- 6.2.5. Water-borne
- 6.3. Market Analysis, Insights and Forecast - by Sealant Resin
- 6.3.1. Silicone
- 6.3.2. Polyurethane
- 6.3.3. Acrylic
- 6.3.4. Epoxy
- 6.3.5. Other Re
- 6.4. Market Analysis, Insights and Forecast - by End-user Industry
- 6.4.1. Aerospace
- 6.4.2. Automotive
- 6.4.3. Building and Construction
- 6.4.4. Footwear and Leather
- 6.4.5. Healthcare
- 6.4.6. Packaging
- 6.4.7. Woodwork and Joinery
- 6.4.8. Other En
- 6.1. Market Analysis, Insights and Forecast - by Adhesive Resin
- 7. North America Adhesives and Sealants Market Analysis, Insights and Forecast, 2019-2031
- 7.1. Market Analysis, Insights and Forecast - by Adhesive Resin
- 7.1.1. Polyurethane
- 7.1.2. Epoxy
- 7.1.3. Acrylic
- 7.1.4. Silicone
- 7.1.5. Cyanoacrylate
- 7.1.6. VAE/EVA
- 7.1.7. Other Resins (Polyester, Rubber, etc.)
- 7.2. Market Analysis, Insights and Forecast - by Adhesives Technology
- 7.2.1. Solvent-borne
- 7.2.2. Reactive
- 7.2.3. Hot Melt
- 7.2.4. UV-cured Adhesives
- 7.2.5. Water-borne
- 7.3. Market Analysis, Insights and Forecast - by Sealant Resin
- 7.3.1. Silicone
- 7.3.2. Polyurethane
- 7.3.3. Acrylic
- 7.3.4. Epoxy
- 7.3.5. Other Re
- 7.4. Market Analysis, Insights and Forecast - by End-user Industry
- 7.4.1. Aerospace
- 7.4.2. Automotive
- 7.4.3. Building and Construction
- 7.4.4. Footwear and Leather
- 7.4.5. Healthcare
- 7.4.6. Packaging
- 7.4.7. Woodwork and Joinery
- 7.4.8. Other En
- 7.1. Market Analysis, Insights and Forecast - by Adhesive Resin
- 8. Europe Adhesives and Sealants Market Analysis, Insights and Forecast, 2019-2031
- 8.1. Market Analysis, Insights and Forecast - by Adhesive Resin
- 8.1.1. Polyurethane
- 8.1.2. Epoxy
- 8.1.3. Acrylic
- 8.1.4. Silicone
- 8.1.5. Cyanoacrylate
- 8.1.6. VAE/EVA
- 8.1.7. Other Resins (Polyester, Rubber, etc.)
- 8.2. Market Analysis, Insights and Forecast - by Adhesives Technology
- 8.2.1. Solvent-borne
- 8.2.2. Reactive
- 8.2.3. Hot Melt
- 8.2.4. UV-cured Adhesives
- 8.2.5. Water-borne
- 8.3. Market Analysis, Insights and Forecast - by Sealant Resin
- 8.3.1. Silicone
- 8.3.2. Polyurethane
- 8.3.3. Acrylic
- 8.3.4. Epoxy
- 8.3.5. Other Re
- 8.4. Market Analysis, Insights and Forecast - by End-user Industry
- 8.4.1. Aerospace
- 8.4.2. Automotive
- 8.4.3. Building and Construction
- 8.4.4. Footwear and Leather
- 8.4.5. Healthcare
- 8.4.6. Packaging
- 8.4.7. Woodwork and Joinery
- 8.4.8. Other En
- 8.1. Market Analysis, Insights and Forecast - by Adhesive Resin
- 9. South America Adhesives and Sealants Market Analysis, Insights and Forecast, 2019-2031
- 9.1. Market Analysis, Insights and Forecast - by Adhesive Resin
- 9.1.1. Polyurethane
- 9.1.2. Epoxy
- 9.1.3. Acrylic
- 9.1.4. Silicone
- 9.1.5. Cyanoacrylate
- 9.1.6. VAE/EVA
- 9.1.7. Other Resins (Polyester, Rubber, etc.)
- 9.2. Market Analysis, Insights and Forecast - by Adhesives Technology
- 9.2.1. Solvent-borne
- 9.2.2. Reactive
- 9.2.3. Hot Melt
- 9.2.4. UV-cured Adhesives
- 9.2.5. Water-borne
- 9.3. Market Analysis, Insights and Forecast - by Sealant Resin
- 9.3.1. Silicone
- 9.3.2. Polyurethane
- 9.3.3. Acrylic
- 9.3.4. Epoxy
- 9.3.5. Other Re
- 9.4. Market Analysis, Insights and Forecast - by End-user Industry
- 9.4.1. Aerospace
- 9.4.2. Automotive
- 9.4.3. Building and Construction
- 9.4.4. Footwear and Leather
- 9.4.5. Healthcare
- 9.4.6. Packaging
- 9.4.7. Woodwork and Joinery
- 9.4.8. Other En
- 9.1. Market Analysis, Insights and Forecast - by Adhesive Resin
- 10. Middle East and Africa Adhesives and Sealants Market Analysis, Insights and Forecast, 2019-2031
- 10.1. Market Analysis, Insights and Forecast - by Adhesive Resin
- 10.1.1. Polyurethane
- 10.1.2. Epoxy
- 10.1.3. Acrylic
- 10.1.4. Silicone
- 10.1.5. Cyanoacrylate
- 10.1.6. VAE/EVA
- 10.1.7. Other Resins (Polyester, Rubber, etc.)
- 10.2. Market Analysis, Insights and Forecast - by Adhesives Technology
- 10.2.1. Solvent-borne
- 10.2.2. Reactive
- 10.2.3. Hot Melt
- 10.2.4. UV-cured Adhesives
- 10.2.5. Water-borne
- 10.3. Market Analysis, Insights and Forecast - by Sealant Resin
- 10.3.1. Silicone
- 10.3.2. Polyurethane
- 10.3.3. Acrylic
- 10.3.4. Epoxy
- 10.3.5. Other Re
- 10.4. Market Analysis, Insights and Forecast - by End-user Industry
- 10.4.1. Aerospace
- 10.4.2. Automotive
- 10.4.3. Building and Construction
- 10.4.4. Footwear and Leather
- 10.4.5. Healthcare
- 10.4.6. Packaging
- 10.4.7. Woodwork and Joinery
- 10.4.8. Other En
- 10.1. Market Analysis, Insights and Forecast - by Adhesive Resin
- 11. North America Adhesives and Sealants Market Analysis, Insights and Forecast, 2019-2031
- 11.1. Market Analysis, Insights and Forecast - By Country/Sub-region
- 11.1.1 United States
- 11.1.2 Canada
- 11.1.3 Mexico
- 12. Europe Adhesives and Sealants Market Analysis, Insights and Forecast, 2019-2031
- 12.1. Market Analysis, Insights and Forecast - By Country/Sub-region
- 12.1.1 Germany
- 12.1.2 United Kingdom
- 12.1.3 France
- 12.1.4 Spain
- 12.1.5 Italy
- 12.1.6 Spain
- 12.1.7 Belgium
- 12.1.8 Netherland
- 12.1.9 Nordics
- 12.1.10 Rest of Europe
- 13. Asia Pacific Adhesives and Sealants Market Analysis, Insights and Forecast, 2019-2031
- 13.1. Market Analysis, Insights and Forecast - By Country/Sub-region
- 13.1.1 China
- 13.1.2 Japan
- 13.1.3 India
- 13.1.4 South Korea
- 13.1.5 Southeast Asia
- 13.1.6 Australia
- 13.1.7 Indonesia
- 13.1.8 Phillipes
- 13.1.9 Singapore
- 13.1.10 Thailandc
- 13.1.11 Rest of Asia Pacific
- 14. South America Adhesives and Sealants Market Analysis, Insights and Forecast, 2019-2031
- 14.1. Market Analysis, Insights and Forecast - By Country/Sub-region
- 14.1.1 Brazil
- 14.1.2 Argentina
- 14.1.3 Peru
- 14.1.4 Chile
- 14.1.5 Colombia
- 14.1.6 Ecuador
- 14.1.7 Venezuela
- 14.1.8 Rest of South America
- 15. North America Adhesives and Sealants Market Analysis, Insights and Forecast, 2019-2031
- 15.1. Market Analysis, Insights and Forecast - By Country/Sub-region
- 15.1.1 United States
- 15.1.2 Canada
- 15.1.3 Mexico
- 16. MEA Adhesives and Sealants Market Analysis, Insights and Forecast, 2019-2031
- 16.1. Market Analysis, Insights and Forecast - By Country/Sub-region
- 16.1.1 United Arab Emirates
- 16.1.2 Saudi Arabia
- 16.1.3 South Africa
- 16.1.4 Rest of Middle East and Africa
- 17. Competitive Analysis
- 17.1. Global Market Share Analysis 2024
- 17.2. Company Profiles
- 17.2.1 Henkel AG & Co KGaA
- 17.2.1.1. Overview
- 17.2.1.2. Products
- 17.2.1.3. SWOT Analysis
- 17.2.1.4. Recent Developments
- 17.2.1.5. Financials (Based on Availability)
- 17.2.2 Akzo Nobel NV
- 17.2.2.1. Overview
- 17.2.2.2. Products
- 17.2.2.3. SWOT Analysis
- 17.2.2.4. Recent Developments
- 17.2.2.5. Financials (Based on Availability)
- 17.2.3 Pidilite Industries Ltd
- 17.2.3.1. Overview
- 17.2.3.2. Products
- 17.2.3.3. SWOT Analysis
- 17.2.3.4. Recent Developments
- 17.2.3.5. Financials (Based on Availability)
- 17.2.4 3M
- 17.2.4.1. Overview
- 17.2.4.2. Products
- 17.2.4.3. SWOT Analysis
- 17.2.4.4. Recent Developments
- 17.2.4.5. Financials (Based on Availability)
- 17.2.5 NANPAO RESINS CHEMICAL GROUP
- 17.2.5.1. Overview
- 17.2.5.2. Products
- 17.2.5.3. SWOT Analysis
- 17.2.5.4. Recent Developments
- 17.2.5.5. Financials (Based on Availability)
- 17.2.6 Illinois Tool Works Inc
- 17.2.6.1. Overview
- 17.2.6.2. Products
- 17.2.6.3. SWOT Analysis
- 17.2.6.4. Recent Developments
- 17.2.6.5. Financials (Based on Availability)
- 17.2.7 Arkema Group
- 17.2.7.1. Overview
- 17.2.7.2. Products
- 17.2.7.3. SWOT Analysis
- 17.2.7.4. Recent Developments
- 17.2.7.5. Financials (Based on Availability)
- 17.2.8 Huntsman International LLC
- 17.2.8.1. Overview
- 17.2.8.2. Products
- 17.2.8.3. SWOT Analysis
- 17.2.8.4. Recent Developments
- 17.2.8.5. Financials (Based on Availability)
- 17.2.9 DuPont
- 17.2.9.1. Overview
- 17.2.9.2. Products
- 17.2.9.3. SWOT Analysis
- 17.2.9.4. Recent Developments
- 17.2.9.5. Financials (Based on Availability)
- 17.2.10 Dow
- 17.2.10.1. Overview
- 17.2.10.2. Products
- 17.2.10.3. SWOT Analysis
- 17.2.10.4. Recent Developments
- 17.2.10.5. Financials (Based on Availability)
- 17.2.11 H B Fuller Company
- 17.2.11.1. Overview
- 17.2.11.2. Products
- 17.2.11.3. SWOT Analysis
- 17.2.11.4. Recent Developments
- 17.2.11.5. Financials (Based on Availability)
- 17.2.12 Aica Kogyo Co Ltd
- 17.2.12.1. Overview
- 17.2.12.2. Products
- 17.2.12.3. SWOT Analysis
- 17.2.12.4. Recent Developments
- 17.2.12.5. Financials (Based on Availability)
- 17.2.13 Sika AG
- 17.2.13.1. Overview
- 17.2.13.2. Products
- 17.2.13.3. SWOT Analysis
- 17.2.13.4. Recent Developments
- 17.2.13.5. Financials (Based on Availability)
- 17.2.14 MAPEI SpA
- 17.2.14.1. Overview
- 17.2.14.2. Products
- 17.2.14.3. SWOT Analysis
- 17.2.14.4. Recent Developments
- 17.2.14.5. Financials (Based on Availability)
- 17.2.15 AVERY DENNISON CORPORATION
- 17.2.15.1. Overview
- 17.2.15.2. Products
- 17.2.15.3. SWOT Analysis
- 17.2.15.4. Recent Developments
- 17.2.15.5. Financials (Based on Availability)
- 17.2.16 Soudal Holding NV*List Not Exhaustive
- 17.2.16.1. Overview
- 17.2.16.2. Products
- 17.2.16.3. SWOT Analysis
- 17.2.16.4. Recent Developments
- 17.2.16.5. Financials (Based on Availability)
- 17.2.1 Henkel AG & Co KGaA
List of Figures
- Figure 1: Global Adhesives and Sealants Market Revenue Breakdown (Million, %) by Region 2024 & 2032
- Figure 2: Global Adhesives and Sealants Market Volume Breakdown (liter , %) by Region 2024 & 2032
- Figure 3: North America Adhesives and Sealants Market Revenue (Million), by Country 2024 & 2032
- Figure 4: North America Adhesives and Sealants Market Volume (liter ), by Country 2024 & 2032
- Figure 5: North America Adhesives and Sealants Market Revenue Share (%), by Country 2024 & 2032
- Figure 6: North America Adhesives and Sealants Market Volume Share (%), by Country 2024 & 2032
- Figure 7: Europe Adhesives and Sealants Market Revenue (Million), by Country 2024 & 2032
- Figure 8: Europe Adhesives and Sealants Market Volume (liter ), by Country 2024 & 2032
- Figure 9: Europe Adhesives and Sealants Market Revenue Share (%), by Country 2024 & 2032
- Figure 10: Europe Adhesives and Sealants Market Volume Share (%), by Country 2024 & 2032
- Figure 11: Asia Pacific Adhesives and Sealants Market Revenue (Million), by Country 2024 & 2032
- Figure 12: Asia Pacific Adhesives and Sealants Market Volume (liter ), by Country 2024 & 2032
- Figure 13: Asia Pacific Adhesives and Sealants Market Revenue Share (%), by Country 2024 & 2032
- Figure 14: Asia Pacific Adhesives and Sealants Market Volume Share (%), by Country 2024 & 2032
- Figure 15: South America Adhesives and Sealants Market Revenue (Million), by Country 2024 & 2032
- Figure 16: South America Adhesives and Sealants Market Volume (liter ), by Country 2024 & 2032
- Figure 17: South America Adhesives and Sealants Market Revenue Share (%), by Country 2024 & 2032
- Figure 18: South America Adhesives and Sealants Market Volume Share (%), by Country 2024 & 2032
- Figure 19: North America Adhesives and Sealants Market Revenue (Million), by Country 2024 & 2032
- Figure 20: North America Adhesives and Sealants Market Volume (liter ), by Country 2024 & 2032
- Figure 21: North America Adhesives and Sealants Market Revenue Share (%), by Country 2024 & 2032
- Figure 22: North America Adhesives and Sealants Market Volume Share (%), by Country 2024 & 2032
- Figure 23: MEA Adhesives and Sealants Market Revenue (Million), by Country 2024 & 2032
- Figure 24: MEA Adhesives and Sealants Market Volume (liter ), by Country 2024 & 2032
- Figure 25: MEA Adhesives and Sealants Market Revenue Share (%), by Country 2024 & 2032
- Figure 26: MEA Adhesives and Sealants Market Volume Share (%), by Country 2024 & 2032
- Figure 27: Asia Pacific Adhesives and Sealants Market Revenue (Million), by Adhesive Resin 2024 & 2032
- Figure 28: Asia Pacific Adhesives and Sealants Market Volume (liter ), by Adhesive Resin 2024 & 2032
- Figure 29: Asia Pacific Adhesives and Sealants Market Revenue Share (%), by Adhesive Resin 2024 & 2032
- Figure 30: Asia Pacific Adhesives and Sealants Market Volume Share (%), by Adhesive Resin 2024 & 2032
- Figure 31: Asia Pacific Adhesives and Sealants Market Revenue (Million), by Adhesives Technology 2024 & 2032
- Figure 32: Asia Pacific Adhesives and Sealants Market Volume (liter ), by Adhesives Technology 2024 & 2032
- Figure 33: Asia Pacific Adhesives and Sealants Market Revenue Share (%), by Adhesives Technology 2024 & 2032
- Figure 34: Asia Pacific Adhesives and Sealants Market Volume Share (%), by Adhesives Technology 2024 & 2032
- Figure 35: Asia Pacific Adhesives and Sealants Market Revenue (Million), by Sealant Resin 2024 & 2032
- Figure 36: Asia Pacific Adhesives and Sealants Market Volume (liter ), by Sealant Resin 2024 & 2032
- Figure 37: Asia Pacific Adhesives and Sealants Market Revenue Share (%), by Sealant Resin 2024 & 2032
- Figure 38: Asia Pacific Adhesives and Sealants Market Volume Share (%), by Sealant Resin 2024 & 2032
- Figure 39: Asia Pacific Adhesives and Sealants Market Revenue (Million), by End-user Industry 2024 & 2032
- Figure 40: Asia Pacific Adhesives and Sealants Market Volume (liter ), by End-user Industry 2024 & 2032
- Figure 41: Asia Pacific Adhesives and Sealants Market Revenue Share (%), by End-user Industry 2024 & 2032
- Figure 42: Asia Pacific Adhesives and Sealants Market Volume Share (%), by End-user Industry 2024 & 2032
- Figure 43: Asia Pacific Adhesives and Sealants Market Revenue (Million), by Country 2024 & 2032
- Figure 44: Asia Pacific Adhesives and Sealants Market Volume (liter ), by Country 2024 & 2032
- Figure 45: Asia Pacific Adhesives and Sealants Market Revenue Share (%), by Country 2024 & 2032
- Figure 46: Asia Pacific Adhesives and Sealants Market Volume Share (%), by Country 2024 & 2032
- Figure 47: North America Adhesives and Sealants Market Revenue (Million), by Adhesive Resin 2024 & 2032
- Figure 48: North America Adhesives and Sealants Market Volume (liter ), by Adhesive Resin 2024 & 2032
- Figure 49: North America Adhesives and Sealants Market Revenue Share (%), by Adhesive Resin 2024 & 2032
- Figure 50: North America Adhesives and Sealants Market Volume Share (%), by Adhesive Resin 2024 & 2032
- Figure 51: North America Adhesives and Sealants Market Revenue (Million), by Adhesives Technology 2024 & 2032
- Figure 52: North America Adhesives and Sealants Market Volume (liter ), by Adhesives Technology 2024 & 2032
- Figure 53: North America Adhesives and Sealants Market Revenue Share (%), by Adhesives Technology 2024 & 2032
- Figure 54: North America Adhesives and Sealants Market Volume Share (%), by Adhesives Technology 2024 & 2032
- Figure 55: North America Adhesives and Sealants Market Revenue (Million), by Sealant Resin 2024 & 2032
- Figure 56: North America Adhesives and Sealants Market Volume (liter ), by Sealant Resin 2024 & 2032
- Figure 57: North America Adhesives and Sealants Market Revenue Share (%), by Sealant Resin 2024 & 2032
- Figure 58: North America Adhesives and Sealants Market Volume Share (%), by Sealant Resin 2024 & 2032
- Figure 59: North America Adhesives and Sealants Market Revenue (Million), by End-user Industry 2024 & 2032
- Figure 60: North America Adhesives and Sealants Market Volume (liter ), by End-user Industry 2024 & 2032
- Figure 61: North America Adhesives and Sealants Market Revenue Share (%), by End-user Industry 2024 & 2032
- Figure 62: North America Adhesives and Sealants Market Volume Share (%), by End-user Industry 2024 & 2032
- Figure 63: North America Adhesives and Sealants Market Revenue (Million), by Country 2024 & 2032
- Figure 64: North America Adhesives and Sealants Market Volume (liter ), by Country 2024 & 2032
- Figure 65: North America Adhesives and Sealants Market Revenue Share (%), by Country 2024 & 2032
- Figure 66: North America Adhesives and Sealants Market Volume Share (%), by Country 2024 & 2032
- Figure 67: Europe Adhesives and Sealants Market Revenue (Million), by Adhesive Resin 2024 & 2032
- Figure 68: Europe Adhesives and Sealants Market Volume (liter ), by Adhesive Resin 2024 & 2032
- Figure 69: Europe Adhesives and Sealants Market Revenue Share (%), by Adhesive Resin 2024 & 2032
- Figure 70: Europe Adhesives and Sealants Market Volume Share (%), by Adhesive Resin 2024 & 2032
- Figure 71: Europe Adhesives and Sealants Market Revenue (Million), by Adhesives Technology 2024 & 2032
- Figure 72: Europe Adhesives and Sealants Market Volume (liter ), by Adhesives Technology 2024 & 2032
- Figure 73: Europe Adhesives and Sealants Market Revenue Share (%), by Adhesives Technology 2024 & 2032
- Figure 74: Europe Adhesives and Sealants Market Volume Share (%), by Adhesives Technology 2024 & 2032
- Figure 75: Europe Adhesives and Sealants Market Revenue (Million), by Sealant Resin 2024 & 2032
- Figure 76: Europe Adhesives and Sealants Market Volume (liter ), by Sealant Resin 2024 & 2032
- Figure 77: Europe Adhesives and Sealants Market Revenue Share (%), by Sealant Resin 2024 & 2032
- Figure 78: Europe Adhesives and Sealants Market Volume Share (%), by Sealant Resin 2024 & 2032
- Figure 79: Europe Adhesives and Sealants Market Revenue (Million), by End-user Industry 2024 & 2032
- Figure 80: Europe Adhesives and Sealants Market Volume (liter ), by End-user Industry 2024 & 2032
- Figure 81: Europe Adhesives and Sealants Market Revenue Share (%), by End-user Industry 2024 & 2032
- Figure 82: Europe Adhesives and Sealants Market Volume Share (%), by End-user Industry 2024 & 2032
- Figure 83: Europe Adhesives and Sealants Market Revenue (Million), by Country 2024 & 2032
- Figure 84: Europe Adhesives and Sealants Market Volume (liter ), by Country 2024 & 2032
- Figure 85: Europe Adhesives and Sealants Market Revenue Share (%), by Country 2024 & 2032
- Figure 86: Europe Adhesives and Sealants Market Volume Share (%), by Country 2024 & 2032
- Figure 87: South America Adhesives and Sealants Market Revenue (Million), by Adhesive Resin 2024 & 2032
- Figure 88: South America Adhesives and Sealants Market Volume (liter ), by Adhesive Resin 2024 & 2032
- Figure 89: South America Adhesives and Sealants Market Revenue Share (%), by Adhesive Resin 2024 & 2032
- Figure 90: South America Adhesives and Sealants Market Volume Share (%), by Adhesive Resin 2024 & 2032
- Figure 91: South America Adhesives and Sealants Market Revenue (Million), by Adhesives Technology 2024 & 2032
- Figure 92: South America Adhesives and Sealants Market Volume (liter ), by Adhesives Technology 2024 & 2032
- Figure 93: South America Adhesives and Sealants Market Revenue Share (%), by Adhesives Technology 2024 & 2032
- Figure 94: South America Adhesives and Sealants Market Volume Share (%), by Adhesives Technology 2024 & 2032
- Figure 95: South America Adhesives and Sealants Market Revenue (Million), by Sealant Resin 2024 & 2032
- Figure 96: South America Adhesives and Sealants Market Volume (liter ), by Sealant Resin 2024 & 2032
- Figure 97: South America Adhesives and Sealants Market Revenue Share (%), by Sealant Resin 2024 & 2032
- Figure 98: South America Adhesives and Sealants Market Volume Share (%), by Sealant Resin 2024 & 2032
- Figure 99: South America Adhesives and Sealants Market Revenue (Million), by End-user Industry 2024 & 2032
- Figure 100: South America Adhesives and Sealants Market Volume (liter ), by End-user Industry 2024 & 2032
- Figure 101: South America Adhesives and Sealants Market Revenue Share (%), by End-user Industry 2024 & 2032
- Figure 102: South America Adhesives and Sealants Market Volume Share (%), by End-user Industry 2024 & 2032
- Figure 103: South America Adhesives and Sealants Market Revenue (Million), by Country 2024 & 2032
- Figure 104: South America Adhesives and Sealants Market Volume (liter ), by Country 2024 & 2032
- Figure 105: South America Adhesives and Sealants Market Revenue Share (%), by Country 2024 & 2032
- Figure 106: South America Adhesives and Sealants Market Volume Share (%), by Country 2024 & 2032
- Figure 107: Middle East and Africa Adhesives and Sealants Market Revenue (Million), by Adhesive Resin 2024 & 2032
- Figure 108: Middle East and Africa Adhesives and Sealants Market Volume (liter ), by Adhesive Resin 2024 & 2032
- Figure 109: Middle East and Africa Adhesives and Sealants Market Revenue Share (%), by Adhesive Resin 2024 & 2032
- Figure 110: Middle East and Africa Adhesives and Sealants Market Volume Share (%), by Adhesive Resin 2024 & 2032
- Figure 111: Middle East and Africa Adhesives and Sealants Market Revenue (Million), by Adhesives Technology 2024 & 2032
- Figure 112: Middle East and Africa Adhesives and Sealants Market Volume (liter ), by Adhesives Technology 2024 & 2032
- Figure 113: Middle East and Africa Adhesives and Sealants Market Revenue Share (%), by Adhesives Technology 2024 & 2032
- Figure 114: Middle East and Africa Adhesives and Sealants Market Volume Share (%), by Adhesives Technology 2024 & 2032
- Figure 115: Middle East and Africa Adhesives and Sealants Market Revenue (Million), by Sealant Resin 2024 & 2032
- Figure 116: Middle East and Africa Adhesives and Sealants Market Volume (liter ), by Sealant Resin 2024 & 2032
- Figure 117: Middle East and Africa Adhesives and Sealants Market Revenue Share (%), by Sealant Resin 2024 & 2032
- Figure 118: Middle East and Africa Adhesives and Sealants Market Volume Share (%), by Sealant Resin 2024 & 2032
- Figure 119: Middle East and Africa Adhesives and Sealants Market Revenue (Million), by End-user Industry 2024 & 2032
- Figure 120: Middle East and Africa Adhesives and Sealants Market Volume (liter ), by End-user Industry 2024 & 2032
- Figure 121: Middle East and Africa Adhesives and Sealants Market Revenue Share (%), by End-user Industry 2024 & 2032
- Figure 122: Middle East and Africa Adhesives and Sealants Market Volume Share (%), by End-user Industry 2024 & 2032
- Figure 123: Middle East and Africa Adhesives and Sealants Market Revenue (Million), by Country 2024 & 2032
- Figure 124: Middle East and Africa Adhesives and Sealants Market Volume (liter ), by Country 2024 & 2032
- Figure 125: Middle East and Africa Adhesives and Sealants Market Revenue Share (%), by Country 2024 & 2032
- Figure 126: Middle East and Africa Adhesives and Sealants Market Volume Share (%), by Country 2024 & 2032
List of Tables
- Table 1: Global Adhesives and Sealants Market Revenue Million Forecast, by Region 2019 & 2032
- Table 2: Global Adhesives and Sealants Market Volume liter Forecast, by Region 2019 & 2032
- Table 3: Global Adhesives and Sealants Market Revenue Million Forecast, by Adhesive Resin 2019 & 2032
- Table 4: Global Adhesives and Sealants Market Volume liter Forecast, by Adhesive Resin 2019 & 2032
- Table 5: Global Adhesives and Sealants Market Revenue Million Forecast, by Adhesives Technology 2019 & 2032
- Table 6: Global Adhesives and Sealants Market Volume liter Forecast, by Adhesives Technology 2019 & 2032
- Table 7: Global Adhesives and Sealants Market Revenue Million Forecast, by Sealant Resin 2019 & 2032
- Table 8: Global Adhesives and Sealants Market Volume liter Forecast, by Sealant Resin 2019 & 2032
- Table 9: Global Adhesives and Sealants Market Revenue Million Forecast, by End-user Industry 2019 & 2032
- Table 10: Global Adhesives and Sealants Market Volume liter Forecast, by End-user Industry 2019 & 2032
- Table 11: Global Adhesives and Sealants Market Revenue Million Forecast, by Region 2019 & 2032
- Table 12: Global Adhesives and Sealants Market Volume liter Forecast, by Region 2019 & 2032
- Table 13: Global Adhesives and Sealants Market Revenue Million Forecast, by Country 2019 & 2032
- Table 14: Global Adhesives and Sealants Market Volume liter Forecast, by Country 2019 & 2032
- Table 15: United States Adhesives and Sealants Market Revenue (Million) Forecast, by Application 2019 & 2032
- Table 16: United States Adhesives and Sealants Market Volume (liter ) Forecast, by Application 2019 & 2032
- Table 17: Canada Adhesives and Sealants Market Revenue (Million) Forecast, by Application 2019 & 2032
- Table 18: Canada Adhesives and Sealants Market Volume (liter ) Forecast, by Application 2019 & 2032
- Table 19: Mexico Adhesives and Sealants Market Revenue (Million) Forecast, by Application 2019 & 2032
- Table 20: Mexico Adhesives and Sealants Market Volume (liter ) Forecast, by Application 2019 & 2032
- Table 21: Global Adhesives and Sealants Market Revenue Million Forecast, by Country 2019 & 2032
- Table 22: Global Adhesives and Sealants Market Volume liter Forecast, by Country 2019 & 2032
- Table 23: Germany Adhesives and Sealants Market Revenue (Million) Forecast, by Application 2019 & 2032
- Table 24: Germany Adhesives and Sealants Market Volume (liter ) Forecast, by Application 2019 & 2032
- Table 25: United Kingdom Adhesives and Sealants Market Revenue (Million) Forecast, by Application 2019 & 2032
- Table 26: United Kingdom Adhesives and Sealants Market Volume (liter ) Forecast, by Application 2019 & 2032
- Table 27: France Adhesives and Sealants Market Revenue (Million) Forecast, by Application 2019 & 2032
- Table 28: France Adhesives and Sealants Market Volume (liter ) Forecast, by Application 2019 & 2032
- Table 29: Spain Adhesives and Sealants Market Revenue (Million) Forecast, by Application 2019 & 2032
- Table 30: Spain Adhesives and Sealants Market Volume (liter ) Forecast, by Application 2019 & 2032
- Table 31: Italy Adhesives and Sealants Market Revenue (Million) Forecast, by Application 2019 & 2032
- Table 32: Italy Adhesives and Sealants Market Volume (liter ) Forecast, by Application 2019 & 2032
- Table 33: Spain Adhesives and Sealants Market Revenue (Million) Forecast, by Application 2019 & 2032
- Table 34: Spain Adhesives and Sealants Market Volume (liter ) Forecast, by Application 2019 & 2032
- Table 35: Belgium Adhesives and Sealants Market Revenue (Million) Forecast, by Application 2019 & 2032
- Table 36: Belgium Adhesives and Sealants Market Volume (liter ) Forecast, by Application 2019 & 2032
- Table 37: Netherland Adhesives and Sealants Market Revenue (Million) Forecast, by Application 2019 & 2032
- Table 38: Netherland Adhesives and Sealants Market Volume (liter ) Forecast, by Application 2019 & 2032
- Table 39: Nordics Adhesives and Sealants Market Revenue (Million) Forecast, by Application 2019 & 2032
- Table 40: Nordics Adhesives and Sealants Market Volume (liter ) Forecast, by Application 2019 & 2032
- Table 41: Rest of Europe Adhesives and Sealants Market Revenue (Million) Forecast, by Application 2019 & 2032
- Table 42: Rest of Europe Adhesives and Sealants Market Volume (liter ) Forecast, by Application 2019 & 2032
- Table 43: Global Adhesives and Sealants Market Revenue Million Forecast, by Country 2019 & 2032
- Table 44: Global Adhesives and Sealants Market Volume liter Forecast, by Country 2019 & 2032
- Table 45: China Adhesives and Sealants Market Revenue (Million) Forecast, by Application 2019 & 2032
- Table 46: China Adhesives and Sealants Market Volume (liter ) Forecast, by Application 2019 & 2032
- Table 47: Japan Adhesives and Sealants Market Revenue (Million) Forecast, by Application 2019 & 2032
- Table 48: Japan Adhesives and Sealants Market Volume (liter ) Forecast, by Application 2019 & 2032
- Table 49: India Adhesives and Sealants Market Revenue (Million) Forecast, by Application 2019 & 2032
- Table 50: India Adhesives and Sealants Market Volume (liter ) Forecast, by Application 2019 & 2032
- Table 51: South Korea Adhesives and Sealants Market Revenue (Million) Forecast, by Application 2019 & 2032
- Table 52: South Korea Adhesives and Sealants Market Volume (liter ) Forecast, by Application 2019 & 2032
- Table 53: Southeast Asia Adhesives and Sealants Market Revenue (Million) Forecast, by Application 2019 & 2032
- Table 54: Southeast Asia Adhesives and Sealants Market Volume (liter ) Forecast, by Application 2019 & 2032
- Table 55: Australia Adhesives and Sealants Market Revenue (Million) Forecast, by Application 2019 & 2032
- Table 56: Australia Adhesives and Sealants Market Volume (liter ) Forecast, by Application 2019 & 2032
- Table 57: Indonesia Adhesives and Sealants Market Revenue (Million) Forecast, by Application 2019 & 2032
- Table 58: Indonesia Adhesives and Sealants Market Volume (liter ) Forecast, by Application 2019 & 2032
- Table 59: Phillipes Adhesives and Sealants Market Revenue (Million) Forecast, by Application 2019 & 2032
- Table 60: Phillipes Adhesives and Sealants Market Volume (liter ) Forecast, by Application 2019 & 2032
- Table 61: Singapore Adhesives and Sealants Market Revenue (Million) Forecast, by Application 2019 & 2032
- Table 62: Singapore Adhesives and Sealants Market Volume (liter ) Forecast, by Application 2019 & 2032
- Table 63: Thailandc Adhesives and Sealants Market Revenue (Million) Forecast, by Application 2019 & 2032
- Table 64: Thailandc Adhesives and Sealants Market Volume (liter ) Forecast, by Application 2019 & 2032
- Table 65: Rest of Asia Pacific Adhesives and Sealants Market Revenue (Million) Forecast, by Application 2019 & 2032
- Table 66: Rest of Asia Pacific Adhesives and Sealants Market Volume (liter ) Forecast, by Application 2019 & 2032
- Table 67: Global Adhesives and Sealants Market Revenue Million Forecast, by Country 2019 & 2032
- Table 68: Global Adhesives and Sealants Market Volume liter Forecast, by Country 2019 & 2032
- Table 69: Brazil Adhesives and Sealants Market Revenue (Million) Forecast, by Application 2019 & 2032
- Table 70: Brazil Adhesives and Sealants Market Volume (liter ) Forecast, by Application 2019 & 2032
- Table 71: Argentina Adhesives and Sealants Market Revenue (Million) Forecast, by Application 2019 & 2032
- Table 72: Argentina Adhesives and Sealants Market Volume (liter ) Forecast, by Application 2019 & 2032
- Table 73: Peru Adhesives and Sealants Market Revenue (Million) Forecast, by Application 2019 & 2032
- Table 74: Peru Adhesives and Sealants Market Volume (liter ) Forecast, by Application 2019 & 2032
- Table 75: Chile Adhesives and Sealants Market Revenue (Million) Forecast, by Application 2019 & 2032
- Table 76: Chile Adhesives and Sealants Market Volume (liter ) Forecast, by Application 2019 & 2032
- Table 77: Colombia Adhesives and Sealants Market Revenue (Million) Forecast, by Application 2019 & 2032
- Table 78: Colombia Adhesives and Sealants Market Volume (liter ) Forecast, by Application 2019 & 2032
- Table 79: Ecuador Adhesives and Sealants Market Revenue (Million) Forecast, by Application 2019 & 2032
- Table 80: Ecuador Adhesives and Sealants Market Volume (liter ) Forecast, by Application 2019 & 2032
- Table 81: Venezuela Adhesives and Sealants Market Revenue (Million) Forecast, by Application 2019 & 2032
- Table 82: Venezuela Adhesives and Sealants Market Volume (liter ) Forecast, by Application 2019 & 2032
- Table 83: Rest of South America Adhesives and Sealants Market Revenue (Million) Forecast, by Application 2019 & 2032
- Table 84: Rest of South America Adhesives and Sealants Market Volume (liter ) Forecast, by Application 2019 & 2032
- Table 85: Global Adhesives and Sealants Market Revenue Million Forecast, by Country 2019 & 2032
- Table 86: Global Adhesives and Sealants Market Volume liter Forecast, by Country 2019 & 2032
- Table 87: United States Adhesives and Sealants Market Revenue (Million) Forecast, by Application 2019 & 2032
- Table 88: United States Adhesives and Sealants Market Volume (liter ) Forecast, by Application 2019 & 2032
- Table 89: Canada Adhesives and Sealants Market Revenue (Million) Forecast, by Application 2019 & 2032
- Table 90: Canada Adhesives and Sealants Market Volume (liter ) Forecast, by Application 2019 & 2032
- Table 91: Mexico Adhesives and Sealants Market Revenue (Million) Forecast, by Application 2019 & 2032
- Table 92: Mexico Adhesives and Sealants Market Volume (liter ) Forecast, by Application 2019 & 2032
- Table 93: Global Adhesives and Sealants Market Revenue Million Forecast, by Country 2019 & 2032
- Table 94: Global Adhesives and Sealants Market Volume liter Forecast, by Country 2019 & 2032
- Table 95: United Arab Emirates Adhesives and Sealants Market Revenue (Million) Forecast, by Application 2019 & 2032
- Table 96: United Arab Emirates Adhesives and Sealants Market Volume (liter ) Forecast, by Application 2019 & 2032
- Table 97: Saudi Arabia Adhesives and Sealants Market Revenue (Million) Forecast, by Application 2019 & 2032
- Table 98: Saudi Arabia Adhesives and Sealants Market Volume (liter ) Forecast, by Application 2019 & 2032
- Table 99: South Africa Adhesives and Sealants Market Revenue (Million) Forecast, by Application 2019 & 2032
- Table 100: South Africa Adhesives and Sealants Market Volume (liter ) Forecast, by Application 2019 & 2032
- Table 101: Rest of Middle East and Africa Adhesives and Sealants Market Revenue (Million) Forecast, by Application 2019 & 2032
- Table 102: Rest of Middle East and Africa Adhesives and Sealants Market Volume (liter ) Forecast, by Application 2019 & 2032
- Table 103: Global Adhesives and Sealants Market Revenue Million Forecast, by Adhesive Resin 2019 & 2032
- Table 104: Global Adhesives and Sealants Market Volume liter Forecast, by Adhesive Resin 2019 & 2032
- Table 105: Global Adhesives and Sealants Market Revenue Million Forecast, by Adhesives Technology 2019 & 2032
- Table 106: Global Adhesives and Sealants Market Volume liter Forecast, by Adhesives Technology 2019 & 2032
- Table 107: Global Adhesives and Sealants Market Revenue Million Forecast, by Sealant Resin 2019 & 2032
- Table 108: Global Adhesives and Sealants Market Volume liter Forecast, by Sealant Resin 2019 & 2032
- Table 109: Global Adhesives and Sealants Market Revenue Million Forecast, by End-user Industry 2019 & 2032
- Table 110: Global Adhesives and Sealants Market Volume liter Forecast, by End-user Industry 2019 & 2032
- Table 111: Global Adhesives and Sealants Market Revenue Million Forecast, by Country 2019 & 2032
- Table 112: Global Adhesives and Sealants Market Volume liter Forecast, by Country 2019 & 2032
- Table 113: China Adhesives and Sealants Market Revenue (Million) Forecast, by Application 2019 & 2032
- Table 114: China Adhesives and Sealants Market Volume (liter ) Forecast, by Application 2019 & 2032
- Table 115: India Adhesives and Sealants Market Revenue (Million) Forecast, by Application 2019 & 2032
- Table 116: India Adhesives and Sealants Market Volume (liter ) Forecast, by Application 2019 & 2032
- Table 117: Japan Adhesives and Sealants Market Revenue (Million) Forecast, by Application 2019 & 2032
- Table 118: Japan Adhesives and Sealants Market Volume (liter ) Forecast, by Application 2019 & 2032
- Table 119: South Korea Adhesives and Sealants Market Revenue (Million) Forecast, by Application 2019 & 2032
- Table 120: South Korea Adhesives and Sealants Market Volume (liter ) Forecast, by Application 2019 & 2032
- Table 121: Indonesia Adhesives and Sealants Market Revenue (Million) Forecast, by Application 2019 & 2032
- Table 122: Indonesia Adhesives and Sealants Market Volume (liter ) Forecast, by Application 2019 & 2032
- Table 123: Malaysia Adhesives and Sealants Market Revenue (Million) Forecast, by Application 2019 & 2032
- Table 124: Malaysia Adhesives and Sealants Market Volume (liter ) Forecast, by Application 2019 & 2032
- Table 125: Thailand Adhesives and Sealants Market Revenue (Million) Forecast, by Application 2019 & 2032
- Table 126: Thailand Adhesives and Sealants Market Volume (liter ) Forecast, by Application 2019 & 2032
- Table 127: Vietnam Adhesives and Sealants Market Revenue (Million) Forecast, by Application 2019 & 2032
- Table 128: Vietnam Adhesives and Sealants Market Volume (liter ) Forecast, by Application 2019 & 2032
- Table 129: Rest of Asia Pacific Adhesives and Sealants Market Revenue (Million) Forecast, by Application 2019 & 2032
- Table 130: Rest of Asia Pacific Adhesives and Sealants Market Volume (liter ) Forecast, by Application 2019 & 2032
- Table 131: Global Adhesives and Sealants Market Revenue Million Forecast, by Adhesive Resin 2019 & 2032
- Table 132: Global Adhesives and Sealants Market Volume liter Forecast, by Adhesive Resin 2019 & 2032
- Table 133: Global Adhesives and Sealants Market Revenue Million Forecast, by Adhesives Technology 2019 & 2032
- Table 134: Global Adhesives and Sealants Market Volume liter Forecast, by Adhesives Technology 2019 & 2032
- Table 135: Global Adhesives and Sealants Market Revenue Million Forecast, by Sealant Resin 2019 & 2032
- Table 136: Global Adhesives and Sealants Market Volume liter Forecast, by Sealant Resin 2019 & 2032
- Table 137: Global Adhesives and Sealants Market Revenue Million Forecast, by End-user Industry 2019 & 2032
- Table 138: Global Adhesives and Sealants Market Volume liter Forecast, by End-user Industry 2019 & 2032
- Table 139: Global Adhesives and Sealants Market Revenue Million Forecast, by Country 2019 & 2032
- Table 140: Global Adhesives and Sealants Market Volume liter Forecast, by Country 2019 & 2032
- Table 141: United States Adhesives and Sealants Market Revenue (Million) Forecast, by Application 2019 & 2032
- Table 142: United States Adhesives and Sealants Market Volume (liter ) Forecast, by Application 2019 & 2032
- Table 143: Canada Adhesives and Sealants Market Revenue (Million) Forecast, by Application 2019 & 2032
- Table 144: Canada Adhesives and Sealants Market Volume (liter ) Forecast, by Application 2019 & 2032
- Table 145: Mexico Adhesives and Sealants Market Revenue (Million) Forecast, by Application 2019 & 2032
- Table 146: Mexico Adhesives and Sealants Market Volume (liter ) Forecast, by Application 2019 & 2032
- Table 147: Global Adhesives and Sealants Market Revenue Million Forecast, by Adhesive Resin 2019 & 2032
- Table 148: Global Adhesives and Sealants Market Volume liter Forecast, by Adhesive Resin 2019 & 2032
- Table 149: Global Adhesives and Sealants Market Revenue Million Forecast, by Adhesives Technology 2019 & 2032
- Table 150: Global Adhesives and Sealants Market Volume liter Forecast, by Adhesives Technology 2019 & 2032
- Table 151: Global Adhesives and Sealants Market Revenue Million Forecast, by Sealant Resin 2019 & 2032
- Table 152: Global Adhesives and Sealants Market Volume liter Forecast, by Sealant Resin 2019 & 2032
- Table 153: Global Adhesives and Sealants Market Revenue Million Forecast, by End-user Industry 2019 & 2032
- Table 154: Global Adhesives and Sealants Market Volume liter Forecast, by End-user Industry 2019 & 2032
- Table 155: Global Adhesives and Sealants Market Revenue Million Forecast, by Country 2019 & 2032
- Table 156: Global Adhesives and Sealants Market Volume liter Forecast, by Country 2019 & 2032
- Table 157: Germany Adhesives and Sealants Market Revenue (Million) Forecast, by Application 2019 & 2032
- Table 158: Germany Adhesives and Sealants Market Volume (liter ) Forecast, by Application 2019 & 2032
- Table 159: United Kingdom Adhesives and Sealants Market Revenue (Million) Forecast, by Application 2019 & 2032
- Table 160: United Kingdom Adhesives and Sealants Market Volume (liter ) Forecast, by Application 2019 & 2032
- Table 161: France Adhesives and Sealants Market Revenue (Million) Forecast, by Application 2019 & 2032
- Table 162: France Adhesives and Sealants Market Volume (liter ) Forecast, by Application 2019 & 2032
- Table 163: Italy Adhesives and Sealants Market Revenue (Million) Forecast, by Application 2019 & 2032
- Table 164: Italy Adhesives and Sealants Market Volume (liter ) Forecast, by Application 2019 & 2032
- Table 165: Spain Adhesives and Sealants Market Revenue (Million) Forecast, by Application 2019 & 2032
- Table 166: Spain Adhesives and Sealants Market Volume (liter ) Forecast, by Application 2019 & 2032
- Table 167: Russia Adhesives and Sealants Market Revenue (Million) Forecast, by Application 2019 & 2032
- Table 168: Russia Adhesives and Sealants Market Volume (liter ) Forecast, by Application 2019 & 2032
- Table 169: Turkey Adhesives and Sealants Market Revenue (Million) Forecast, by Application 2019 & 2032
- Table 170: Turkey Adhesives and Sealants Market Volume (liter ) Forecast, by Application 2019 & 2032
- Table 171: NORDIC Countries Adhesives and Sealants Market Revenue (Million) Forecast, by Application 2019 & 2032
- Table 172: NORDIC Countries Adhesives and Sealants Market Volume (liter ) Forecast, by Application 2019 & 2032
- Table 173: Rest of Europe Adhesives and Sealants Market Revenue (Million) Forecast, by Application 2019 & 2032
- Table 174: Rest of Europe Adhesives and Sealants Market Volume (liter ) Forecast, by Application 2019 & 2032
- Table 175: Global Adhesives and Sealants Market Revenue Million Forecast, by Adhesive Resin 2019 & 2032
- Table 176: Global Adhesives and Sealants Market Volume liter Forecast, by Adhesive Resin 2019 & 2032
- Table 177: Global Adhesives and Sealants Market Revenue Million Forecast, by Adhesives Technology 2019 & 2032
- Table 178: Global Adhesives and Sealants Market Volume liter Forecast, by Adhesives Technology 2019 & 2032
- Table 179: Global Adhesives and Sealants Market Revenue Million Forecast, by Sealant Resin 2019 & 2032
- Table 180: Global Adhesives and Sealants Market Volume liter Forecast, by Sealant Resin 2019 & 2032
- Table 181: Global Adhesives and Sealants Market Revenue Million Forecast, by End-user Industry 2019 & 2032
- Table 182: Global Adhesives and Sealants Market Volume liter Forecast, by End-user Industry 2019 & 2032
- Table 183: Global Adhesives and Sealants Market Revenue Million Forecast, by Country 2019 & 2032
- Table 184: Global Adhesives and Sealants Market Volume liter Forecast, by Country 2019 & 2032
- Table 185: Brazil Adhesives and Sealants Market Revenue (Million) Forecast, by Application 2019 & 2032
- Table 186: Brazil Adhesives and Sealants Market Volume (liter ) Forecast, by Application 2019 & 2032
- Table 187: Argentina Adhesives and Sealants Market Revenue (Million) Forecast, by Application 2019 & 2032
- Table 188: Argentina Adhesives and Sealants Market Volume (liter ) Forecast, by Application 2019 & 2032
- Table 189: Colombia Adhesives and Sealants Market Revenue (Million) Forecast, by Application 2019 & 2032
- Table 190: Colombia Adhesives and Sealants Market Volume (liter ) Forecast, by Application 2019 & 2032
- Table 191: Rest of South America Adhesives and Sealants Market Revenue (Million) Forecast, by Application 2019 & 2032
- Table 192: Rest of South America Adhesives and Sealants Market Volume (liter ) Forecast, by Application 2019 & 2032
- Table 193: Global Adhesives and Sealants Market Revenue Million Forecast, by Adhesive Resin 2019 & 2032
- Table 194: Global Adhesives and Sealants Market Volume liter Forecast, by Adhesive Resin 2019 & 2032
- Table 195: Global Adhesives and Sealants Market Revenue Million Forecast, by Adhesives Technology 2019 & 2032
- Table 196: Global Adhesives and Sealants Market Volume liter Forecast, by Adhesives Technology 2019 & 2032
- Table 197: Global Adhesives and Sealants Market Revenue Million Forecast, by Sealant Resin 2019 & 2032
- Table 198: Global Adhesives and Sealants Market Volume liter Forecast, by Sealant Resin 2019 & 2032
- Table 199: Global Adhesives and Sealants Market Revenue Million Forecast, by End-user Industry 2019 & 2032
- Table 200: Global Adhesives and Sealants Market Volume liter Forecast, by End-user Industry 2019 & 2032
- Table 201: Global Adhesives and Sealants Market Revenue Million Forecast, by Country 2019 & 2032
- Table 202: Global Adhesives and Sealants Market Volume liter Forecast, by Country 2019 & 2032
- Table 203: Saudi Arabia Adhesives and Sealants Market Revenue (Million) Forecast, by Application 2019 & 2032
- Table 204: Saudi Arabia Adhesives and Sealants Market Volume (liter ) Forecast, by Application 2019 & 2032
- Table 205: South Africa Adhesives and Sealants Market Revenue (Million) Forecast, by Application 2019 & 2032
- Table 206: South Africa Adhesives and Sealants Market Volume (liter ) Forecast, by Application 2019 & 2032
- Table 207: Qatar Adhesives and Sealants Market Revenue (Million) Forecast, by Application 2019 & 2032
- Table 208: Qatar Adhesives and Sealants Market Volume (liter ) Forecast, by Application 2019 & 2032
- Table 209: United Arab Emirates Adhesives and Sealants Market Revenue (Million) Forecast, by Application 2019 & 2032
- Table 210: United Arab Emirates Adhesives and Sealants Market Volume (liter ) Forecast, by Application 2019 & 2032
- Table 211: Egypt Adhesives and Sealants Market Revenue (Million) Forecast, by Application 2019 & 2032
- Table 212: Egypt Adhesives and Sealants Market Volume (liter ) Forecast, by Application 2019 & 2032
- Table 213: Algeria Adhesives and Sealants Market Revenue (Million) Forecast, by Application 2019 & 2032
- Table 214: Algeria Adhesives and Sealants Market Volume (liter ) Forecast, by Application 2019 & 2032
- Table 215: Rest of Middle East and Africa Adhesives and Sealants Market Revenue (Million) Forecast, by Application 2019 & 2032
- Table 216: Rest of Middle East and Africa Adhesives and Sealants Market Volume (liter ) Forecast, by Application 2019 & 2032
Frequently Asked Questions
1. What is the projected Compound Annual Growth Rate (CAGR) of the Adhesives and Sealants Market?
The projected CAGR is approximately > 6.00%.
2. Which companies are prominent players in the Adhesives and Sealants Market?
Key companies in the market include Henkel AG & Co KGaA, Akzo Nobel NV, Pidilite Industries Ltd, 3M, NANPAO RESINS CHEMICAL GROUP, Illinois Tool Works Inc, Arkema Group, Huntsman International LLC, DuPont, Dow, H B Fuller Company, Aica Kogyo Co Ltd, Sika AG, MAPEI SpA, AVERY DENNISON CORPORATION, Soudal Holding NV*List Not Exhaustive.
3. What are the main segments of the Adhesives and Sealants Market?
The market segments include Adhesive Resin, Adhesives Technology, Sealant Resin, End-user Industry.
4. Can you provide details about the market size?
The market size is estimated to be USD 81.03 Million as of 2022.
5. What are some drivers contributing to market growth?
Expanding Building and Construction Sector; Increasing Demand from the Packaging Industry; Other Drivers.
6. What are the notable trends driving market growth?
Packaging Industry to Dominate the Market.
7. Are there any restraints impacting market growth?
Stringent Environmental Regulations Regarding VOC Emissions; High Fluctuations in Raw Material Pricing.
8. Can you provide examples of recent developments in the market?
May 2023: Henkel AG & Co. KGaA, a global leader in adhesives, sealants, and functional coatings, has officially opened its Technology Center in Bridgewater, New Jersey, US. The facility showcases Henkel’s entire technology portfolio of adhesives, sealants, functional coatings, and specialty materials and supports an environment for collaboration with customers from over 800 industry segments to develop innovative solutions.
9. What pricing options are available for accessing the report?
Pricing options include single-user, multi-user, and enterprise licenses priced at USD 4750, USD 5250, and USD 8750 respectively.
10. Is the market size provided in terms of value or volume?
The market size is provided in terms of value, measured in Million and volume, measured in liter .
11. Are there any specific market keywords associated with the report?
Yes, the market keyword associated with the report is "Adhesives and Sealants Market," which aids in identifying and referencing the specific market segment covered.
12. How do I determine which pricing option suits my needs best?
The pricing options vary based on user requirements and access needs. Individual users may opt for single-user licenses, while businesses requiring broader access may choose multi-user or enterprise licenses for cost-effective access to the report.
13. Are there any additional resources or data provided in the Adhesives and Sealants Market report?
While the report offers comprehensive insights, it's advisable to review the specific contents or supplementary materials provided to ascertain if additional resources or data are available.
14. How can I stay updated on further developments or reports in the Adhesives and Sealants Market?
To stay informed about further developments, trends, and reports in the Adhesives and Sealants Market, consider subscribing to industry newsletters, following relevant companies and organizations, or regularly checking reputable industry news sources and publications.
Methodology
Step 1 - Identification of Relevant Samples Size from Population Database


Step 2 - Approaches for Defining Global Market Size (Value, Volume* & Price*)

Note*: In applicable scenarios
Step 3 - Data Sources
Primary Research
- Web Analytics
- Survey Reports
- Research Institute
- Latest Research Reports
- Opinion Leaders
Secondary Research
- Annual Reports
- White Paper
- Latest Press Release
- Industry Association
- Paid Database
- Investor Presentations

Step 4 - Data Triangulation
Involves using different sources of information in order to increase the validity of a study
These sources are likely to be stakeholders in a program - participants, other researchers, program staff, other community members, and so on.
Then we put all data in single framework & apply various statistical tools to find out the dynamic on the market.
During the analysis stage, feedback from the stakeholder groups would be compared to determine areas of agreement as well as areas of divergence


