
Key Insights
The 3D radar market is experiencing robust growth, projected to reach a significant size by 2033, driven by a compound annual growth rate (CAGR) of 18.69%. This expansion is fueled by several key factors. Increased demand for enhanced situational awareness and improved surveillance capabilities across diverse sectors, including defense, aviation, and automotive, is a primary driver. The integration of advanced technologies like AI and machine learning is further enhancing the capabilities of 3D radar systems, leading to improved accuracy, range, and target detection. Furthermore, the growing need for effective counter-drone measures and border security solutions is significantly boosting market adoption. Government investments in upgrading defense and surveillance infrastructure across various regions are also contributing to this positive market outlook. While there might be potential restraints stemming from high initial investment costs and the complex nature of the technology, the overall market trajectory remains optimistic.
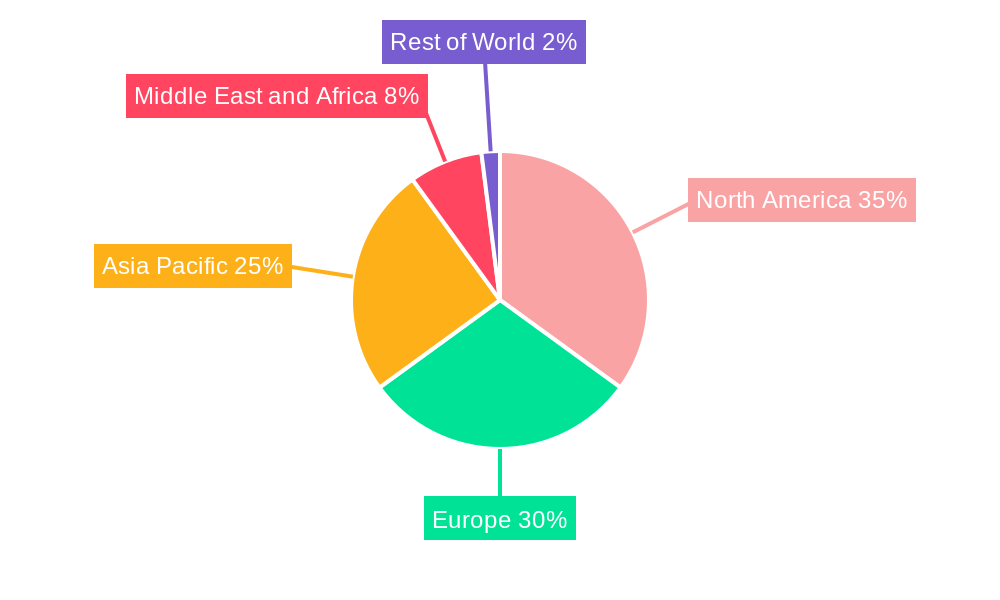
Segmentation reveals a diversified market landscape. Airborne radar systems maintain a significant share due to their widespread use in military and civilian aircraft. However, the ground-based and naval segments are also witnessing significant growth, driven by increasing demand for ground-based air defense and maritime surveillance systems. In terms of range, long-range radar systems dominate due to their ability to cover vast areas, but the medium and short-range segments are expected to experience considerable expansion, particularly in urban areas and localized security applications. Key players like SAAB, Honeywell, Rheinmetall, and others are actively engaged in developing and deploying cutting-edge 3D radar technologies, fostering innovation and competition within the market. Geographic distribution shows a strong presence across North America and Europe, however, the Asia-Pacific region is emerging as a key growth area, fuelled by substantial investments in infrastructure development and modernization.

3D Radar Industry Market Report: 2019-2033
This comprehensive report provides an in-depth analysis of the global 3D radar market, encompassing market dynamics, growth trends, regional insights, and key player profiles. The study period covers 2019-2033, with 2025 as the base year and a forecast period of 2025-2033. The report analyzes the parent market (defense and aerospace) and child markets (airborne, ground, and naval radar systems). The report is essential for industry professionals, investors, and stakeholders seeking a thorough understanding of this rapidly evolving sector.
3D Radar Industry Market Dynamics & Structure
The 3D radar market is characterized by moderate concentration, with key players such as SAAB Group, Honeywell International Inc, and Raytheon Company holding significant market share. However, the market is also witnessing increasing participation from smaller specialized firms driving innovation. Technological advancements, particularly in areas like AESA (Active Electronically Scanned Array) technology and software-defined radar, are primary growth drivers. Stringent regulatory frameworks related to defense and airspace safety significantly impact market operations. The industry faces competition from alternative surveillance technologies, such as LiDAR and optical sensors, while M&A activity remains relatively moderate, with approximately xx deals recorded in the last five years, leading to a consolidation rate of approximately xx%.
- Market Concentration: Moderately concentrated, with top 5 players holding approximately xx% market share (2025).
- Technological Innovation: AESA technology, software-defined radar, and improved signal processing capabilities are key drivers.
- Regulatory Framework: Stringent safety and security regulations influence market growth and adoption.
- Competitive Substitutes: LiDAR, optical sensors, and other surveillance technologies pose a competitive threat.
- M&A Activity: Approximately xx M&A deals recorded between 2019 and 2024, resulting in a xx% market consolidation.
- End-user Demographics: Primarily defense forces, air traffic control, and civilian maritime applications.
3D Radar Industry Growth Trends & Insights
The global 3D radar market is projected to experience substantial growth throughout the forecast period (2025-2033). Driven by increasing demand for enhanced situational awareness in defense applications, the market size is estimated at xx million units in 2025, expected to reach xx million units by 2033, exhibiting a CAGR of xx%. This growth is fueled by rising defense budgets globally, particularly in regions experiencing geopolitical instability. Technological disruptions, such as the transition to AESA technology, contribute to market expansion, enhancing performance, and reducing costs. However, factors such as budget constraints in some regions and competition from alternative technologies could slightly moderate growth. The market penetration rate of 3D radar in key applications (e.g., airborne surveillance) is expected to increase from xx% in 2025 to xx% by 2033.

Dominant Regions, Countries, or Segments in 3D Radar Industry
North America currently dominates the 3D radar market, owing to robust defense spending and technological advancements. Within platforms, the airborne segment holds the largest market share due to heightened demand for advanced air surveillance systems. The long-range radar segment also demonstrates strong growth potential, driven by the increasing need for extended detection ranges.
- Dominant Region: North America (xx% market share in 2025)
- Dominant Platform Segment: Airborne (xx% market share in 2025)
- Dominant Range Segment: Long Range (xx% market share in 2025)
- Key Drivers (North America): High defense expenditure, robust technological infrastructure, and government support for R&D.
- Key Drivers (Airborne): Enhanced air traffic management, increasing need for border security, and military modernization.
- Key Drivers (Long Range): Early warning systems, ballistic missile defense, and broader surveillance coverage needs.
3D Radar Industry Product Landscape
3D radar systems are evolving rapidly, integrating advanced signal processing techniques, AESA technology, and sophisticated software for enhanced target detection, tracking, and classification. Features like advanced clutter rejection, improved resolution, and wider field of view are becoming increasingly common. This leads to improved situational awareness, accurate target identification, and enhanced operational efficiency across various applications.
Key Drivers, Barriers & Challenges in 3D Radar Industry
Key Drivers: Increasing defense budgets, technological advancements in AESA and software-defined radar, rising demand for enhanced situational awareness, and the growing need for air and ground surveillance systems.
Challenges: High initial investment costs, complex integration processes, competition from alternative technologies, and potential supply chain disruptions due to geopolitical factors. The impact of these challenges is estimated to reduce the market growth rate by approximately xx% annually.
Emerging Opportunities in 3D Radar Industry
Emerging opportunities lie in the integration of 3D radar with AI and machine learning for improved data processing and autonomous systems. Furthermore, there's significant potential in expanding into the civilian market, particularly for applications like autonomous driving, weather forecasting, and drone detection. The untapped market in developing countries also presents a significant opportunity for growth.
Growth Accelerators in the 3D Radar Industry
Strategic partnerships between radar manufacturers and technology companies are crucial in accelerating innovation and market penetration. Technological breakthroughs like improved signal processing algorithms and miniaturization of radar components further enhance the growth trajectory. Market expansion strategies focusing on emerging economies and diverse applications will be key to unlocking long-term growth potential.
Key Players Shaping the 3D Radar Industry Market
- SAAB Group
- Honeywell International Inc
- Rheinmetall AG
- Aselsan AS
- Airbus Defense and Space
- Raytheon Company
- Leonardo SpA
- Thales Group
- Elta Systems Ltd (Israel Aerospace Industries)
- BAE Systems PLC
- Northrop Grumman Corporation
Notable Milestones in 3D Radar Industry Sector
- 2021: Raytheon introduces its next-generation AESA radar system.
- 2022: SAAB unveils a new 3D radar designed for naval applications.
- 2023: Honeywell acquires a smaller radar technology company, enhancing its product portfolio.
- 2024: Several significant contracts awarded for 3D radar systems for military modernization programs.
In-Depth 3D Radar Industry Market Outlook
The future of the 3D radar market is bright, driven by sustained technological innovation and a growing global demand for advanced surveillance capabilities. The continuous development of AESA, software-defined radar, and AI-powered systems will offer enhanced performance and broader applications. Strategic alliances and investments in R&D will remain crucial for players seeking to secure a strong market position. The market’s continued expansion into diverse civilian and defense sectors promises lucrative growth opportunities for stakeholders in the coming decade.
3D Radar Industry Segmentation
-
1. Platform
- 1.1. Airborne
- 1.2. Ground
- 1.3. Naval
-
2. Range Type
- 2.1. Long Range
- 2.2. Medium and Short Range
3D Radar Industry Segmentation By Geography
-
1. North America
- 1.1. United States
- 1.2. Canada
-
2. Europe
- 2.1. United Kingdom
- 2.2. Germany
- 2.3. France
- 2.4. Rest of Europe
-
3. Asia Pacific
- 3.1. China
- 3.2. Japan
- 3.3. India
- 3.4. Rest of Asia Pacific
-
4. Middle East and Africa
- 4.1. United Arab Emirates
- 4.2. Saudi Arabia
- 5. Rest of the World
3D Radar Industry REPORT HIGHLIGHTS
| Aspects | Details |
|---|---|
| Study Period | 2019-2033 |
| Base Year | 2024 |
| Estimated Year | 2025 |
| Forecast Period | 2025-2033 |
| Historical Period | 2019-2024 |
| Growth Rate | CAGR of 18.69% from 2019-2033 |
| Segmentation |
|
Table of Contents
- 1. Introduction
- 1.1. Research Scope
- 1.2. Market Segmentation
- 1.3. Research Methodology
- 1.4. Definitions and Assumptions
- 2. Executive Summary
- 2.1. Introduction
- 3. Market Dynamics
- 3.1. Introduction
- 3.2. Market Drivers
- 3.2.1. ; Rising Use of 3D Radar in Unmanned Aerial Vehicles
- 3.3. Market Restrains
- 3.3.1. ; High Initial Deployment Cost
- 3.4. Market Trends
- 3.4.1. Airborne 3D Radar is Expected to Witness Highest growth
- 4. Market Factor Analysis
- 4.1. Porters Five Forces
- 4.2. Supply/Value Chain
- 4.3. PESTEL analysis
- 4.4. Market Entropy
- 4.5. Patent/Trademark Analysis
- 5. Global 3D Radar Industry Analysis, Insights and Forecast, 2019-2031
- 5.1. Market Analysis, Insights and Forecast - by Platform
- 5.1.1. Airborne
- 5.1.2. Ground
- 5.1.3. Naval
- 5.2. Market Analysis, Insights and Forecast - by Range Type
- 5.2.1. Long Range
- 5.2.2. Medium and Short Range
- 5.3. Market Analysis, Insights and Forecast - by Region
- 5.3.1. North America
- 5.3.2. Europe
- 5.3.3. Asia Pacific
- 5.3.4. Middle East and Africa
- 5.3.5. Rest of the World
- 5.1. Market Analysis, Insights and Forecast - by Platform
- 6. North America 3D Radar Industry Analysis, Insights and Forecast, 2019-2031
- 6.1. Market Analysis, Insights and Forecast - by Platform
- 6.1.1. Airborne
- 6.1.2. Ground
- 6.1.3. Naval
- 6.2. Market Analysis, Insights and Forecast - by Range Type
- 6.2.1. Long Range
- 6.2.2. Medium and Short Range
- 6.1. Market Analysis, Insights and Forecast - by Platform
- 7. Europe 3D Radar Industry Analysis, Insights and Forecast, 2019-2031
- 7.1. Market Analysis, Insights and Forecast - by Platform
- 7.1.1. Airborne
- 7.1.2. Ground
- 7.1.3. Naval
- 7.2. Market Analysis, Insights and Forecast - by Range Type
- 7.2.1. Long Range
- 7.2.2. Medium and Short Range
- 7.1. Market Analysis, Insights and Forecast - by Platform
- 8. Asia Pacific 3D Radar Industry Analysis, Insights and Forecast, 2019-2031
- 8.1. Market Analysis, Insights and Forecast - by Platform
- 8.1.1. Airborne
- 8.1.2. Ground
- 8.1.3. Naval
- 8.2. Market Analysis, Insights and Forecast - by Range Type
- 8.2.1. Long Range
- 8.2.2. Medium and Short Range
- 8.1. Market Analysis, Insights and Forecast - by Platform
- 9. Middle East and Africa 3D Radar Industry Analysis, Insights and Forecast, 2019-2031
- 9.1. Market Analysis, Insights and Forecast - by Platform
- 9.1.1. Airborne
- 9.1.2. Ground
- 9.1.3. Naval
- 9.2. Market Analysis, Insights and Forecast - by Range Type
- 9.2.1. Long Range
- 9.2.2. Medium and Short Range
- 9.1. Market Analysis, Insights and Forecast - by Platform
- 10. Rest of the World 3D Radar Industry Analysis, Insights and Forecast, 2019-2031
- 10.1. Market Analysis, Insights and Forecast - by Platform
- 10.1.1. Airborne
- 10.1.2. Ground
- 10.1.3. Naval
- 10.2. Market Analysis, Insights and Forecast - by Range Type
- 10.2.1. Long Range
- 10.2.2. Medium and Short Range
- 10.1. Market Analysis, Insights and Forecast - by Platform
- 11. North America 3D Radar Industry Analysis, Insights and Forecast, 2019-2031
- 11.1. Market Analysis, Insights and Forecast - By Country/Sub-region
- 11.1.1 United States
- 11.1.2 Canada
- 12. Europe 3D Radar Industry Analysis, Insights and Forecast, 2019-2031
- 12.1. Market Analysis, Insights and Forecast - By Country/Sub-region
- 12.1.1 United Kingdom
- 12.1.2 Germany
- 12.1.3 France
- 12.1.4 Rest of Europe
- 13. Asia Pacific 3D Radar Industry Analysis, Insights and Forecast, 2019-2031
- 13.1. Market Analysis, Insights and Forecast - By Country/Sub-region
- 13.1.1 China
- 13.1.2 Japan
- 13.1.3 India
- 13.1.4 Rest of Asia Pacific
- 14. Middle East and Africa 3D Radar Industry Analysis, Insights and Forecast, 2019-2031
- 14.1. Market Analysis, Insights and Forecast - By Country/Sub-region
- 14.1.1 United Arab Emirates
- 14.1.2 Saudi Arabia
- 15. Rest of the World 3D Radar Industry Analysis, Insights and Forecast, 2019-2031
- 15.1. Market Analysis, Insights and Forecast - By Country/Sub-region
- 15.1.1.
- 16. Competitive Analysis
- 16.1. Global Market Share Analysis 2024
- 16.2. Company Profiles
- 16.2.1 SAAB Group
- 16.2.1.1. Overview
- 16.2.1.2. Products
- 16.2.1.3. SWOT Analysis
- 16.2.1.4. Recent Developments
- 16.2.1.5. Financials (Based on Availability)
- 16.2.2 Honeywell International Inc
- 16.2.2.1. Overview
- 16.2.2.2. Products
- 16.2.2.3. SWOT Analysis
- 16.2.2.4. Recent Developments
- 16.2.2.5. Financials (Based on Availability)
- 16.2.3 Rheinmetall AG
- 16.2.3.1. Overview
- 16.2.3.2. Products
- 16.2.3.3. SWOT Analysis
- 16.2.3.4. Recent Developments
- 16.2.3.5. Financials (Based on Availability)
- 16.2.4 Aselsan AS
- 16.2.4.1. Overview
- 16.2.4.2. Products
- 16.2.4.3. SWOT Analysis
- 16.2.4.4. Recent Developments
- 16.2.4.5. Financials (Based on Availability)
- 16.2.5 Airbus Defense and Space
- 16.2.5.1. Overview
- 16.2.5.2. Products
- 16.2.5.3. SWOT Analysis
- 16.2.5.4. Recent Developments
- 16.2.5.5. Financials (Based on Availability)
- 16.2.6 Raytheon Company
- 16.2.6.1. Overview
- 16.2.6.2. Products
- 16.2.6.3. SWOT Analysis
- 16.2.6.4. Recent Developments
- 16.2.6.5. Financials (Based on Availability)
- 16.2.7 Leonardo SpA*List Not Exhaustive
- 16.2.7.1. Overview
- 16.2.7.2. Products
- 16.2.7.3. SWOT Analysis
- 16.2.7.4. Recent Developments
- 16.2.7.5. Financials (Based on Availability)
- 16.2.8 Thales Group
- 16.2.8.1. Overview
- 16.2.8.2. Products
- 16.2.8.3. SWOT Analysis
- 16.2.8.4. Recent Developments
- 16.2.8.5. Financials (Based on Availability)
- 16.2.9 Elta Systems Ltd (Israel Aerospace Industries)
- 16.2.9.1. Overview
- 16.2.9.2. Products
- 16.2.9.3. SWOT Analysis
- 16.2.9.4. Recent Developments
- 16.2.9.5. Financials (Based on Availability)
- 16.2.10 BAE Systems PLC
- 16.2.10.1. Overview
- 16.2.10.2. Products
- 16.2.10.3. SWOT Analysis
- 16.2.10.4. Recent Developments
- 16.2.10.5. Financials (Based on Availability)
- 16.2.11 Northrop Grumman Corporation
- 16.2.11.1. Overview
- 16.2.11.2. Products
- 16.2.11.3. SWOT Analysis
- 16.2.11.4. Recent Developments
- 16.2.11.5. Financials (Based on Availability)
- 16.2.1 SAAB Group
List of Figures
- Figure 1: Global 3D Radar Industry Revenue Breakdown (Million, %) by Region 2024 & 2032
- Figure 2: North America 3D Radar Industry Revenue (Million), by Country 2024 & 2032
- Figure 3: North America 3D Radar Industry Revenue Share (%), by Country 2024 & 2032
- Figure 4: Europe 3D Radar Industry Revenue (Million), by Country 2024 & 2032
- Figure 5: Europe 3D Radar Industry Revenue Share (%), by Country 2024 & 2032
- Figure 6: Asia Pacific 3D Radar Industry Revenue (Million), by Country 2024 & 2032
- Figure 7: Asia Pacific 3D Radar Industry Revenue Share (%), by Country 2024 & 2032
- Figure 8: Middle East and Africa 3D Radar Industry Revenue (Million), by Country 2024 & 2032
- Figure 9: Middle East and Africa 3D Radar Industry Revenue Share (%), by Country 2024 & 2032
- Figure 10: Rest of the World 3D Radar Industry Revenue (Million), by Country 2024 & 2032
- Figure 11: Rest of the World 3D Radar Industry Revenue Share (%), by Country 2024 & 2032
- Figure 12: North America 3D Radar Industry Revenue (Million), by Platform 2024 & 2032
- Figure 13: North America 3D Radar Industry Revenue Share (%), by Platform 2024 & 2032
- Figure 14: North America 3D Radar Industry Revenue (Million), by Range Type 2024 & 2032
- Figure 15: North America 3D Radar Industry Revenue Share (%), by Range Type 2024 & 2032
- Figure 16: North America 3D Radar Industry Revenue (Million), by Country 2024 & 2032
- Figure 17: North America 3D Radar Industry Revenue Share (%), by Country 2024 & 2032
- Figure 18: Europe 3D Radar Industry Revenue (Million), by Platform 2024 & 2032
- Figure 19: Europe 3D Radar Industry Revenue Share (%), by Platform 2024 & 2032
- Figure 20: Europe 3D Radar Industry Revenue (Million), by Range Type 2024 & 2032
- Figure 21: Europe 3D Radar Industry Revenue Share (%), by Range Type 2024 & 2032
- Figure 22: Europe 3D Radar Industry Revenue (Million), by Country 2024 & 2032
- Figure 23: Europe 3D Radar Industry Revenue Share (%), by Country 2024 & 2032
- Figure 24: Asia Pacific 3D Radar Industry Revenue (Million), by Platform 2024 & 2032
- Figure 25: Asia Pacific 3D Radar Industry Revenue Share (%), by Platform 2024 & 2032
- Figure 26: Asia Pacific 3D Radar Industry Revenue (Million), by Range Type 2024 & 2032
- Figure 27: Asia Pacific 3D Radar Industry Revenue Share (%), by Range Type 2024 & 2032
- Figure 28: Asia Pacific 3D Radar Industry Revenue (Million), by Country 2024 & 2032
- Figure 29: Asia Pacific 3D Radar Industry Revenue Share (%), by Country 2024 & 2032
- Figure 30: Middle East and Africa 3D Radar Industry Revenue (Million), by Platform 2024 & 2032
- Figure 31: Middle East and Africa 3D Radar Industry Revenue Share (%), by Platform 2024 & 2032
- Figure 32: Middle East and Africa 3D Radar Industry Revenue (Million), by Range Type 2024 & 2032
- Figure 33: Middle East and Africa 3D Radar Industry Revenue Share (%), by Range Type 2024 & 2032
- Figure 34: Middle East and Africa 3D Radar Industry Revenue (Million), by Country 2024 & 2032
- Figure 35: Middle East and Africa 3D Radar Industry Revenue Share (%), by Country 2024 & 2032
- Figure 36: Rest of the World 3D Radar Industry Revenue (Million), by Platform 2024 & 2032
- Figure 37: Rest of the World 3D Radar Industry Revenue Share (%), by Platform 2024 & 2032
- Figure 38: Rest of the World 3D Radar Industry Revenue (Million), by Range Type 2024 & 2032
- Figure 39: Rest of the World 3D Radar Industry Revenue Share (%), by Range Type 2024 & 2032
- Figure 40: Rest of the World 3D Radar Industry Revenue (Million), by Country 2024 & 2032
- Figure 41: Rest of the World 3D Radar Industry Revenue Share (%), by Country 2024 & 2032
List of Tables
- Table 1: Global 3D Radar Industry Revenue Million Forecast, by Region 2019 & 2032
- Table 2: Global 3D Radar Industry Revenue Million Forecast, by Platform 2019 & 2032
- Table 3: Global 3D Radar Industry Revenue Million Forecast, by Range Type 2019 & 2032
- Table 4: Global 3D Radar Industry Revenue Million Forecast, by Region 2019 & 2032
- Table 5: Global 3D Radar Industry Revenue Million Forecast, by Country 2019 & 2032
- Table 6: United States 3D Radar Industry Revenue (Million) Forecast, by Application 2019 & 2032
- Table 7: Canada 3D Radar Industry Revenue (Million) Forecast, by Application 2019 & 2032
- Table 8: Global 3D Radar Industry Revenue Million Forecast, by Country 2019 & 2032
- Table 9: United Kingdom 3D Radar Industry Revenue (Million) Forecast, by Application 2019 & 2032
- Table 10: Germany 3D Radar Industry Revenue (Million) Forecast, by Application 2019 & 2032
- Table 11: France 3D Radar Industry Revenue (Million) Forecast, by Application 2019 & 2032
- Table 12: Rest of Europe 3D Radar Industry Revenue (Million) Forecast, by Application 2019 & 2032
- Table 13: Global 3D Radar Industry Revenue Million Forecast, by Country 2019 & 2032
- Table 14: China 3D Radar Industry Revenue (Million) Forecast, by Application 2019 & 2032
- Table 15: Japan 3D Radar Industry Revenue (Million) Forecast, by Application 2019 & 2032
- Table 16: India 3D Radar Industry Revenue (Million) Forecast, by Application 2019 & 2032
- Table 17: Rest of Asia Pacific 3D Radar Industry Revenue (Million) Forecast, by Application 2019 & 2032
- Table 18: Global 3D Radar Industry Revenue Million Forecast, by Country 2019 & 2032
- Table 19: United Arab Emirates 3D Radar Industry Revenue (Million) Forecast, by Application 2019 & 2032
- Table 20: Saudi Arabia 3D Radar Industry Revenue (Million) Forecast, by Application 2019 & 2032
- Table 21: Global 3D Radar Industry Revenue Million Forecast, by Country 2019 & 2032
- Table 22: 3D Radar Industry Revenue (Million) Forecast, by Application 2019 & 2032
- Table 23: Global 3D Radar Industry Revenue Million Forecast, by Platform 2019 & 2032
- Table 24: Global 3D Radar Industry Revenue Million Forecast, by Range Type 2019 & 2032
- Table 25: Global 3D Radar Industry Revenue Million Forecast, by Country 2019 & 2032
- Table 26: United States 3D Radar Industry Revenue (Million) Forecast, by Application 2019 & 2032
- Table 27: Canada 3D Radar Industry Revenue (Million) Forecast, by Application 2019 & 2032
- Table 28: Global 3D Radar Industry Revenue Million Forecast, by Platform 2019 & 2032
- Table 29: Global 3D Radar Industry Revenue Million Forecast, by Range Type 2019 & 2032
- Table 30: Global 3D Radar Industry Revenue Million Forecast, by Country 2019 & 2032
- Table 31: United Kingdom 3D Radar Industry Revenue (Million) Forecast, by Application 2019 & 2032
- Table 32: Germany 3D Radar Industry Revenue (Million) Forecast, by Application 2019 & 2032
- Table 33: France 3D Radar Industry Revenue (Million) Forecast, by Application 2019 & 2032
- Table 34: Rest of Europe 3D Radar Industry Revenue (Million) Forecast, by Application 2019 & 2032
- Table 35: Global 3D Radar Industry Revenue Million Forecast, by Platform 2019 & 2032
- Table 36: Global 3D Radar Industry Revenue Million Forecast, by Range Type 2019 & 2032
- Table 37: Global 3D Radar Industry Revenue Million Forecast, by Country 2019 & 2032
- Table 38: China 3D Radar Industry Revenue (Million) Forecast, by Application 2019 & 2032
- Table 39: Japan 3D Radar Industry Revenue (Million) Forecast, by Application 2019 & 2032
- Table 40: India 3D Radar Industry Revenue (Million) Forecast, by Application 2019 & 2032
- Table 41: Rest of Asia Pacific 3D Radar Industry Revenue (Million) Forecast, by Application 2019 & 2032
- Table 42: Global 3D Radar Industry Revenue Million Forecast, by Platform 2019 & 2032
- Table 43: Global 3D Radar Industry Revenue Million Forecast, by Range Type 2019 & 2032
- Table 44: Global 3D Radar Industry Revenue Million Forecast, by Country 2019 & 2032
- Table 45: United Arab Emirates 3D Radar Industry Revenue (Million) Forecast, by Application 2019 & 2032
- Table 46: Saudi Arabia 3D Radar Industry Revenue (Million) Forecast, by Application 2019 & 2032
- Table 47: Global 3D Radar Industry Revenue Million Forecast, by Platform 2019 & 2032
- Table 48: Global 3D Radar Industry Revenue Million Forecast, by Range Type 2019 & 2032
- Table 49: Global 3D Radar Industry Revenue Million Forecast, by Country 2019 & 2032
Frequently Asked Questions
1. What is the projected Compound Annual Growth Rate (CAGR) of the 3D Radar Industry?
The projected CAGR is approximately 18.69%.
2. Which companies are prominent players in the 3D Radar Industry?
Key companies in the market include SAAB Group, Honeywell International Inc, Rheinmetall AG, Aselsan AS, Airbus Defense and Space, Raytheon Company, Leonardo SpA*List Not Exhaustive, Thales Group, Elta Systems Ltd (Israel Aerospace Industries), BAE Systems PLC, Northrop Grumman Corporation.
3. What are the main segments of the 3D Radar Industry?
The market segments include Platform, Range Type.
4. Can you provide details about the market size?
The market size is estimated to be USD XX Million as of 2022.
5. What are some drivers contributing to market growth?
; Rising Use of 3D Radar in Unmanned Aerial Vehicles.
6. What are the notable trends driving market growth?
Airborne 3D Radar is Expected to Witness Highest growth.
7. Are there any restraints impacting market growth?
; High Initial Deployment Cost.
8. Can you provide examples of recent developments in the market?
N/A
9. What pricing options are available for accessing the report?
Pricing options include single-user, multi-user, and enterprise licenses priced at USD 4750, USD 5250, and USD 8750 respectively.
10. Is the market size provided in terms of value or volume?
The market size is provided in terms of value, measured in Million.
11. Are there any specific market keywords associated with the report?
Yes, the market keyword associated with the report is "3D Radar Industry," which aids in identifying and referencing the specific market segment covered.
12. How do I determine which pricing option suits my needs best?
The pricing options vary based on user requirements and access needs. Individual users may opt for single-user licenses, while businesses requiring broader access may choose multi-user or enterprise licenses for cost-effective access to the report.
13. Are there any additional resources or data provided in the 3D Radar Industry report?
While the report offers comprehensive insights, it's advisable to review the specific contents or supplementary materials provided to ascertain if additional resources or data are available.
14. How can I stay updated on further developments or reports in the 3D Radar Industry?
To stay informed about further developments, trends, and reports in the 3D Radar Industry, consider subscribing to industry newsletters, following relevant companies and organizations, or regularly checking reputable industry news sources and publications.
Methodology
Step 1 - Identification of Relevant Samples Size from Population Database


Step 2 - Approaches for Defining Global Market Size (Value, Volume* & Price*)

Note*: In applicable scenarios
Step 3 - Data Sources
Primary Research
- Web Analytics
- Survey Reports
- Research Institute
- Latest Research Reports
- Opinion Leaders
Secondary Research
- Annual Reports
- White Paper
- Latest Press Release
- Industry Association
- Paid Database
- Investor Presentations

Step 4 - Data Triangulation
Involves using different sources of information in order to increase the validity of a study
These sources are likely to be stakeholders in a program - participants, other researchers, program staff, other community members, and so on.
Then we put all data in single framework & apply various statistical tools to find out the dynamic on the market.
During the analysis stage, feedback from the stakeholder groups would be compared to determine areas of agreement as well as areas of divergence


