
Key Insights
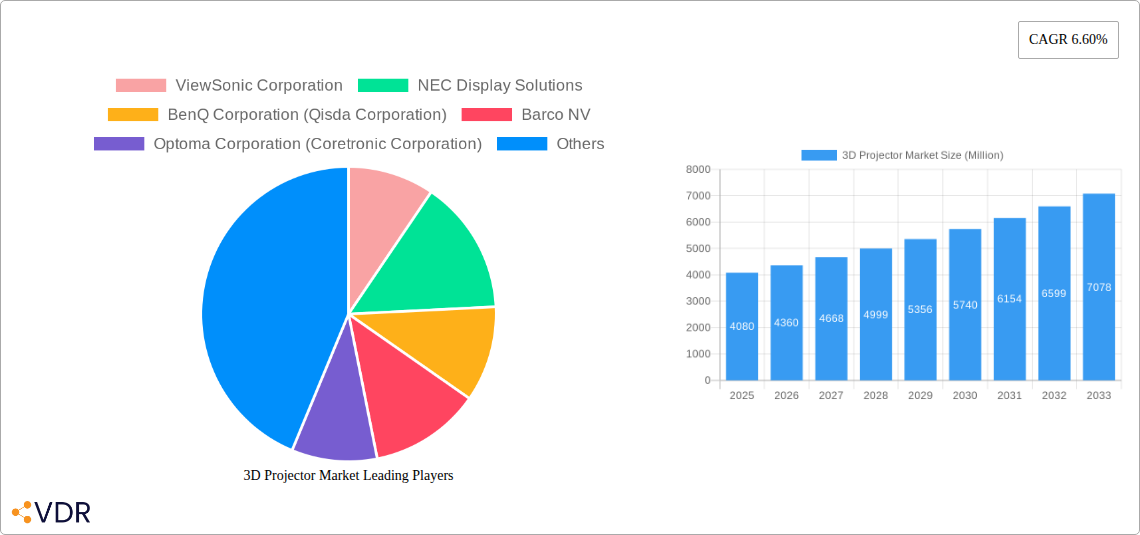
The 3D projector market, valued at $4.08 billion in 2025, is projected to experience robust growth, exhibiting a Compound Annual Growth Rate (CAGR) of 6.60% from 2025 to 2033. This expansion is fueled by several key drivers. The increasing adoption of 3D technology in entertainment, particularly home theaters and gaming, is a significant factor. Furthermore, the growing demand for immersive educational experiences in schools and universities is boosting the market. Advancements in projector technology, leading to improved image quality, resolution (including higher resolutions beyond Full HD), brighter displays, and more compact designs, also contribute to market growth. The market segmentation reveals a strong preference for Full HD 3D projectors, reflecting the balance between affordability and visual fidelity. The cinema sector remains a significant end-user segment, though the growth in home theater and gaming is rapidly closing the gap. While technological advancements drive growth, challenges remain. High initial investment costs for 3D projectors can be a barrier for some consumers, particularly in developing economies. Competition from alternative display technologies, such as high-quality 2D projectors and large-screen TVs, also presents a restraint on market expansion. However, ongoing innovation and the persistent appeal of immersive 3D experiences suggest sustained market growth throughout the forecast period. Geographic distribution shows a strong market presence in North America and Europe, with the Asia-Pacific region exhibiting significant growth potential due to rising disposable incomes and increasing demand for advanced home entertainment systems. Key players such as ViewSonic, NEC Display Solutions, and BenQ are strategically positioned to capitalize on these trends through continuous product innovation and expansion into emerging markets.
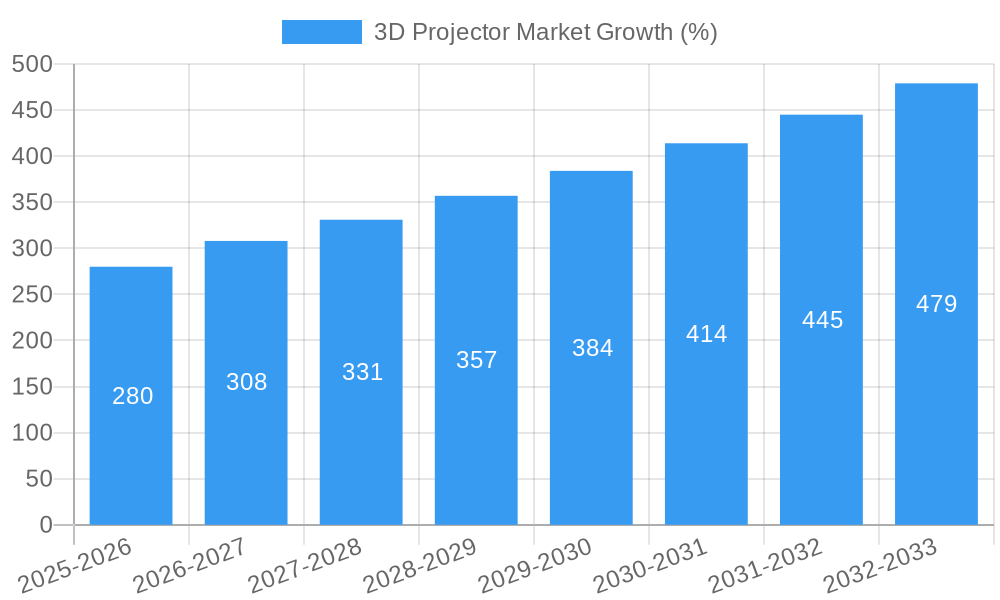
The projected growth trajectory indicates a steady increase in market size over the forecast period. Factors such as technological improvements, wider adoption in diverse sectors, and strategic marketing efforts by leading companies will further fuel market expansion. While challenges related to cost and competition persist, the overall outlook for the 3D projector market remains positive, promising substantial market expansion by 2033. The market’s evolution will likely be characterized by increased focus on higher resolutions, improved brightness and contrast ratios, and a wider array of features targeting diverse user segments across various regions.
3D Projector Market: A Comprehensive Report (2019-2033)
This in-depth report provides a comprehensive analysis of the global 3D projector market, encompassing market dynamics, growth trends, regional dominance, product landscape, key players, and future outlook. The study period spans from 2019 to 2033, with 2025 serving as the base and estimated year. The report utilizes both quantitative and qualitative data to offer a holistic understanding of this dynamic market segment. It delves into the parent market of projector technology and the child market segments within 3D projection to provide a granular analysis. Projected market size for 2025 is estimated at xx Million units.
3D Projector Market Dynamics & Structure
The 3D projector market is characterized by moderate concentration, with several key players holding significant market share. Technological innovation, particularly in areas like resolution, brightness, and laser technology, is a major driver. Regulatory frameworks concerning energy efficiency and safety standards also play a role. Competitive substitutes include high-resolution 2D projectors and large-screen TVs. End-user demographics are diverse, spanning cinema, education, home theatre, and gaming sectors. M&A activity has been relatively moderate in recent years, with a focus on strategic acquisitions to enhance product portfolios and expand market reach.
- Market Concentration: Moderately concentrated, with top 5 players holding approximately xx% market share in 2025.
- Technological Innovation: Key drivers include advancements in laser technology, increased resolution (4K and beyond), and improved brightness.
- Regulatory Framework: Compliance with energy efficiency standards and safety regulations influences product development and market access.
- Competitive Substitutes: High-resolution 2D projectors and large-screen TVs pose a competitive challenge.
- End-User Demographics: Cinema, education, home theatre, and gaming segments represent significant end-user groups.
- M&A Trends: Relatively low M&A activity in recent years, focused on strategic acquisitions and expansion into new markets. Estimated xx M&A deals in the period 2019-2024.
3D Projector Market Growth Trends & Insights
The 3D projector market witnessed considerable growth during the historical period (2019-2024). Adoption rates, however, have plateaued somewhat in recent years due to several factors, including the rise of streaming services and high-quality 2D display technologies. However, advancements in laser technology, offering superior brightness and color accuracy, are expected to reinvigorate growth during the forecast period (2025-2033). Consumer behavior is shifting towards larger screen sizes and immersive viewing experiences, presenting both opportunities and challenges for 3D projector manufacturers. Technological disruptions such as the introduction of 8K resolution and improved HDR support are driving premiumization of the market. The projected Compound Annual Growth Rate (CAGR) for the 3D projector market during 2025-2033 is estimated at xx%, leading to an estimated market size of xx Million units by 2033.
Dominant Regions, Countries, or Segments in 3D Projector Market
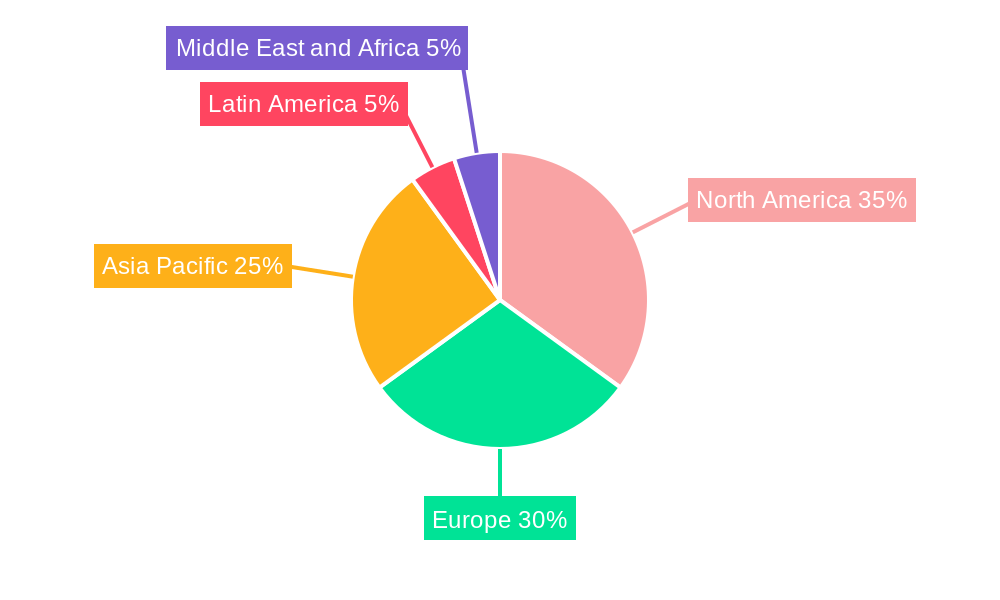
North America currently holds the largest market share in the 3D projector market, driven by strong demand from the cinema and home theatre segments. However, Asia-Pacific is projected to experience the fastest growth rate during the forecast period, fueled by increasing disposable incomes and rising adoption of advanced home entertainment systems. Within the product segments, Full HD 3D projectors continue to hold a larger market share compared to PC 3D Ready projectors, but the latter is expected to experience faster growth due to its affordability and compatibility with a wider range of devices. The cinema end-user segment remains the largest revenue contributor, while the home theatre and gaming segments are demonstrating strong growth potential.
- Key Drivers in North America: High disposable incomes, strong adoption of home theatre systems, and a large cinema industry.
- Key Drivers in Asia-Pacific: Rapid economic growth, increasing urbanization, and rising demand for advanced home entertainment solutions.
- Segment Dominance: Full HD 3D projectors currently hold the largest market share, but PC 3D Ready projectors are projected to experience faster growth.
- End-User Segment Dominance: The cinema segment currently dominates, with home theatre and gaming segments displaying significant growth potential.
3D Projector Market Product Landscape
The 3D projector market offers a range of products with varying features and specifications, including Full HD and 4K resolution, diverse brightness levels, different lamp types (LED, laser), and various throw ratios. Recent innovations focus on improved color accuracy, higher brightness, shorter throw ratios for compact setups, and enhanced 3D technologies like improved glasses-free viewing experiences and auto-calibration features. Unique selling propositions include superior image quality, ease of use, and advanced connectivity options. The increasing adoption of laser technology is a significant trend, enabling superior brightness, color, and longevity.
Key Drivers, Barriers & Challenges in 3D Projector Market
Key Drivers:
- Technological advancements in resolution, brightness, and laser technology.
- Growing demand for immersive home entertainment experiences.
- Increasing adoption of 3D technology in education and commercial settings.
Key Challenges:
- Competition from high-quality 2D display technologies.
- The perceived cost and complexity of 3D technology.
- Potential supply chain disruptions and rising component costs.
Emerging Opportunities in 3D Projector Market
- Expanding into untapped markets in developing economies.
- Development of glasses-free 3D projection technology.
- Increased focus on integrating 3D projection with VR/AR technologies.
- Development of compact, portable 3D projectors for diverse applications.
Growth Accelerators in the 3D Projector Market Industry
Technological advancements, particularly in laser projection technology, are key growth catalysts. Strategic partnerships between projector manufacturers and content providers are expected to drive market expansion. Furthermore, market expansion strategies, including focusing on emerging markets and developing innovative applications in education and commercial sectors, can significantly accelerate market growth.
Key Players Shaping the 3D Projector Market Market
- ViewSonic Corporation
- NEC Display Solutions
- BenQ Corporation (Qisda Corporation)
- Barco NV
- Optoma Corporation (Coretronic Corporation)
- Seiko Epson Corporation
- InFocus Corporation
- Christie Digital (Ushio Inc)
- Vivitek Corporation
- Panasonic Corporation
- Sony Corporation
Notable Milestones in 3D Projector Market Sector
- November 2023: Cinépolis launched a new multiplex with Immersive RealD 3D experience in Hyderabad, India, showcasing the continued relevance of 3D in cinema.
- June 2023: SPRODE INDIA launched its TRUE 4K 3D laser TV UST projector, highlighting innovation in the home theatre segment.
In-Depth 3D Projector Market Market Outlook
The 3D projector market is poised for continued growth, driven by technological advancements and evolving consumer preferences. Strategic partnerships, expansion into new markets, and the development of innovative applications are key factors that will shape future market dynamics. The focus on improved image quality, ease of use, and affordability will be crucial in attracting a broader consumer base and sustaining long-term growth. The market presents significant opportunities for companies that can successfully innovate and adapt to changing market trends.
3D Projector Market Segmentation
-
1. Types
- 1.1. Full HD 3D
- 1.2. PC 3D Ready
-
2. End User
- 2.1. Cinema
- 2.2. Education
- 2.3. Home Theatre and Gaming
- 2.4. Other End Users
3D Projector Market Segmentation By Geography
-
1. North America
- 1.1. United States
- 1.2. Canada
-
2. Europe
- 2.1. United Kingdom
- 2.2. Germany
- 2.3. France
- 2.4. Italy
- 2.5. Rest of Europe
-
3. Asia Pacific
- 3.1. China
- 3.2. Japan
- 3.3. India
- 3.4. South Korea
- 3.5. Rest of Asia Pacific
- 4. Latin America
- 5. Middle East and Africa
3D Projector Market REPORT HIGHLIGHTS
| Aspects | Details |
|---|---|
| Study Period | 2019-2033 |
| Base Year | 2024 |
| Estimated Year | 2025 |
| Forecast Period | 2025-2033 |
| Historical Period | 2019-2024 |
| Growth Rate | CAGR of 6.60% from 2019-2033 |
| Segmentation |
|
Table of Contents
- 1. Introduction
- 1.1. Research Scope
- 1.2. Market Segmentation
- 1.3. Research Methodology
- 1.4. Definitions and Assumptions
- 2. Executive Summary
- 2.1. Introduction
- 3. Market Dynamics
- 3.1. Introduction
- 3.2. Market Drivers
- 3.2.1. Rise in the Importance of Laser-based 3D Projectors; Adoption of Digitalization in the Education Sector
- 3.3. Market Restrains
- 3.3.1. LED Screens as Substitutes to Projectors
- 3.4. Market Trends
- 3.4.1. Home Theatre and Gaming is Expected to Hold Significant Market Share
- 4. Market Factor Analysis
- 4.1. Porters Five Forces
- 4.2. Supply/Value Chain
- 4.3. PESTEL analysis
- 4.4. Market Entropy
- 4.5. Patent/Trademark Analysis
- 5. Global 3D Projector Market Analysis, Insights and Forecast, 2019-2031
- 5.1. Market Analysis, Insights and Forecast - by Types
- 5.1.1. Full HD 3D
- 5.1.2. PC 3D Ready
- 5.2. Market Analysis, Insights and Forecast - by End User
- 5.2.1. Cinema
- 5.2.2. Education
- 5.2.3. Home Theatre and Gaming
- 5.2.4. Other End Users
- 5.3. Market Analysis, Insights and Forecast - by Region
- 5.3.1. North America
- 5.3.2. Europe
- 5.3.3. Asia Pacific
- 5.3.4. Latin America
- 5.3.5. Middle East and Africa
- 5.1. Market Analysis, Insights and Forecast - by Types
- 6. North America 3D Projector Market Analysis, Insights and Forecast, 2019-2031
- 6.1. Market Analysis, Insights and Forecast - by Types
- 6.1.1. Full HD 3D
- 6.1.2. PC 3D Ready
- 6.2. Market Analysis, Insights and Forecast - by End User
- 6.2.1. Cinema
- 6.2.2. Education
- 6.2.3. Home Theatre and Gaming
- 6.2.4. Other End Users
- 6.1. Market Analysis, Insights and Forecast - by Types
- 7. Europe 3D Projector Market Analysis, Insights and Forecast, 2019-2031
- 7.1. Market Analysis, Insights and Forecast - by Types
- 7.1.1. Full HD 3D
- 7.1.2. PC 3D Ready
- 7.2. Market Analysis, Insights and Forecast - by End User
- 7.2.1. Cinema
- 7.2.2. Education
- 7.2.3. Home Theatre and Gaming
- 7.2.4. Other End Users
- 7.1. Market Analysis, Insights and Forecast - by Types
- 8. Asia Pacific 3D Projector Market Analysis, Insights and Forecast, 2019-2031
- 8.1. Market Analysis, Insights and Forecast - by Types
- 8.1.1. Full HD 3D
- 8.1.2. PC 3D Ready
- 8.2. Market Analysis, Insights and Forecast - by End User
- 8.2.1. Cinema
- 8.2.2. Education
- 8.2.3. Home Theatre and Gaming
- 8.2.4. Other End Users
- 8.1. Market Analysis, Insights and Forecast - by Types
- 9. Latin America 3D Projector Market Analysis, Insights and Forecast, 2019-2031
- 9.1. Market Analysis, Insights and Forecast - by Types
- 9.1.1. Full HD 3D
- 9.1.2. PC 3D Ready
- 9.2. Market Analysis, Insights and Forecast - by End User
- 9.2.1. Cinema
- 9.2.2. Education
- 9.2.3. Home Theatre and Gaming
- 9.2.4. Other End Users
- 9.1. Market Analysis, Insights and Forecast - by Types
- 10. Middle East and Africa 3D Projector Market Analysis, Insights and Forecast, 2019-2031
- 10.1. Market Analysis, Insights and Forecast - by Types
- 10.1.1. Full HD 3D
- 10.1.2. PC 3D Ready
- 10.2. Market Analysis, Insights and Forecast - by End User
- 10.2.1. Cinema
- 10.2.2. Education
- 10.2.3. Home Theatre and Gaming
- 10.2.4. Other End Users
- 10.1. Market Analysis, Insights and Forecast - by Types
- 11. North America 3D Projector Market Analysis, Insights and Forecast, 2019-2031
- 11.1. Market Analysis, Insights and Forecast - By Country/Sub-region
- 11.1.1 United States
- 11.1.2 Canada
- 12. Europe 3D Projector Market Analysis, Insights and Forecast, 2019-2031
- 12.1. Market Analysis, Insights and Forecast - By Country/Sub-region
- 12.1.1 United Kingdom
- 12.1.2 Germany
- 12.1.3 France
- 12.1.4 Italy
- 12.1.5 Rest of Europe
- 13. Asia Pacific 3D Projector Market Analysis, Insights and Forecast, 2019-2031
- 13.1. Market Analysis, Insights and Forecast - By Country/Sub-region
- 13.1.1 China
- 13.1.2 Japan
- 13.1.3 India
- 13.1.4 South Korea
- 13.1.5 Rest of Asia Pacific
- 14. Latin America 3D Projector Market Analysis, Insights and Forecast, 2019-2031
- 14.1. Market Analysis, Insights and Forecast - By Country/Sub-region
- 14.1.1.
- 15. Middle East and Africa 3D Projector Market Analysis, Insights and Forecast, 2019-2031
- 15.1. Market Analysis, Insights and Forecast - By Country/Sub-region
- 15.1.1.
- 16. Competitive Analysis
- 16.1. Global Market Share Analysis 2024
- 16.2. Company Profiles
- 16.2.1 ViewSonic Corporation
- 16.2.1.1. Overview
- 16.2.1.2. Products
- 16.2.1.3. SWOT Analysis
- 16.2.1.4. Recent Developments
- 16.2.1.5. Financials (Based on Availability)
- 16.2.2 NEC Display Solutions
- 16.2.2.1. Overview
- 16.2.2.2. Products
- 16.2.2.3. SWOT Analysis
- 16.2.2.4. Recent Developments
- 16.2.2.5. Financials (Based on Availability)
- 16.2.3 BenQ Corporation (Qisda Corporation)
- 16.2.3.1. Overview
- 16.2.3.2. Products
- 16.2.3.3. SWOT Analysis
- 16.2.3.4. Recent Developments
- 16.2.3.5. Financials (Based on Availability)
- 16.2.4 Barco NV
- 16.2.4.1. Overview
- 16.2.4.2. Products
- 16.2.4.3. SWOT Analysis
- 16.2.4.4. Recent Developments
- 16.2.4.5. Financials (Based on Availability)
- 16.2.5 Optoma Corporation (Coretronic Corporation)
- 16.2.5.1. Overview
- 16.2.5.2. Products
- 16.2.5.3. SWOT Analysis
- 16.2.5.4. Recent Developments
- 16.2.5.5. Financials (Based on Availability)
- 16.2.6 Seiko Epson Corporation
- 16.2.6.1. Overview
- 16.2.6.2. Products
- 16.2.6.3. SWOT Analysis
- 16.2.6.4. Recent Developments
- 16.2.6.5. Financials (Based on Availability)
- 16.2.7 InFocus Corporation*List Not Exhaustive
- 16.2.7.1. Overview
- 16.2.7.2. Products
- 16.2.7.3. SWOT Analysis
- 16.2.7.4. Recent Developments
- 16.2.7.5. Financials (Based on Availability)
- 16.2.8 Christie Digital (Ushio Inc )
- 16.2.8.1. Overview
- 16.2.8.2. Products
- 16.2.8.3. SWOT Analysis
- 16.2.8.4. Recent Developments
- 16.2.8.5. Financials (Based on Availability)
- 16.2.9 Vivitek Corporation
- 16.2.9.1. Overview
- 16.2.9.2. Products
- 16.2.9.3. SWOT Analysis
- 16.2.9.4. Recent Developments
- 16.2.9.5. Financials (Based on Availability)
- 16.2.10 Panasonic Corporation
- 16.2.10.1. Overview
- 16.2.10.2. Products
- 16.2.10.3. SWOT Analysis
- 16.2.10.4. Recent Developments
- 16.2.10.5. Financials (Based on Availability)
- 16.2.11 Sony Corporation
- 16.2.11.1. Overview
- 16.2.11.2. Products
- 16.2.11.3. SWOT Analysis
- 16.2.11.4. Recent Developments
- 16.2.11.5. Financials (Based on Availability)
- 16.2.1 ViewSonic Corporation
List of Figures
- Figure 1: Global 3D Projector Market Revenue Breakdown (Million, %) by Region 2024 & 2032
- Figure 2: North America 3D Projector Market Revenue (Million), by Country 2024 & 2032
- Figure 3: North America 3D Projector Market Revenue Share (%), by Country 2024 & 2032
- Figure 4: Europe 3D Projector Market Revenue (Million), by Country 2024 & 2032
- Figure 5: Europe 3D Projector Market Revenue Share (%), by Country 2024 & 2032
- Figure 6: Asia Pacific 3D Projector Market Revenue (Million), by Country 2024 & 2032
- Figure 7: Asia Pacific 3D Projector Market Revenue Share (%), by Country 2024 & 2032
- Figure 8: Latin America 3D Projector Market Revenue (Million), by Country 2024 & 2032
- Figure 9: Latin America 3D Projector Market Revenue Share (%), by Country 2024 & 2032
- Figure 10: Middle East and Africa 3D Projector Market Revenue (Million), by Country 2024 & 2032
- Figure 11: Middle East and Africa 3D Projector Market Revenue Share (%), by Country 2024 & 2032
- Figure 12: North America 3D Projector Market Revenue (Million), by Types 2024 & 2032
- Figure 13: North America 3D Projector Market Revenue Share (%), by Types 2024 & 2032
- Figure 14: North America 3D Projector Market Revenue (Million), by End User 2024 & 2032
- Figure 15: North America 3D Projector Market Revenue Share (%), by End User 2024 & 2032
- Figure 16: North America 3D Projector Market Revenue (Million), by Country 2024 & 2032
- Figure 17: North America 3D Projector Market Revenue Share (%), by Country 2024 & 2032
- Figure 18: Europe 3D Projector Market Revenue (Million), by Types 2024 & 2032
- Figure 19: Europe 3D Projector Market Revenue Share (%), by Types 2024 & 2032
- Figure 20: Europe 3D Projector Market Revenue (Million), by End User 2024 & 2032
- Figure 21: Europe 3D Projector Market Revenue Share (%), by End User 2024 & 2032
- Figure 22: Europe 3D Projector Market Revenue (Million), by Country 2024 & 2032
- Figure 23: Europe 3D Projector Market Revenue Share (%), by Country 2024 & 2032
- Figure 24: Asia Pacific 3D Projector Market Revenue (Million), by Types 2024 & 2032
- Figure 25: Asia Pacific 3D Projector Market Revenue Share (%), by Types 2024 & 2032
- Figure 26: Asia Pacific 3D Projector Market Revenue (Million), by End User 2024 & 2032
- Figure 27: Asia Pacific 3D Projector Market Revenue Share (%), by End User 2024 & 2032
- Figure 28: Asia Pacific 3D Projector Market Revenue (Million), by Country 2024 & 2032
- Figure 29: Asia Pacific 3D Projector Market Revenue Share (%), by Country 2024 & 2032
- Figure 30: Latin America 3D Projector Market Revenue (Million), by Types 2024 & 2032
- Figure 31: Latin America 3D Projector Market Revenue Share (%), by Types 2024 & 2032
- Figure 32: Latin America 3D Projector Market Revenue (Million), by End User 2024 & 2032
- Figure 33: Latin America 3D Projector Market Revenue Share (%), by End User 2024 & 2032
- Figure 34: Latin America 3D Projector Market Revenue (Million), by Country 2024 & 2032
- Figure 35: Latin America 3D Projector Market Revenue Share (%), by Country 2024 & 2032
- Figure 36: Middle East and Africa 3D Projector Market Revenue (Million), by Types 2024 & 2032
- Figure 37: Middle East and Africa 3D Projector Market Revenue Share (%), by Types 2024 & 2032
- Figure 38: Middle East and Africa 3D Projector Market Revenue (Million), by End User 2024 & 2032
- Figure 39: Middle East and Africa 3D Projector Market Revenue Share (%), by End User 2024 & 2032
- Figure 40: Middle East and Africa 3D Projector Market Revenue (Million), by Country 2024 & 2032
- Figure 41: Middle East and Africa 3D Projector Market Revenue Share (%), by Country 2024 & 2032
List of Tables
- Table 1: Global 3D Projector Market Revenue Million Forecast, by Region 2019 & 2032
- Table 2: Global 3D Projector Market Revenue Million Forecast, by Types 2019 & 2032
- Table 3: Global 3D Projector Market Revenue Million Forecast, by End User 2019 & 2032
- Table 4: Global 3D Projector Market Revenue Million Forecast, by Region 2019 & 2032
- Table 5: Global 3D Projector Market Revenue Million Forecast, by Country 2019 & 2032
- Table 6: United States 3D Projector Market Revenue (Million) Forecast, by Application 2019 & 2032
- Table 7: Canada 3D Projector Market Revenue (Million) Forecast, by Application 2019 & 2032
- Table 8: Global 3D Projector Market Revenue Million Forecast, by Country 2019 & 2032
- Table 9: United Kingdom 3D Projector Market Revenue (Million) Forecast, by Application 2019 & 2032
- Table 10: Germany 3D Projector Market Revenue (Million) Forecast, by Application 2019 & 2032
- Table 11: France 3D Projector Market Revenue (Million) Forecast, by Application 2019 & 2032
- Table 12: Italy 3D Projector Market Revenue (Million) Forecast, by Application 2019 & 2032
- Table 13: Rest of Europe 3D Projector Market Revenue (Million) Forecast, by Application 2019 & 2032
- Table 14: Global 3D Projector Market Revenue Million Forecast, by Country 2019 & 2032
- Table 15: China 3D Projector Market Revenue (Million) Forecast, by Application 2019 & 2032
- Table 16: Japan 3D Projector Market Revenue (Million) Forecast, by Application 2019 & 2032
- Table 17: India 3D Projector Market Revenue (Million) Forecast, by Application 2019 & 2032
- Table 18: South Korea 3D Projector Market Revenue (Million) Forecast, by Application 2019 & 2032
- Table 19: Rest of Asia Pacific 3D Projector Market Revenue (Million) Forecast, by Application 2019 & 2032
- Table 20: Global 3D Projector Market Revenue Million Forecast, by Country 2019 & 2032
- Table 21: 3D Projector Market Revenue (Million) Forecast, by Application 2019 & 2032
- Table 22: Global 3D Projector Market Revenue Million Forecast, by Country 2019 & 2032
- Table 23: 3D Projector Market Revenue (Million) Forecast, by Application 2019 & 2032
- Table 24: Global 3D Projector Market Revenue Million Forecast, by Types 2019 & 2032
- Table 25: Global 3D Projector Market Revenue Million Forecast, by End User 2019 & 2032
- Table 26: Global 3D Projector Market Revenue Million Forecast, by Country 2019 & 2032
- Table 27: United States 3D Projector Market Revenue (Million) Forecast, by Application 2019 & 2032
- Table 28: Canada 3D Projector Market Revenue (Million) Forecast, by Application 2019 & 2032
- Table 29: Global 3D Projector Market Revenue Million Forecast, by Types 2019 & 2032
- Table 30: Global 3D Projector Market Revenue Million Forecast, by End User 2019 & 2032
- Table 31: Global 3D Projector Market Revenue Million Forecast, by Country 2019 & 2032
- Table 32: United Kingdom 3D Projector Market Revenue (Million) Forecast, by Application 2019 & 2032
- Table 33: Germany 3D Projector Market Revenue (Million) Forecast, by Application 2019 & 2032
- Table 34: France 3D Projector Market Revenue (Million) Forecast, by Application 2019 & 2032
- Table 35: Italy 3D Projector Market Revenue (Million) Forecast, by Application 2019 & 2032
- Table 36: Rest of Europe 3D Projector Market Revenue (Million) Forecast, by Application 2019 & 2032
- Table 37: Global 3D Projector Market Revenue Million Forecast, by Types 2019 & 2032
- Table 38: Global 3D Projector Market Revenue Million Forecast, by End User 2019 & 2032
- Table 39: Global 3D Projector Market Revenue Million Forecast, by Country 2019 & 2032
- Table 40: China 3D Projector Market Revenue (Million) Forecast, by Application 2019 & 2032
- Table 41: Japan 3D Projector Market Revenue (Million) Forecast, by Application 2019 & 2032
- Table 42: India 3D Projector Market Revenue (Million) Forecast, by Application 2019 & 2032
- Table 43: South Korea 3D Projector Market Revenue (Million) Forecast, by Application 2019 & 2032
- Table 44: Rest of Asia Pacific 3D Projector Market Revenue (Million) Forecast, by Application 2019 & 2032
- Table 45: Global 3D Projector Market Revenue Million Forecast, by Types 2019 & 2032
- Table 46: Global 3D Projector Market Revenue Million Forecast, by End User 2019 & 2032
- Table 47: Global 3D Projector Market Revenue Million Forecast, by Country 2019 & 2032
- Table 48: Global 3D Projector Market Revenue Million Forecast, by Types 2019 & 2032
- Table 49: Global 3D Projector Market Revenue Million Forecast, by End User 2019 & 2032
- Table 50: Global 3D Projector Market Revenue Million Forecast, by Country 2019 & 2032
Frequently Asked Questions
1. What is the projected Compound Annual Growth Rate (CAGR) of the 3D Projector Market?
The projected CAGR is approximately 6.60%.
2. Which companies are prominent players in the 3D Projector Market?
Key companies in the market include ViewSonic Corporation, NEC Display Solutions, BenQ Corporation (Qisda Corporation), Barco NV, Optoma Corporation (Coretronic Corporation), Seiko Epson Corporation, InFocus Corporation*List Not Exhaustive, Christie Digital (Ushio Inc ), Vivitek Corporation, Panasonic Corporation, Sony Corporation.
3. What are the main segments of the 3D Projector Market?
The market segments include Types, End User.
4. Can you provide details about the market size?
The market size is estimated to be USD 4.08 Million as of 2022.
5. What are some drivers contributing to market growth?
Rise in the Importance of Laser-based 3D Projectors; Adoption of Digitalization in the Education Sector.
6. What are the notable trends driving market growth?
Home Theatre and Gaming is Expected to Hold Significant Market Share.
7. Are there any restraints impacting market growth?
LED Screens as Substitutes to Projectors.
8. Can you provide examples of recent developments in the market?
November 2023 - Cinépolis launched an all-new Multiplex facility at the LULU Mall in Hyderabad to provide the unmatched charm of the traditional Cinépolis cinema-watching experience. With the most recliners in the catchment offering the patrons spacious legroom, this facility offers an Immersive RealD 3D experience, taking the movie-watching experience to an all-new level.
9. What pricing options are available for accessing the report?
Pricing options include single-user, multi-user, and enterprise licenses priced at USD 4750, USD 5250, and USD 8750 respectively.
10. Is the market size provided in terms of value or volume?
The market size is provided in terms of value, measured in Million.
11. Are there any specific market keywords associated with the report?
Yes, the market keyword associated with the report is "3D Projector Market," which aids in identifying and referencing the specific market segment covered.
12. How do I determine which pricing option suits my needs best?
The pricing options vary based on user requirements and access needs. Individual users may opt for single-user licenses, while businesses requiring broader access may choose multi-user or enterprise licenses for cost-effective access to the report.
13. Are there any additional resources or data provided in the 3D Projector Market report?
While the report offers comprehensive insights, it's advisable to review the specific contents or supplementary materials provided to ascertain if additional resources or data are available.
14. How can I stay updated on further developments or reports in the 3D Projector Market?
To stay informed about further developments, trends, and reports in the 3D Projector Market, consider subscribing to industry newsletters, following relevant companies and organizations, or regularly checking reputable industry news sources and publications.
Methodology
Step 1 - Identification of Relevant Samples Size from Population Database


Step 2 - Approaches for Defining Global Market Size (Value, Volume* & Price*)

Note*: In applicable scenarios
Step 3 - Data Sources
Primary Research
- Web Analytics
- Survey Reports
- Research Institute
- Latest Research Reports
- Opinion Leaders
Secondary Research
- Annual Reports
- White Paper
- Latest Press Release
- Industry Association
- Paid Database
- Investor Presentations

Step 4 - Data Triangulation
Involves using different sources of information in order to increase the validity of a study
These sources are likely to be stakeholders in a program - participants, other researchers, program staff, other community members, and so on.
Then we put all data in single framework & apply various statistical tools to find out the dynamic on the market.
During the analysis stage, feedback from the stakeholder groups would be compared to determine areas of agreement as well as areas of divergence


