
Key Insights
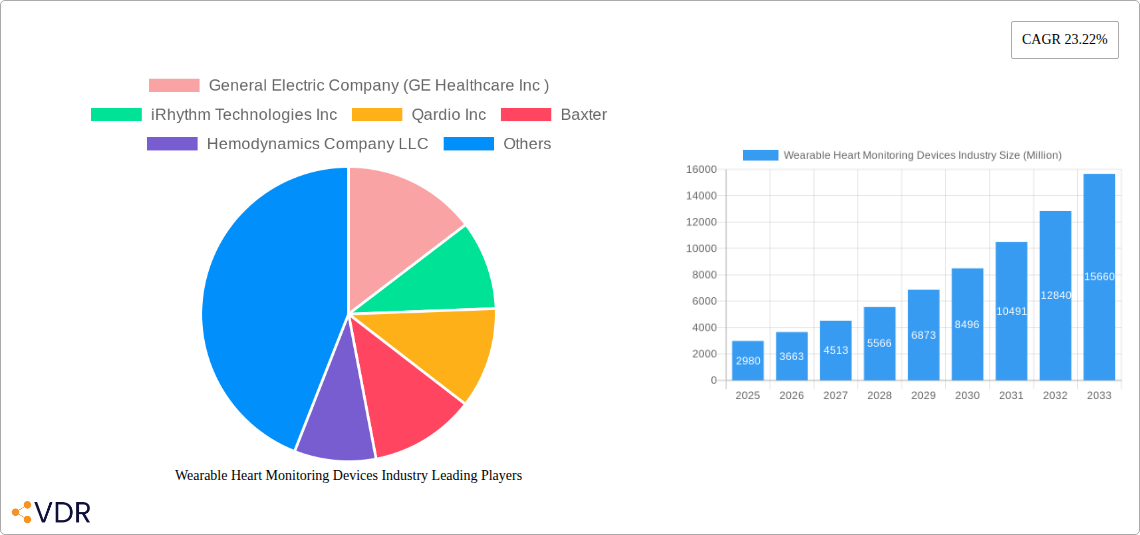
The Wearable Heart Monitoring Devices market is experiencing robust growth, projected to reach \$2.98 billion in 2025 and expanding at a Compound Annual Growth Rate (CAGR) of 23.22% from 2025 to 2033. This surge is driven by several key factors. The rising prevalence of cardiovascular diseases globally fuels demand for convenient and continuous heart monitoring solutions. Technological advancements, particularly in miniaturization, improved sensor accuracy, and wireless connectivity, are enabling more sophisticated and user-friendly devices. The increasing adoption of remote patient monitoring (RPM) programs, facilitated by telehealth initiatives and a focus on cost-effective healthcare solutions, further accelerates market expansion. Growth is also propelled by the increasing awareness of heart health among individuals, leading to proactive monitoring, especially within the sports and fitness sectors, and the expanding home healthcare market requiring convenient and accessible monitoring options. The market segmentation reveals strong growth across various product types (electric pulse-based and optical technology-based), device types (diagnostic & monitoring and therapeutic), and applications (sports & fitness, remote patient monitoring, and home healthcare). Competition is fierce, with established players like GE Healthcare, Medtronic, and Philips alongside innovative companies like iRhythm Technologies and Vital Connect vying for market share through product differentiation and strategic partnerships.
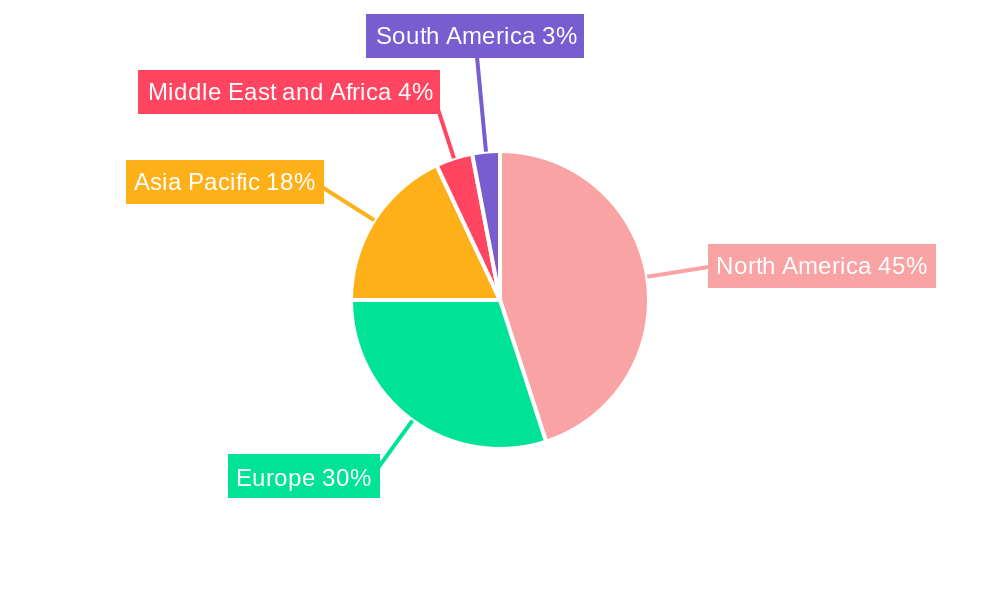
The market's geographic distribution indicates significant growth opportunities across various regions. While North America currently holds a substantial market share due to advanced healthcare infrastructure and high adoption rates, the Asia-Pacific region is anticipated to witness the fastest growth fueled by rising healthcare expenditure, expanding middle class, and increasing awareness about cardiovascular health. Europe is expected to maintain steady growth, driven by government initiatives promoting telemedicine and advancements in healthcare technology. The Middle East and Africa and South America are poised for moderate growth, although infrastructural limitations and economic factors may influence market penetration. The forecast period (2025-2033) presents a compelling outlook for the wearable heart monitoring devices market, driven by ongoing technological innovations, increasing healthcare spending, and a growing global focus on preventative healthcare strategies. The industry's continued evolution is likely to be shaped by the development of more accurate, integrated, and AI-powered devices.
Wearable Heart Monitoring Devices Industry: A Comprehensive Market Report (2019-2033)
This in-depth report provides a comprehensive analysis of the Wearable Heart Monitoring Devices industry, encompassing market dynamics, growth trends, regional analysis, product landscape, and key player profiles. The report covers the period from 2019 to 2033, with a focus on the forecast period of 2025-2033 and a base year of 2025. The market is segmented by product (Electric Pulse-based Product, Optical Technology-based Product), device type (Diagnostic & Monitoring Devices, Therapeutic Devices), and application (Sports & Fitness, Remote Patient Monitoring, Home Healthcare). We project the global market size to reach xx Million units by 2033.
Wearable Heart Monitoring Devices Industry Market Dynamics & Structure
This section analyzes the competitive landscape, technological advancements, regulatory environment, and market trends within the wearable heart monitoring devices industry. The market is characterized by a moderately consolidated structure, with key players such as GE Healthcare, Medtronic, and Philips holding significant market share. However, the emergence of innovative startups is intensifying competition.
- Market Concentration: The top 5 players hold an estimated xx% market share in 2025.
- Technological Innovation: Continuous advancements in sensor technology, data analytics, and wireless communication are driving market growth. Miniaturization and improved accuracy are key focus areas.
- Regulatory Frameworks: Stringent regulatory approvals (e.g., FDA clearance) and data privacy regulations influence market dynamics.
- Competitive Substitutes: Traditional ECG and cardiac monitoring methods pose competition, but the convenience and remote monitoring capabilities of wearable devices offer a significant advantage.
- End-User Demographics: The aging population and rising prevalence of cardiovascular diseases are major drivers of market expansion. Increased awareness of heart health and fitness tracking among younger demographics further fuels adoption.
- M&A Trends: The industry has witnessed several mergers and acquisitions in recent years, with larger companies acquiring smaller firms to expand their product portfolios and technological capabilities. We estimate xx M&A deals in the period 2019-2024. Strategic partnerships are also prevalent.
Wearable Heart Monitoring Devices Industry Growth Trends & Insights
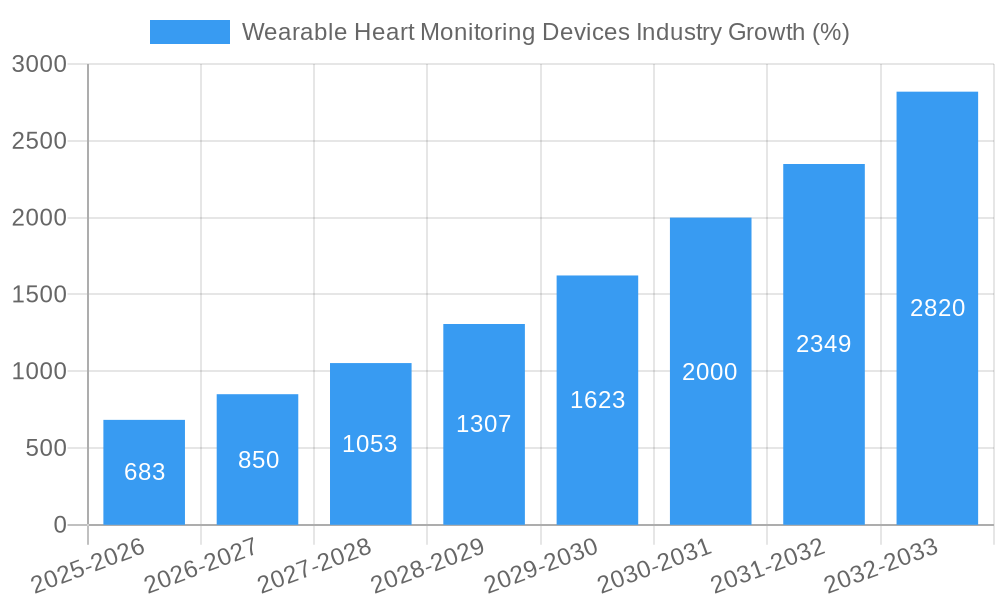
The wearable heart monitoring devices market is experiencing robust growth, driven by increasing demand for remote patient monitoring, technological advancements, and rising healthcare expenditure. The market size has shown a significant increase from xx Million units in 2019 to xx Million units in 2024. We project a CAGR of xx% during the forecast period (2025-2033), reaching xx Million units by 2033. Market penetration is growing steadily, especially in developed regions. Consumer behavior is shifting towards proactive health management, driving adoption of wearable devices for continuous heart monitoring. Technological disruptions, such as the integration of AI and machine learning for improved diagnostics, are accelerating market expansion. The shift towards remote patient monitoring, coupled with the increasing affordability of devices, significantly impacts growth.
Dominant Regions, Countries, or Segments in Wearable Heart Monitoring Devices Industry
North America currently dominates the wearable heart monitoring devices market, driven by high healthcare expenditure, technological advancements, and a robust regulatory framework. However, Asia-Pacific is expected to witness significant growth due to the rising prevalence of cardiovascular diseases and increasing adoption of digital healthcare solutions.
- By Product: Electric Pulse-based products currently hold a larger market share, but Optical Technology-based products are gaining traction due to their non-invasive nature and potential for continuous monitoring.
- By Device Type: Diagnostic & Monitoring Devices constitute the larger segment, driven by the need for early detection and remote monitoring of cardiac conditions. Therapeutic devices are also growing as technology enables more targeted interventions.
- By Application: Remote Patient Monitoring is a key growth driver, with home healthcare and sports & fitness applications also showing considerable potential.
Key Drivers:
- North America: High healthcare expenditure, advanced healthcare infrastructure, strong regulatory support.
- Asia-Pacific: Rising prevalence of cardiovascular diseases, increasing disposable incomes, growing awareness of health and wellness.
- Europe: Growing adoption of telemedicine and remote patient monitoring programs.
Wearable Heart Monitoring Devices Industry Product Landscape
The market offers a diverse range of wearable heart monitoring devices, varying in features, functionalities, and form factors. Recent innovations include advancements in miniaturization, improved sensor accuracy, longer battery life, and integration with smartphone applications for seamless data sharing and analysis. Key features driving product differentiation include continuous ECG monitoring, heart rate variability analysis, activity tracking, and alerts for irregular heart rhythms. The focus is shifting towards user-friendly devices with enhanced data analytics capabilities for personalized health management.
Key Drivers, Barriers & Challenges in Wearable Heart Monitoring Devices Industry
Key Drivers:
- Technological advancements: Miniaturization, improved sensor accuracy, AI-powered diagnostics.
- Rising prevalence of cardiovascular diseases: Increasing demand for early detection and remote monitoring.
- Growing adoption of remote patient monitoring: Enhanced access to healthcare and cost reduction.
Key Challenges:
- Regulatory hurdles: Obtaining necessary approvals for new devices can be time-consuming and costly.
- Data security and privacy concerns: Protecting sensitive patient data is crucial.
- Competition: The market is becoming increasingly competitive, with both established players and startups vying for market share. We estimate xx% year-on-year growth in competition intensity.
Emerging Opportunities in Wearable Heart Monitoring Devices Industry
- Expanding into untapped markets: Focus on emerging economies with high growth potential.
- Development of new applications: Integration with other wearable health trackers and smart home devices.
- Personalized medicine: Tailoring devices and treatments based on individual patient data.
Growth Accelerators in the Wearable Heart Monitoring Devices Industry
Technological breakthroughs, strategic partnerships, and expansion into new markets are key growth accelerators. Advancements in AI and machine learning are improving diagnostic accuracy and enabling personalized health management. Collaborations between technology companies, healthcare providers, and research institutions are accelerating innovation and market adoption. Expansion into emerging economies with significant unmet needs is driving market growth.
Key Players Shaping the Wearable Heart Monitoring Devices Market
- General Electric Company (GE Healthcare Inc)
- iRhythm Technologies Inc
- Qardio Inc
- Baxter
- Hemodynamics Company LLC
- ACS Diagnostics Inc
- Koninklijke Philips N V (BioTelemetry Inc)
- Boston Scientific (Preventice Solutions Inc)
- Heartbit Holdings Plc
- Medtronic plc
- Vital Connect Inc
- Asahi Kasei Corporation (ZOLL Medical Corporation)
Notable Milestones in Wearable Heart Monitoring Devices Industry Sector
- December 2022: Researchers at the University of Missouri College of Engineering designed a breathable, antimicrobial heart health wearable (USD 2.6 million NIH grant). This signifies advancements in materials science and comfort, potentially driving wider adoption.
- March 2022: Amrita University, India, launched Amrita Spandanam, a home-use wearable measuring six vital parameters. This highlights the growth of affordable, accessible devices in emerging markets.
In-Depth Wearable Heart Monitoring Devices Industry Market Outlook
The wearable heart monitoring devices market is poised for sustained growth, fueled by technological innovation, increasing healthcare expenditure, and the expanding adoption of remote patient monitoring. Strategic partnerships and the development of AI-powered diagnostic tools will further enhance market potential. Companies focusing on user-friendly designs, data security, and personalized healthcare solutions are well-positioned to capture significant market share in the coming years.
Wearable Heart Monitoring Devices Industry Segmentation
-
1. Product
- 1.1. Electric Pulse-based Product
- 1.2. Optical Technology-based Product
-
2. Device Type
- 2.1. Diagnostic & Monitoring Devices
- 2.2. Therapeutic Devices
-
3. Application
- 3.1. Sports & Fitness
- 3.2. Remote Patient Monitoring
- 3.3. Home Healthcare
Wearable Heart Monitoring Devices Industry Segmentation By Geography
-
1. North America
- 1.1. United States
- 1.2. Canada
- 1.3. Mexico
-
2. Europe
- 2.1. Germany
- 2.2. United Kingdom
- 2.3. France
- 2.4. Italy
- 2.5. Spain
- 2.6. Rest of Europe
-
3. Asia Pacific
- 3.1. China
- 3.2. Japan
- 3.3. India
- 3.4. Australia
- 3.5. South Korea
- 3.6. Rest of Asia Pacific
-
4. Middle East and Africa
- 4.1. GCC
- 4.2. South Africa
- 4.3. Rest of Middle East and Africa
-
5. South America
- 5.1. Brazil
- 5.2. Argentina
- 5.3. Rest of South America
Wearable Heart Monitoring Devices Industry REPORT HIGHLIGHTS
| Aspects | Details |
|---|---|
| Study Period | 2019-2033 |
| Base Year | 2024 |
| Estimated Year | 2025 |
| Forecast Period | 2025-2033 |
| Historical Period | 2019-2024 |
| Growth Rate | CAGR of 23.22% from 2019-2033 |
| Segmentation |
|
Table of Contents
- 1. Introduction
- 1.1. Research Scope
- 1.2. Market Segmentation
- 1.3. Research Methodology
- 1.4. Definitions and Assumptions
- 2. Executive Summary
- 2.1. Introduction
- 3. Market Dynamics
- 3.1. Introduction
- 3.2. Market Drivers
- 3.2.1. Increasing Rate of Heart Failure; Rising Awareness of Wearables-based Cardiac Monitoring; Technological advancements in Wearable Devices
- 3.3. Market Restrains
- 3.3.1. Privacy and Security Issue of Wearable Devices; Stringent Rules & Regulatory Policy
- 3.4. Market Trends
- 3.4.1. The Optical Technology-based Product is Projected to Have a Notable Growth Rate in the Wearable Heart Monitoring Devices Market Over the Forecast Period
- 4. Market Factor Analysis
- 4.1. Porters Five Forces
- 4.2. Supply/Value Chain
- 4.3. PESTEL analysis
- 4.4. Market Entropy
- 4.5. Patent/Trademark Analysis
- 5. Global Wearable Heart Monitoring Devices Industry Analysis, Insights and Forecast, 2019-2031
- 5.1. Market Analysis, Insights and Forecast - by Product
- 5.1.1. Electric Pulse-based Product
- 5.1.2. Optical Technology-based Product
- 5.2. Market Analysis, Insights and Forecast - by Device Type
- 5.2.1. Diagnostic & Monitoring Devices
- 5.2.2. Therapeutic Devices
- 5.3. Market Analysis, Insights and Forecast - by Application
- 5.3.1. Sports & Fitness
- 5.3.2. Remote Patient Monitoring
- 5.3.3. Home Healthcare
- 5.4. Market Analysis, Insights and Forecast - by Region
- 5.4.1. North America
- 5.4.2. Europe
- 5.4.3. Asia Pacific
- 5.4.4. Middle East and Africa
- 5.4.5. South America
- 5.1. Market Analysis, Insights and Forecast - by Product
- 6. North America Wearable Heart Monitoring Devices Industry Analysis, Insights and Forecast, 2019-2031
- 6.1. Market Analysis, Insights and Forecast - by Product
- 6.1.1. Electric Pulse-based Product
- 6.1.2. Optical Technology-based Product
- 6.2. Market Analysis, Insights and Forecast - by Device Type
- 6.2.1. Diagnostic & Monitoring Devices
- 6.2.2. Therapeutic Devices
- 6.3. Market Analysis, Insights and Forecast - by Application
- 6.3.1. Sports & Fitness
- 6.3.2. Remote Patient Monitoring
- 6.3.3. Home Healthcare
- 6.1. Market Analysis, Insights and Forecast - by Product
- 7. Europe Wearable Heart Monitoring Devices Industry Analysis, Insights and Forecast, 2019-2031
- 7.1. Market Analysis, Insights and Forecast - by Product
- 7.1.1. Electric Pulse-based Product
- 7.1.2. Optical Technology-based Product
- 7.2. Market Analysis, Insights and Forecast - by Device Type
- 7.2.1. Diagnostic & Monitoring Devices
- 7.2.2. Therapeutic Devices
- 7.3. Market Analysis, Insights and Forecast - by Application
- 7.3.1. Sports & Fitness
- 7.3.2. Remote Patient Monitoring
- 7.3.3. Home Healthcare
- 7.1. Market Analysis, Insights and Forecast - by Product
- 8. Asia Pacific Wearable Heart Monitoring Devices Industry Analysis, Insights and Forecast, 2019-2031
- 8.1. Market Analysis, Insights and Forecast - by Product
- 8.1.1. Electric Pulse-based Product
- 8.1.2. Optical Technology-based Product
- 8.2. Market Analysis, Insights and Forecast - by Device Type
- 8.2.1. Diagnostic & Monitoring Devices
- 8.2.2. Therapeutic Devices
- 8.3. Market Analysis, Insights and Forecast - by Application
- 8.3.1. Sports & Fitness
- 8.3.2. Remote Patient Monitoring
- 8.3.3. Home Healthcare
- 8.1. Market Analysis, Insights and Forecast - by Product
- 9. Middle East and Africa Wearable Heart Monitoring Devices Industry Analysis, Insights and Forecast, 2019-2031
- 9.1. Market Analysis, Insights and Forecast - by Product
- 9.1.1. Electric Pulse-based Product
- 9.1.2. Optical Technology-based Product
- 9.2. Market Analysis, Insights and Forecast - by Device Type
- 9.2.1. Diagnostic & Monitoring Devices
- 9.2.2. Therapeutic Devices
- 9.3. Market Analysis, Insights and Forecast - by Application
- 9.3.1. Sports & Fitness
- 9.3.2. Remote Patient Monitoring
- 9.3.3. Home Healthcare
- 9.1. Market Analysis, Insights and Forecast - by Product
- 10. South America Wearable Heart Monitoring Devices Industry Analysis, Insights and Forecast, 2019-2031
- 10.1. Market Analysis, Insights and Forecast - by Product
- 10.1.1. Electric Pulse-based Product
- 10.1.2. Optical Technology-based Product
- 10.2. Market Analysis, Insights and Forecast - by Device Type
- 10.2.1. Diagnostic & Monitoring Devices
- 10.2.2. Therapeutic Devices
- 10.3. Market Analysis, Insights and Forecast - by Application
- 10.3.1. Sports & Fitness
- 10.3.2. Remote Patient Monitoring
- 10.3.3. Home Healthcare
- 10.1. Market Analysis, Insights and Forecast - by Product
- 11. North America Wearable Heart Monitoring Devices Industry Analysis, Insights and Forecast, 2019-2031
- 11.1. Market Analysis, Insights and Forecast - By Country/Sub-region
- 11.1.1 United States
- 11.1.2 Canada
- 11.1.3 Mexico
- 12. Europe Wearable Heart Monitoring Devices Industry Analysis, Insights and Forecast, 2019-2031
- 12.1. Market Analysis, Insights and Forecast - By Country/Sub-region
- 12.1.1 Germany
- 12.1.2 United Kingdom
- 12.1.3 France
- 12.1.4 Italy
- 12.1.5 Spain
- 12.1.6 Rest of Europe
- 13. Asia Pacific Wearable Heart Monitoring Devices Industry Analysis, Insights and Forecast, 2019-2031
- 13.1. Market Analysis, Insights and Forecast - By Country/Sub-region
- 13.1.1 China
- 13.1.2 Japan
- 13.1.3 India
- 13.1.4 Australia
- 13.1.5 South Korea
- 13.1.6 Rest of Asia Pacific
- 14. Middle East and Africa Wearable Heart Monitoring Devices Industry Analysis, Insights and Forecast, 2019-2031
- 14.1. Market Analysis, Insights and Forecast - By Country/Sub-region
- 14.1.1 GCC
- 14.1.2 South Africa
- 14.1.3 Rest of Middle East and Africa
- 15. South America Wearable Heart Monitoring Devices Industry Analysis, Insights and Forecast, 2019-2031
- 15.1. Market Analysis, Insights and Forecast - By Country/Sub-region
- 15.1.1 Brazil
- 15.1.2 Argentina
- 15.1.3 Rest of South America
- 16. Competitive Analysis
- 16.1. Global Market Share Analysis 2024
- 16.2. Company Profiles
- 16.2.1 General Electric Company (GE Healthcare Inc )
- 16.2.1.1. Overview
- 16.2.1.2. Products
- 16.2.1.3. SWOT Analysis
- 16.2.1.4. Recent Developments
- 16.2.1.5. Financials (Based on Availability)
- 16.2.2 iRhythm Technologies Inc
- 16.2.2.1. Overview
- 16.2.2.2. Products
- 16.2.2.3. SWOT Analysis
- 16.2.2.4. Recent Developments
- 16.2.2.5. Financials (Based on Availability)
- 16.2.3 Qardio Inc
- 16.2.3.1. Overview
- 16.2.3.2. Products
- 16.2.3.3. SWOT Analysis
- 16.2.3.4. Recent Developments
- 16.2.3.5. Financials (Based on Availability)
- 16.2.4 Baxter
- 16.2.4.1. Overview
- 16.2.4.2. Products
- 16.2.4.3. SWOT Analysis
- 16.2.4.4. Recent Developments
- 16.2.4.5. Financials (Based on Availability)
- 16.2.5 Hemodynamics Company LLC
- 16.2.5.1. Overview
- 16.2.5.2. Products
- 16.2.5.3. SWOT Analysis
- 16.2.5.4. Recent Developments
- 16.2.5.5. Financials (Based on Availability)
- 16.2.6 ACS Diagnostics Inc
- 16.2.6.1. Overview
- 16.2.6.2. Products
- 16.2.6.3. SWOT Analysis
- 16.2.6.4. Recent Developments
- 16.2.6.5. Financials (Based on Availability)
- 16.2.7 Koninklijke Philips N V (BioTelemetry Inc )
- 16.2.7.1. Overview
- 16.2.7.2. Products
- 16.2.7.3. SWOT Analysis
- 16.2.7.4. Recent Developments
- 16.2.7.5. Financials (Based on Availability)
- 16.2.8 Boston Scientific (Preventice Solutions Inc )
- 16.2.8.1. Overview
- 16.2.8.2. Products
- 16.2.8.3. SWOT Analysis
- 16.2.8.4. Recent Developments
- 16.2.8.5. Financials (Based on Availability)
- 16.2.9 Heartbit Holdings Plc
- 16.2.9.1. Overview
- 16.2.9.2. Products
- 16.2.9.3. SWOT Analysis
- 16.2.9.4. Recent Developments
- 16.2.9.5. Financials (Based on Availability)
- 16.2.10 Medtronic plc
- 16.2.10.1. Overview
- 16.2.10.2. Products
- 16.2.10.3. SWOT Analysis
- 16.2.10.4. Recent Developments
- 16.2.10.5. Financials (Based on Availability)
- 16.2.11 Vital Connect Inc
- 16.2.11.1. Overview
- 16.2.11.2. Products
- 16.2.11.3. SWOT Analysis
- 16.2.11.4. Recent Developments
- 16.2.11.5. Financials (Based on Availability)
- 16.2.12 Asahi Kasei Corporation (ZOLL Medical Corporation)
- 16.2.12.1. Overview
- 16.2.12.2. Products
- 16.2.12.3. SWOT Analysis
- 16.2.12.4. Recent Developments
- 16.2.12.5. Financials (Based on Availability)
- 16.2.1 General Electric Company (GE Healthcare Inc )
List of Figures
- Figure 1: Global Wearable Heart Monitoring Devices Industry Revenue Breakdown (Million, %) by Region 2024 & 2032
- Figure 2: Global Wearable Heart Monitoring Devices Industry Volume Breakdown (K Unit, %) by Region 2024 & 2032
- Figure 3: North America Wearable Heart Monitoring Devices Industry Revenue (Million), by Country 2024 & 2032
- Figure 4: North America Wearable Heart Monitoring Devices Industry Volume (K Unit), by Country 2024 & 2032
- Figure 5: North America Wearable Heart Monitoring Devices Industry Revenue Share (%), by Country 2024 & 2032
- Figure 6: North America Wearable Heart Monitoring Devices Industry Volume Share (%), by Country 2024 & 2032
- Figure 7: Europe Wearable Heart Monitoring Devices Industry Revenue (Million), by Country 2024 & 2032
- Figure 8: Europe Wearable Heart Monitoring Devices Industry Volume (K Unit), by Country 2024 & 2032
- Figure 9: Europe Wearable Heart Monitoring Devices Industry Revenue Share (%), by Country 2024 & 2032
- Figure 10: Europe Wearable Heart Monitoring Devices Industry Volume Share (%), by Country 2024 & 2032
- Figure 11: Asia Pacific Wearable Heart Monitoring Devices Industry Revenue (Million), by Country 2024 & 2032
- Figure 12: Asia Pacific Wearable Heart Monitoring Devices Industry Volume (K Unit), by Country 2024 & 2032
- Figure 13: Asia Pacific Wearable Heart Monitoring Devices Industry Revenue Share (%), by Country 2024 & 2032
- Figure 14: Asia Pacific Wearable Heart Monitoring Devices Industry Volume Share (%), by Country 2024 & 2032
- Figure 15: Middle East and Africa Wearable Heart Monitoring Devices Industry Revenue (Million), by Country 2024 & 2032
- Figure 16: Middle East and Africa Wearable Heart Monitoring Devices Industry Volume (K Unit), by Country 2024 & 2032
- Figure 17: Middle East and Africa Wearable Heart Monitoring Devices Industry Revenue Share (%), by Country 2024 & 2032
- Figure 18: Middle East and Africa Wearable Heart Monitoring Devices Industry Volume Share (%), by Country 2024 & 2032
- Figure 19: South America Wearable Heart Monitoring Devices Industry Revenue (Million), by Country 2024 & 2032
- Figure 20: South America Wearable Heart Monitoring Devices Industry Volume (K Unit), by Country 2024 & 2032
- Figure 21: South America Wearable Heart Monitoring Devices Industry Revenue Share (%), by Country 2024 & 2032
- Figure 22: South America Wearable Heart Monitoring Devices Industry Volume Share (%), by Country 2024 & 2032
- Figure 23: North America Wearable Heart Monitoring Devices Industry Revenue (Million), by Product 2024 & 2032
- Figure 24: North America Wearable Heart Monitoring Devices Industry Volume (K Unit), by Product 2024 & 2032
- Figure 25: North America Wearable Heart Monitoring Devices Industry Revenue Share (%), by Product 2024 & 2032
- Figure 26: North America Wearable Heart Monitoring Devices Industry Volume Share (%), by Product 2024 & 2032
- Figure 27: North America Wearable Heart Monitoring Devices Industry Revenue (Million), by Device Type 2024 & 2032
- Figure 28: North America Wearable Heart Monitoring Devices Industry Volume (K Unit), by Device Type 2024 & 2032
- Figure 29: North America Wearable Heart Monitoring Devices Industry Revenue Share (%), by Device Type 2024 & 2032
- Figure 30: North America Wearable Heart Monitoring Devices Industry Volume Share (%), by Device Type 2024 & 2032
- Figure 31: North America Wearable Heart Monitoring Devices Industry Revenue (Million), by Application 2024 & 2032
- Figure 32: North America Wearable Heart Monitoring Devices Industry Volume (K Unit), by Application 2024 & 2032
- Figure 33: North America Wearable Heart Monitoring Devices Industry Revenue Share (%), by Application 2024 & 2032
- Figure 34: North America Wearable Heart Monitoring Devices Industry Volume Share (%), by Application 2024 & 2032
- Figure 35: North America Wearable Heart Monitoring Devices Industry Revenue (Million), by Country 2024 & 2032
- Figure 36: North America Wearable Heart Monitoring Devices Industry Volume (K Unit), by Country 2024 & 2032
- Figure 37: North America Wearable Heart Monitoring Devices Industry Revenue Share (%), by Country 2024 & 2032
- Figure 38: North America Wearable Heart Monitoring Devices Industry Volume Share (%), by Country 2024 & 2032
- Figure 39: Europe Wearable Heart Monitoring Devices Industry Revenue (Million), by Product 2024 & 2032
- Figure 40: Europe Wearable Heart Monitoring Devices Industry Volume (K Unit), by Product 2024 & 2032
- Figure 41: Europe Wearable Heart Monitoring Devices Industry Revenue Share (%), by Product 2024 & 2032
- Figure 42: Europe Wearable Heart Monitoring Devices Industry Volume Share (%), by Product 2024 & 2032
- Figure 43: Europe Wearable Heart Monitoring Devices Industry Revenue (Million), by Device Type 2024 & 2032
- Figure 44: Europe Wearable Heart Monitoring Devices Industry Volume (K Unit), by Device Type 2024 & 2032
- Figure 45: Europe Wearable Heart Monitoring Devices Industry Revenue Share (%), by Device Type 2024 & 2032
- Figure 46: Europe Wearable Heart Monitoring Devices Industry Volume Share (%), by Device Type 2024 & 2032
- Figure 47: Europe Wearable Heart Monitoring Devices Industry Revenue (Million), by Application 2024 & 2032
- Figure 48: Europe Wearable Heart Monitoring Devices Industry Volume (K Unit), by Application 2024 & 2032
- Figure 49: Europe Wearable Heart Monitoring Devices Industry Revenue Share (%), by Application 2024 & 2032
- Figure 50: Europe Wearable Heart Monitoring Devices Industry Volume Share (%), by Application 2024 & 2032
- Figure 51: Europe Wearable Heart Monitoring Devices Industry Revenue (Million), by Country 2024 & 2032
- Figure 52: Europe Wearable Heart Monitoring Devices Industry Volume (K Unit), by Country 2024 & 2032
- Figure 53: Europe Wearable Heart Monitoring Devices Industry Revenue Share (%), by Country 2024 & 2032
- Figure 54: Europe Wearable Heart Monitoring Devices Industry Volume Share (%), by Country 2024 & 2032
- Figure 55: Asia Pacific Wearable Heart Monitoring Devices Industry Revenue (Million), by Product 2024 & 2032
- Figure 56: Asia Pacific Wearable Heart Monitoring Devices Industry Volume (K Unit), by Product 2024 & 2032
- Figure 57: Asia Pacific Wearable Heart Monitoring Devices Industry Revenue Share (%), by Product 2024 & 2032
- Figure 58: Asia Pacific Wearable Heart Monitoring Devices Industry Volume Share (%), by Product 2024 & 2032
- Figure 59: Asia Pacific Wearable Heart Monitoring Devices Industry Revenue (Million), by Device Type 2024 & 2032
- Figure 60: Asia Pacific Wearable Heart Monitoring Devices Industry Volume (K Unit), by Device Type 2024 & 2032
- Figure 61: Asia Pacific Wearable Heart Monitoring Devices Industry Revenue Share (%), by Device Type 2024 & 2032
- Figure 62: Asia Pacific Wearable Heart Monitoring Devices Industry Volume Share (%), by Device Type 2024 & 2032
- Figure 63: Asia Pacific Wearable Heart Monitoring Devices Industry Revenue (Million), by Application 2024 & 2032
- Figure 64: Asia Pacific Wearable Heart Monitoring Devices Industry Volume (K Unit), by Application 2024 & 2032
- Figure 65: Asia Pacific Wearable Heart Monitoring Devices Industry Revenue Share (%), by Application 2024 & 2032
- Figure 66: Asia Pacific Wearable Heart Monitoring Devices Industry Volume Share (%), by Application 2024 & 2032
- Figure 67: Asia Pacific Wearable Heart Monitoring Devices Industry Revenue (Million), by Country 2024 & 2032
- Figure 68: Asia Pacific Wearable Heart Monitoring Devices Industry Volume (K Unit), by Country 2024 & 2032
- Figure 69: Asia Pacific Wearable Heart Monitoring Devices Industry Revenue Share (%), by Country 2024 & 2032
- Figure 70: Asia Pacific Wearable Heart Monitoring Devices Industry Volume Share (%), by Country 2024 & 2032
- Figure 71: Middle East and Africa Wearable Heart Monitoring Devices Industry Revenue (Million), by Product 2024 & 2032
- Figure 72: Middle East and Africa Wearable Heart Monitoring Devices Industry Volume (K Unit), by Product 2024 & 2032
- Figure 73: Middle East and Africa Wearable Heart Monitoring Devices Industry Revenue Share (%), by Product 2024 & 2032
- Figure 74: Middle East and Africa Wearable Heart Monitoring Devices Industry Volume Share (%), by Product 2024 & 2032
- Figure 75: Middle East and Africa Wearable Heart Monitoring Devices Industry Revenue (Million), by Device Type 2024 & 2032
- Figure 76: Middle East and Africa Wearable Heart Monitoring Devices Industry Volume (K Unit), by Device Type 2024 & 2032
- Figure 77: Middle East and Africa Wearable Heart Monitoring Devices Industry Revenue Share (%), by Device Type 2024 & 2032
- Figure 78: Middle East and Africa Wearable Heart Monitoring Devices Industry Volume Share (%), by Device Type 2024 & 2032
- Figure 79: Middle East and Africa Wearable Heart Monitoring Devices Industry Revenue (Million), by Application 2024 & 2032
- Figure 80: Middle East and Africa Wearable Heart Monitoring Devices Industry Volume (K Unit), by Application 2024 & 2032
- Figure 81: Middle East and Africa Wearable Heart Monitoring Devices Industry Revenue Share (%), by Application 2024 & 2032
- Figure 82: Middle East and Africa Wearable Heart Monitoring Devices Industry Volume Share (%), by Application 2024 & 2032
- Figure 83: Middle East and Africa Wearable Heart Monitoring Devices Industry Revenue (Million), by Country 2024 & 2032
- Figure 84: Middle East and Africa Wearable Heart Monitoring Devices Industry Volume (K Unit), by Country 2024 & 2032
- Figure 85: Middle East and Africa Wearable Heart Monitoring Devices Industry Revenue Share (%), by Country 2024 & 2032
- Figure 86: Middle East and Africa Wearable Heart Monitoring Devices Industry Volume Share (%), by Country 2024 & 2032
- Figure 87: South America Wearable Heart Monitoring Devices Industry Revenue (Million), by Product 2024 & 2032
- Figure 88: South America Wearable Heart Monitoring Devices Industry Volume (K Unit), by Product 2024 & 2032
- Figure 89: South America Wearable Heart Monitoring Devices Industry Revenue Share (%), by Product 2024 & 2032
- Figure 90: South America Wearable Heart Monitoring Devices Industry Volume Share (%), by Product 2024 & 2032
- Figure 91: South America Wearable Heart Monitoring Devices Industry Revenue (Million), by Device Type 2024 & 2032
- Figure 92: South America Wearable Heart Monitoring Devices Industry Volume (K Unit), by Device Type 2024 & 2032
- Figure 93: South America Wearable Heart Monitoring Devices Industry Revenue Share (%), by Device Type 2024 & 2032
- Figure 94: South America Wearable Heart Monitoring Devices Industry Volume Share (%), by Device Type 2024 & 2032
- Figure 95: South America Wearable Heart Monitoring Devices Industry Revenue (Million), by Application 2024 & 2032
- Figure 96: South America Wearable Heart Monitoring Devices Industry Volume (K Unit), by Application 2024 & 2032
- Figure 97: South America Wearable Heart Monitoring Devices Industry Revenue Share (%), by Application 2024 & 2032
- Figure 98: South America Wearable Heart Monitoring Devices Industry Volume Share (%), by Application 2024 & 2032
- Figure 99: South America Wearable Heart Monitoring Devices Industry Revenue (Million), by Country 2024 & 2032
- Figure 100: South America Wearable Heart Monitoring Devices Industry Volume (K Unit), by Country 2024 & 2032
- Figure 101: South America Wearable Heart Monitoring Devices Industry Revenue Share (%), by Country 2024 & 2032
- Figure 102: South America Wearable Heart Monitoring Devices Industry Volume Share (%), by Country 2024 & 2032
List of Tables
- Table 1: Global Wearable Heart Monitoring Devices Industry Revenue Million Forecast, by Region 2019 & 2032
- Table 2: Global Wearable Heart Monitoring Devices Industry Volume K Unit Forecast, by Region 2019 & 2032
- Table 3: Global Wearable Heart Monitoring Devices Industry Revenue Million Forecast, by Product 2019 & 2032
- Table 4: Global Wearable Heart Monitoring Devices Industry Volume K Unit Forecast, by Product 2019 & 2032
- Table 5: Global Wearable Heart Monitoring Devices Industry Revenue Million Forecast, by Device Type 2019 & 2032
- Table 6: Global Wearable Heart Monitoring Devices Industry Volume K Unit Forecast, by Device Type 2019 & 2032
- Table 7: Global Wearable Heart Monitoring Devices Industry Revenue Million Forecast, by Application 2019 & 2032
- Table 8: Global Wearable Heart Monitoring Devices Industry Volume K Unit Forecast, by Application 2019 & 2032
- Table 9: Global Wearable Heart Monitoring Devices Industry Revenue Million Forecast, by Region 2019 & 2032
- Table 10: Global Wearable Heart Monitoring Devices Industry Volume K Unit Forecast, by Region 2019 & 2032
- Table 11: Global Wearable Heart Monitoring Devices Industry Revenue Million Forecast, by Country 2019 & 2032
- Table 12: Global Wearable Heart Monitoring Devices Industry Volume K Unit Forecast, by Country 2019 & 2032
- Table 13: United States Wearable Heart Monitoring Devices Industry Revenue (Million) Forecast, by Application 2019 & 2032
- Table 14: United States Wearable Heart Monitoring Devices Industry Volume (K Unit) Forecast, by Application 2019 & 2032
- Table 15: Canada Wearable Heart Monitoring Devices Industry Revenue (Million) Forecast, by Application 2019 & 2032
- Table 16: Canada Wearable Heart Monitoring Devices Industry Volume (K Unit) Forecast, by Application 2019 & 2032
- Table 17: Mexico Wearable Heart Monitoring Devices Industry Revenue (Million) Forecast, by Application 2019 & 2032
- Table 18: Mexico Wearable Heart Monitoring Devices Industry Volume (K Unit) Forecast, by Application 2019 & 2032
- Table 19: Global Wearable Heart Monitoring Devices Industry Revenue Million Forecast, by Country 2019 & 2032
- Table 20: Global Wearable Heart Monitoring Devices Industry Volume K Unit Forecast, by Country 2019 & 2032
- Table 21: Germany Wearable Heart Monitoring Devices Industry Revenue (Million) Forecast, by Application 2019 & 2032
- Table 22: Germany Wearable Heart Monitoring Devices Industry Volume (K Unit) Forecast, by Application 2019 & 2032
- Table 23: United Kingdom Wearable Heart Monitoring Devices Industry Revenue (Million) Forecast, by Application 2019 & 2032
- Table 24: United Kingdom Wearable Heart Monitoring Devices Industry Volume (K Unit) Forecast, by Application 2019 & 2032
- Table 25: France Wearable Heart Monitoring Devices Industry Revenue (Million) Forecast, by Application 2019 & 2032
- Table 26: France Wearable Heart Monitoring Devices Industry Volume (K Unit) Forecast, by Application 2019 & 2032
- Table 27: Italy Wearable Heart Monitoring Devices Industry Revenue (Million) Forecast, by Application 2019 & 2032
- Table 28: Italy Wearable Heart Monitoring Devices Industry Volume (K Unit) Forecast, by Application 2019 & 2032
- Table 29: Spain Wearable Heart Monitoring Devices Industry Revenue (Million) Forecast, by Application 2019 & 2032
- Table 30: Spain Wearable Heart Monitoring Devices Industry Volume (K Unit) Forecast, by Application 2019 & 2032
- Table 31: Rest of Europe Wearable Heart Monitoring Devices Industry Revenue (Million) Forecast, by Application 2019 & 2032
- Table 32: Rest of Europe Wearable Heart Monitoring Devices Industry Volume (K Unit) Forecast, by Application 2019 & 2032
- Table 33: Global Wearable Heart Monitoring Devices Industry Revenue Million Forecast, by Country 2019 & 2032
- Table 34: Global Wearable Heart Monitoring Devices Industry Volume K Unit Forecast, by Country 2019 & 2032
- Table 35: China Wearable Heart Monitoring Devices Industry Revenue (Million) Forecast, by Application 2019 & 2032
- Table 36: China Wearable Heart Monitoring Devices Industry Volume (K Unit) Forecast, by Application 2019 & 2032
- Table 37: Japan Wearable Heart Monitoring Devices Industry Revenue (Million) Forecast, by Application 2019 & 2032
- Table 38: Japan Wearable Heart Monitoring Devices Industry Volume (K Unit) Forecast, by Application 2019 & 2032
- Table 39: India Wearable Heart Monitoring Devices Industry Revenue (Million) Forecast, by Application 2019 & 2032
- Table 40: India Wearable Heart Monitoring Devices Industry Volume (K Unit) Forecast, by Application 2019 & 2032
- Table 41: Australia Wearable Heart Monitoring Devices Industry Revenue (Million) Forecast, by Application 2019 & 2032
- Table 42: Australia Wearable Heart Monitoring Devices Industry Volume (K Unit) Forecast, by Application 2019 & 2032
- Table 43: South Korea Wearable Heart Monitoring Devices Industry Revenue (Million) Forecast, by Application 2019 & 2032
- Table 44: South Korea Wearable Heart Monitoring Devices Industry Volume (K Unit) Forecast, by Application 2019 & 2032
- Table 45: Rest of Asia Pacific Wearable Heart Monitoring Devices Industry Revenue (Million) Forecast, by Application 2019 & 2032
- Table 46: Rest of Asia Pacific Wearable Heart Monitoring Devices Industry Volume (K Unit) Forecast, by Application 2019 & 2032
- Table 47: Global Wearable Heart Monitoring Devices Industry Revenue Million Forecast, by Country 2019 & 2032
- Table 48: Global Wearable Heart Monitoring Devices Industry Volume K Unit Forecast, by Country 2019 & 2032
- Table 49: GCC Wearable Heart Monitoring Devices Industry Revenue (Million) Forecast, by Application 2019 & 2032
- Table 50: GCC Wearable Heart Monitoring Devices Industry Volume (K Unit) Forecast, by Application 2019 & 2032
- Table 51: South Africa Wearable Heart Monitoring Devices Industry Revenue (Million) Forecast, by Application 2019 & 2032
- Table 52: South Africa Wearable Heart Monitoring Devices Industry Volume (K Unit) Forecast, by Application 2019 & 2032
- Table 53: Rest of Middle East and Africa Wearable Heart Monitoring Devices Industry Revenue (Million) Forecast, by Application 2019 & 2032
- Table 54: Rest of Middle East and Africa Wearable Heart Monitoring Devices Industry Volume (K Unit) Forecast, by Application 2019 & 2032
- Table 55: Global Wearable Heart Monitoring Devices Industry Revenue Million Forecast, by Country 2019 & 2032
- Table 56: Global Wearable Heart Monitoring Devices Industry Volume K Unit Forecast, by Country 2019 & 2032
- Table 57: Brazil Wearable Heart Monitoring Devices Industry Revenue (Million) Forecast, by Application 2019 & 2032
- Table 58: Brazil Wearable Heart Monitoring Devices Industry Volume (K Unit) Forecast, by Application 2019 & 2032
- Table 59: Argentina Wearable Heart Monitoring Devices Industry Revenue (Million) Forecast, by Application 2019 & 2032
- Table 60: Argentina Wearable Heart Monitoring Devices Industry Volume (K Unit) Forecast, by Application 2019 & 2032
- Table 61: Rest of South America Wearable Heart Monitoring Devices Industry Revenue (Million) Forecast, by Application 2019 & 2032
- Table 62: Rest of South America Wearable Heart Monitoring Devices Industry Volume (K Unit) Forecast, by Application 2019 & 2032
- Table 63: Global Wearable Heart Monitoring Devices Industry Revenue Million Forecast, by Product 2019 & 2032
- Table 64: Global Wearable Heart Monitoring Devices Industry Volume K Unit Forecast, by Product 2019 & 2032
- Table 65: Global Wearable Heart Monitoring Devices Industry Revenue Million Forecast, by Device Type 2019 & 2032
- Table 66: Global Wearable Heart Monitoring Devices Industry Volume K Unit Forecast, by Device Type 2019 & 2032
- Table 67: Global Wearable Heart Monitoring Devices Industry Revenue Million Forecast, by Application 2019 & 2032
- Table 68: Global Wearable Heart Monitoring Devices Industry Volume K Unit Forecast, by Application 2019 & 2032
- Table 69: Global Wearable Heart Monitoring Devices Industry Revenue Million Forecast, by Country 2019 & 2032
- Table 70: Global Wearable Heart Monitoring Devices Industry Volume K Unit Forecast, by Country 2019 & 2032
- Table 71: United States Wearable Heart Monitoring Devices Industry Revenue (Million) Forecast, by Application 2019 & 2032
- Table 72: United States Wearable Heart Monitoring Devices Industry Volume (K Unit) Forecast, by Application 2019 & 2032
- Table 73: Canada Wearable Heart Monitoring Devices Industry Revenue (Million) Forecast, by Application 2019 & 2032
- Table 74: Canada Wearable Heart Monitoring Devices Industry Volume (K Unit) Forecast, by Application 2019 & 2032
- Table 75: Mexico Wearable Heart Monitoring Devices Industry Revenue (Million) Forecast, by Application 2019 & 2032
- Table 76: Mexico Wearable Heart Monitoring Devices Industry Volume (K Unit) Forecast, by Application 2019 & 2032
- Table 77: Global Wearable Heart Monitoring Devices Industry Revenue Million Forecast, by Product 2019 & 2032
- Table 78: Global Wearable Heart Monitoring Devices Industry Volume K Unit Forecast, by Product 2019 & 2032
- Table 79: Global Wearable Heart Monitoring Devices Industry Revenue Million Forecast, by Device Type 2019 & 2032
- Table 80: Global Wearable Heart Monitoring Devices Industry Volume K Unit Forecast, by Device Type 2019 & 2032
- Table 81: Global Wearable Heart Monitoring Devices Industry Revenue Million Forecast, by Application 2019 & 2032
- Table 82: Global Wearable Heart Monitoring Devices Industry Volume K Unit Forecast, by Application 2019 & 2032
- Table 83: Global Wearable Heart Monitoring Devices Industry Revenue Million Forecast, by Country 2019 & 2032
- Table 84: Global Wearable Heart Monitoring Devices Industry Volume K Unit Forecast, by Country 2019 & 2032
- Table 85: Germany Wearable Heart Monitoring Devices Industry Revenue (Million) Forecast, by Application 2019 & 2032
- Table 86: Germany Wearable Heart Monitoring Devices Industry Volume (K Unit) Forecast, by Application 2019 & 2032
- Table 87: United Kingdom Wearable Heart Monitoring Devices Industry Revenue (Million) Forecast, by Application 2019 & 2032
- Table 88: United Kingdom Wearable Heart Monitoring Devices Industry Volume (K Unit) Forecast, by Application 2019 & 2032
- Table 89: France Wearable Heart Monitoring Devices Industry Revenue (Million) Forecast, by Application 2019 & 2032
- Table 90: France Wearable Heart Monitoring Devices Industry Volume (K Unit) Forecast, by Application 2019 & 2032
- Table 91: Italy Wearable Heart Monitoring Devices Industry Revenue (Million) Forecast, by Application 2019 & 2032
- Table 92: Italy Wearable Heart Monitoring Devices Industry Volume (K Unit) Forecast, by Application 2019 & 2032
- Table 93: Spain Wearable Heart Monitoring Devices Industry Revenue (Million) Forecast, by Application 2019 & 2032
- Table 94: Spain Wearable Heart Monitoring Devices Industry Volume (K Unit) Forecast, by Application 2019 & 2032
- Table 95: Rest of Europe Wearable Heart Monitoring Devices Industry Revenue (Million) Forecast, by Application 2019 & 2032
- Table 96: Rest of Europe Wearable Heart Monitoring Devices Industry Volume (K Unit) Forecast, by Application 2019 & 2032
- Table 97: Global Wearable Heart Monitoring Devices Industry Revenue Million Forecast, by Product 2019 & 2032
- Table 98: Global Wearable Heart Monitoring Devices Industry Volume K Unit Forecast, by Product 2019 & 2032
- Table 99: Global Wearable Heart Monitoring Devices Industry Revenue Million Forecast, by Device Type 2019 & 2032
- Table 100: Global Wearable Heart Monitoring Devices Industry Volume K Unit Forecast, by Device Type 2019 & 2032
- Table 101: Global Wearable Heart Monitoring Devices Industry Revenue Million Forecast, by Application 2019 & 2032
- Table 102: Global Wearable Heart Monitoring Devices Industry Volume K Unit Forecast, by Application 2019 & 2032
- Table 103: Global Wearable Heart Monitoring Devices Industry Revenue Million Forecast, by Country 2019 & 2032
- Table 104: Global Wearable Heart Monitoring Devices Industry Volume K Unit Forecast, by Country 2019 & 2032
- Table 105: China Wearable Heart Monitoring Devices Industry Revenue (Million) Forecast, by Application 2019 & 2032
- Table 106: China Wearable Heart Monitoring Devices Industry Volume (K Unit) Forecast, by Application 2019 & 2032
- Table 107: Japan Wearable Heart Monitoring Devices Industry Revenue (Million) Forecast, by Application 2019 & 2032
- Table 108: Japan Wearable Heart Monitoring Devices Industry Volume (K Unit) Forecast, by Application 2019 & 2032
- Table 109: India Wearable Heart Monitoring Devices Industry Revenue (Million) Forecast, by Application 2019 & 2032
- Table 110: India Wearable Heart Monitoring Devices Industry Volume (K Unit) Forecast, by Application 2019 & 2032
- Table 111: Australia Wearable Heart Monitoring Devices Industry Revenue (Million) Forecast, by Application 2019 & 2032
- Table 112: Australia Wearable Heart Monitoring Devices Industry Volume (K Unit) Forecast, by Application 2019 & 2032
- Table 113: South Korea Wearable Heart Monitoring Devices Industry Revenue (Million) Forecast, by Application 2019 & 2032
- Table 114: South Korea Wearable Heart Monitoring Devices Industry Volume (K Unit) Forecast, by Application 2019 & 2032
- Table 115: Rest of Asia Pacific Wearable Heart Monitoring Devices Industry Revenue (Million) Forecast, by Application 2019 & 2032
- Table 116: Rest of Asia Pacific Wearable Heart Monitoring Devices Industry Volume (K Unit) Forecast, by Application 2019 & 2032
- Table 117: Global Wearable Heart Monitoring Devices Industry Revenue Million Forecast, by Product 2019 & 2032
- Table 118: Global Wearable Heart Monitoring Devices Industry Volume K Unit Forecast, by Product 2019 & 2032
- Table 119: Global Wearable Heart Monitoring Devices Industry Revenue Million Forecast, by Device Type 2019 & 2032
- Table 120: Global Wearable Heart Monitoring Devices Industry Volume K Unit Forecast, by Device Type 2019 & 2032
- Table 121: Global Wearable Heart Monitoring Devices Industry Revenue Million Forecast, by Application 2019 & 2032
- Table 122: Global Wearable Heart Monitoring Devices Industry Volume K Unit Forecast, by Application 2019 & 2032
- Table 123: Global Wearable Heart Monitoring Devices Industry Revenue Million Forecast, by Country 2019 & 2032
- Table 124: Global Wearable Heart Monitoring Devices Industry Volume K Unit Forecast, by Country 2019 & 2032
- Table 125: GCC Wearable Heart Monitoring Devices Industry Revenue (Million) Forecast, by Application 2019 & 2032
- Table 126: GCC Wearable Heart Monitoring Devices Industry Volume (K Unit) Forecast, by Application 2019 & 2032
- Table 127: South Africa Wearable Heart Monitoring Devices Industry Revenue (Million) Forecast, by Application 2019 & 2032
- Table 128: South Africa Wearable Heart Monitoring Devices Industry Volume (K Unit) Forecast, by Application 2019 & 2032
- Table 129: Rest of Middle East and Africa Wearable Heart Monitoring Devices Industry Revenue (Million) Forecast, by Application 2019 & 2032
- Table 130: Rest of Middle East and Africa Wearable Heart Monitoring Devices Industry Volume (K Unit) Forecast, by Application 2019 & 2032
- Table 131: Global Wearable Heart Monitoring Devices Industry Revenue Million Forecast, by Product 2019 & 2032
- Table 132: Global Wearable Heart Monitoring Devices Industry Volume K Unit Forecast, by Product 2019 & 2032
- Table 133: Global Wearable Heart Monitoring Devices Industry Revenue Million Forecast, by Device Type 2019 & 2032
- Table 134: Global Wearable Heart Monitoring Devices Industry Volume K Unit Forecast, by Device Type 2019 & 2032
- Table 135: Global Wearable Heart Monitoring Devices Industry Revenue Million Forecast, by Application 2019 & 2032
- Table 136: Global Wearable Heart Monitoring Devices Industry Volume K Unit Forecast, by Application 2019 & 2032
- Table 137: Global Wearable Heart Monitoring Devices Industry Revenue Million Forecast, by Country 2019 & 2032
- Table 138: Global Wearable Heart Monitoring Devices Industry Volume K Unit Forecast, by Country 2019 & 2032
- Table 139: Brazil Wearable Heart Monitoring Devices Industry Revenue (Million) Forecast, by Application 2019 & 2032
- Table 140: Brazil Wearable Heart Monitoring Devices Industry Volume (K Unit) Forecast, by Application 2019 & 2032
- Table 141: Argentina Wearable Heart Monitoring Devices Industry Revenue (Million) Forecast, by Application 2019 & 2032
- Table 142: Argentina Wearable Heart Monitoring Devices Industry Volume (K Unit) Forecast, by Application 2019 & 2032
- Table 143: Rest of South America Wearable Heart Monitoring Devices Industry Revenue (Million) Forecast, by Application 2019 & 2032
- Table 144: Rest of South America Wearable Heart Monitoring Devices Industry Volume (K Unit) Forecast, by Application 2019 & 2032
Frequently Asked Questions
1. What is the projected Compound Annual Growth Rate (CAGR) of the Wearable Heart Monitoring Devices Industry?
The projected CAGR is approximately 23.22%.
2. Which companies are prominent players in the Wearable Heart Monitoring Devices Industry?
Key companies in the market include General Electric Company (GE Healthcare Inc ), iRhythm Technologies Inc, Qardio Inc, Baxter, Hemodynamics Company LLC, ACS Diagnostics Inc, Koninklijke Philips N V (BioTelemetry Inc ), Boston Scientific (Preventice Solutions Inc ), Heartbit Holdings Plc, Medtronic plc, Vital Connect Inc , Asahi Kasei Corporation (ZOLL Medical Corporation).
3. What are the main segments of the Wearable Heart Monitoring Devices Industry?
The market segments include Product, Device Type, Application.
4. Can you provide details about the market size?
The market size is estimated to be USD 2.98 Million as of 2022.
5. What are some drivers contributing to market growth?
Increasing Rate of Heart Failure; Rising Awareness of Wearables-based Cardiac Monitoring; Technological advancements in Wearable Devices.
6. What are the notable trends driving market growth?
The Optical Technology-based Product is Projected to Have a Notable Growth Rate in the Wearable Heart Monitoring Devices Market Over the Forecast Period.
7. Are there any restraints impacting market growth?
Privacy and Security Issue of Wearable Devices; Stringent Rules & Regulatory Policy.
8. Can you provide examples of recent developments in the market?
In December 2022, researchers at the University of Missouri College of Engineering designed a breathable new heart health wearable with antimicrobial properties using a USD 2.6 million grant from the National Institute of Health.
9. What pricing options are available for accessing the report?
Pricing options include single-user, multi-user, and enterprise licenses priced at USD 4750, USD 5250, and USD 8750 respectively.
10. Is the market size provided in terms of value or volume?
The market size is provided in terms of value, measured in Million and volume, measured in K Unit.
11. Are there any specific market keywords associated with the report?
Yes, the market keyword associated with the report is "Wearable Heart Monitoring Devices Industry," which aids in identifying and referencing the specific market segment covered.
12. How do I determine which pricing option suits my needs best?
The pricing options vary based on user requirements and access needs. Individual users may opt for single-user licenses, while businesses requiring broader access may choose multi-user or enterprise licenses for cost-effective access to the report.
13. Are there any additional resources or data provided in the Wearable Heart Monitoring Devices Industry report?
While the report offers comprehensive insights, it's advisable to review the specific contents or supplementary materials provided to ascertain if additional resources or data are available.
14. How can I stay updated on further developments or reports in the Wearable Heart Monitoring Devices Industry?
To stay informed about further developments, trends, and reports in the Wearable Heart Monitoring Devices Industry, consider subscribing to industry newsletters, following relevant companies and organizations, or regularly checking reputable industry news sources and publications.
Methodology
Step 1 - Identification of Relevant Samples Size from Population Database


Step 2 - Approaches for Defining Global Market Size (Value, Volume* & Price*)

Note*: In applicable scenarios
Step 3 - Data Sources
Primary Research
- Web Analytics
- Survey Reports
- Research Institute
- Latest Research Reports
- Opinion Leaders
Secondary Research
- Annual Reports
- White Paper
- Latest Press Release
- Industry Association
- Paid Database
- Investor Presentations

Step 4 - Data Triangulation
Involves using different sources of information in order to increase the validity of a study
These sources are likely to be stakeholders in a program - participants, other researchers, program staff, other community members, and so on.
Then we put all data in single framework & apply various statistical tools to find out the dynamic on the market.
During the analysis stage, feedback from the stakeholder groups would be compared to determine areas of agreement as well as areas of divergence


