
Key Insights
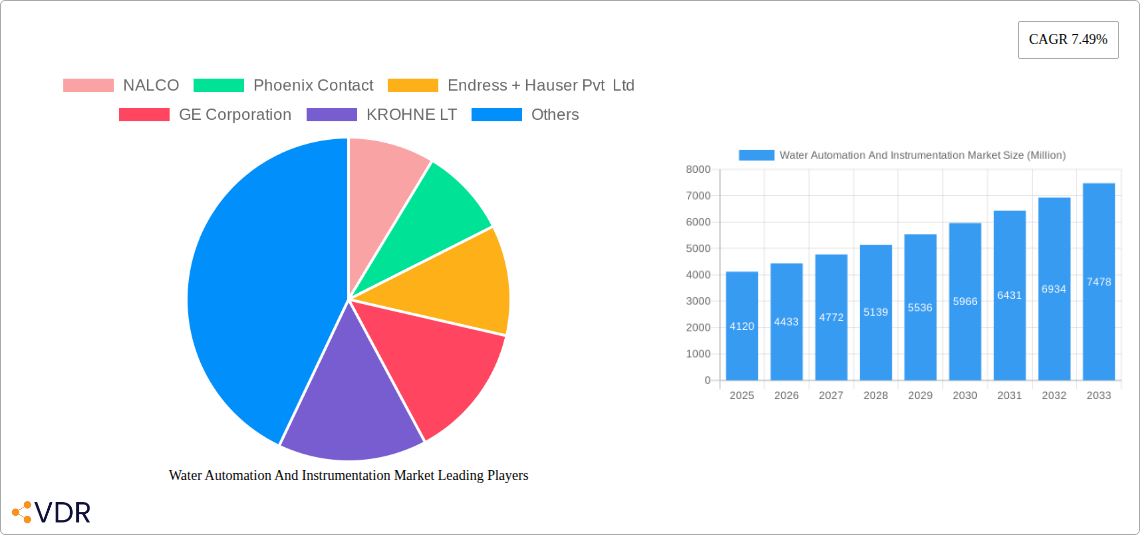
The global Water Automation and Instrumentation Market, valued at $4.12 billion in 2025, is projected to experience robust growth, driven by increasing demand for efficient water management solutions across diverse industries. A Compound Annual Growth Rate (CAGR) of 7.49% from 2025 to 2033 indicates a significant expansion of the market. This growth is fueled by several key factors. Firstly, the escalating need for water conservation and optimized resource utilization in sectors like manufacturing, utilities, and food & beverage is driving the adoption of advanced automation and instrumentation technologies. Secondly, stringent government regulations aimed at improving water quality and reducing water loss are pushing industries towards implementing sophisticated monitoring and control systems. Furthermore, technological advancements in areas such as smart sensors, data analytics, and cloud-based solutions are enhancing the efficiency and effectiveness of water management systems, leading to increased market demand. The market is segmented by solution type (automation and instrumentation), encompassing technologies like DCS, SCADA, PLCs, various transmitters, and analyzers. Key players like Nalco, Endress+Hauser, and Siemens are actively involved in developing and deploying innovative solutions. Geographically, North America and Europe currently hold significant market shares, but the Asia-Pacific region is expected to demonstrate substantial growth due to rapid industrialization and rising infrastructure development.
The competitive landscape is characterized by the presence of both established players and emerging technology providers. Large multinational corporations leverage their extensive global reach and technological expertise to dominate the market. However, smaller, specialized companies are focusing on niche applications and innovative solutions to carve a space for themselves. Future market growth will depend on continued technological innovation, the increasing adoption of Industry 4.0 principles in water management, and the expansion of smart water infrastructure globally. The market's trajectory is positive, indicating significant opportunities for investment and growth in the coming years, particularly in areas focusing on sustainable water resource management and precision agriculture. The ongoing development of more robust and reliable sensors, along with the increasing integration of AI and machine learning for predictive maintenance and optimal resource allocation, is poised to further fuel market expansion.
This comprehensive report provides an in-depth analysis of the Water Automation and Instrumentation Market, encompassing market dynamics, growth trends, regional dominance, product landscape, key players, and future outlook. The study period covers 2019-2033, with 2025 as the base year and a forecast period of 2025-2033. The report segments the market by Water Automation Solutions (DCS, SCADA, PLC, IAM, HMI, Other), Water Instrumentation Solutions (Pressure Transmitter, Level Transmitter, Temperature Transmitter, Liquid Analyzers, Gas Analyzers, Leakage Detection Systems, Flow Sensors/Transmitters, Other), and End-user Industries (Chemical, Manufacturing, Food and Beverages, Utilities, Paper and Pulp, Other). The market size is presented in Million units.
Water Automation and Instrumentation Market Dynamics & Structure
The Water Automation and Instrumentation market is experiencing significant growth driven by increasing demand for efficient water management and stringent regulatory compliance. Market concentration is moderate, with several major players vying for market share. Technological advancements like AI-driven predictive maintenance and IoT-enabled remote monitoring are key innovation drivers. Stringent environmental regulations regarding water conservation and pollution control further propel market expansion. Competitive substitutes exist but are often less efficient or integrated. End-user demographics, particularly within the utilities and manufacturing sectors, heavily influence market demand. Mergers and acquisitions (M&A) activity is relatively frequent, with approximately xx M&A deals recorded between 2019 and 2024, representing a xx% increase compared to the previous period. This reflects the industry's consolidation and strategic expansion strategies.
- Market Concentration: Moderate, with top 5 players holding approximately xx% market share in 2024.
- Technological Innovation: AI, IoT, and cloud computing are transforming the industry. Barriers to innovation include high R&D costs and legacy system integration challenges.
- Regulatory Landscape: Stringent environmental regulations and safety standards are driving adoption of advanced automation and instrumentation solutions.
- Competitive Substitutes: Less efficient traditional methods pose a challenge, but automation offers superior performance and cost-effectiveness in the long run.
- End-User Demographics: Growing industrialization and urbanization are driving market expansion, particularly in emerging economies.
- M&A Trends: Consolidation through strategic acquisitions is shaping the competitive landscape.
Water Automation and Instrumentation Market Growth Trends & Insights
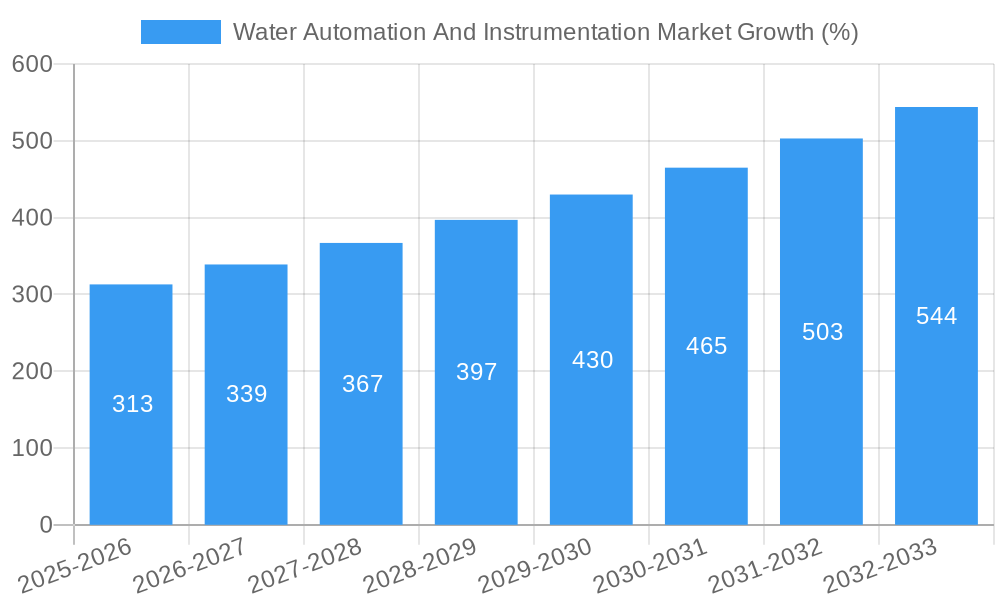
The Water Automation and Instrumentation market demonstrates a robust growth trajectory, projected to reach xx Million units by 2033, exhibiting a CAGR of xx% during the forecast period (2025-2033). This growth is fueled by increasing adoption rates across various end-user industries, driven by the need for improved efficiency, reduced operational costs, and enhanced water quality monitoring. Technological disruptions such as the integration of AI and machine learning are accelerating market penetration. Consumer behavior shifts towards sustainable water management practices are also significant drivers. Market penetration is projected to reach xx% by 2033, up from xx% in 2024, indicating significant untapped potential.
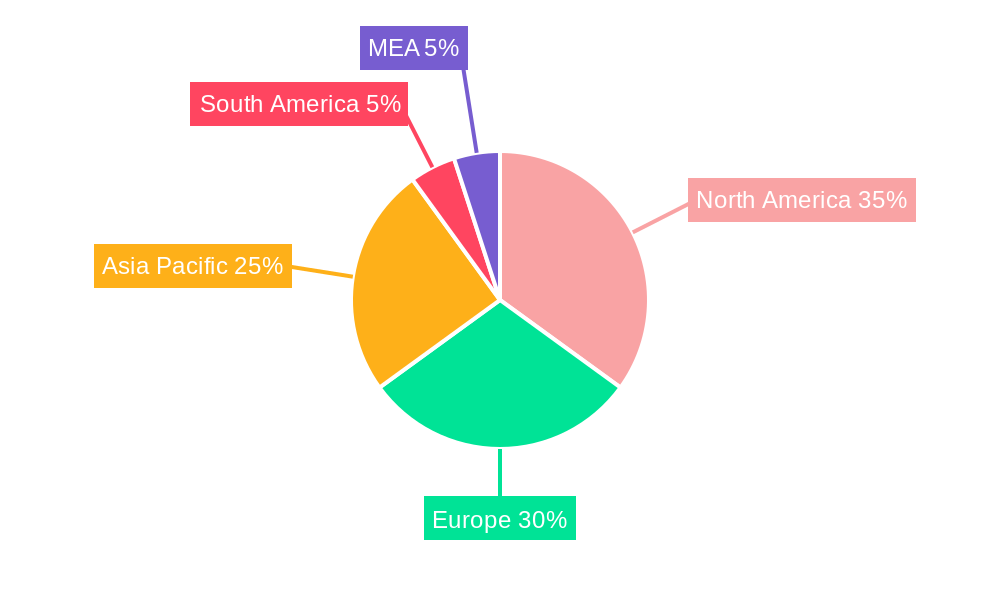
Dominant Regions, Countries, or Segments in Water Automation and Instrumentation Market
North America currently holds the largest market share, followed by Europe and Asia Pacific. The dominance of North America is attributed to advanced infrastructure, high technological adoption rates, and stringent environmental regulations. Within the segments, the Water Automation Solutions segment holds a significant market share with PLC and SCADA systems being dominant technologies. The Utilities and Manufacturing end-user industries are major contributors to overall market growth.
- Key Drivers:
- Stringent environmental regulations in developed regions.
- Investments in water infrastructure modernization projects.
- Growing demand for efficient water resource management in developing regions.
- Increased adoption of advanced analytics and predictive maintenance.
- Dominance Factors:
- North America's advanced infrastructure and technology adoption.
- Europe's focus on sustainable water management practices.
- Asia-Pacific's rapid industrialization and infrastructure development.
Water Automation and Instrumentation Market Product Landscape
The market showcases diverse product innovations, ranging from advanced sensor technologies with improved accuracy and reliability to sophisticated software platforms capable of real-time data analysis and predictive modeling. These advancements enhance operational efficiency, optimize resource allocation, and provide crucial insights for proactive decision-making. Unique selling propositions include enhanced connectivity, interoperability, and ease of integration with existing systems. Technological advancements focus on improving data accuracy, reducing latency, and strengthening cybersecurity measures.
Key Drivers, Barriers & Challenges in Water Automation And Instrumentation Market
Key Drivers:
- Increasing demand for efficient water management in various industries.
- Stringent environmental regulations promoting automation and instrumentation adoption.
- Technological advancements driving innovation and cost reduction.
- Growing investments in water infrastructure development across the globe.
Challenges and Restraints:
- High initial investment costs associated with implementing automation solutions.
- Complexity in integrating new technologies with existing legacy systems.
- Cybersecurity concerns related to connected devices and data security.
- Skilled labor shortage hindering efficient implementation and maintenance.
Emerging Opportunities in Water Automation And Instrumentation Market
- Smart Water Management Systems: Integration of AI and IoT for predictive maintenance and real-time monitoring.
- Water Scarcity Solutions: Development of technologies for efficient water usage and conservation.
- Data Analytics & Predictive Modeling: Leveraging data to optimize water distribution and minimize waste.
- Expansion into Emerging Markets: Capturing opportunities in developing countries with growing water infrastructure needs.
Growth Accelerators in the Water Automation And Instrumentation Market Industry
Technological breakthroughs in sensor technology, advanced analytics, and cloud computing are driving significant market growth. Strategic partnerships between automation providers and water utilities are streamlining the adoption process. Market expansion strategies targeting underserved regions and industries further contribute to long-term growth.
Key Players Shaping the Water Automation and Instrumentation Market Market
- NALCO
- Phoenix Contact
- Endress + Hauser Pvt Ltd
- GE Corporation
- KROHNE LT
- MJK Automation
- Siemens AG
- Schneider Electric SE
- Emerson Electric
- ABB Group
- Rockwell Automation Inc
- Yokogawa Electric Corporation
- Mitsubishi Motors Corporation
- Eurotek India
Notable Milestones in Water Automation And Instrumentation Market Sector
- May 2021: Schneider Electric partnered with Roca Group to accelerate decarbonization efforts in the water sector.
- March 2021: General Electric Company launched enhanced CIMPLICITY and Tracker software for improved operational efficiency in water utilities.
In-Depth Water Automation and Instrumentation Market Outlook
The Water Automation and Instrumentation market is poised for sustained growth, driven by the increasing adoption of smart water management solutions, and expansion into emerging markets. Strategic partnerships and technological advancements will further accelerate market expansion, presenting lucrative opportunities for industry players. The focus on sustainability, efficiency, and data-driven decision-making will continue to shape the market's future trajectory.
Water Automation And Instrumentation Market Segmentation
-
1. Water Automation Solution
- 1.1. DCS
- 1.2. SCADA
- 1.3. PLC
- 1.4. IAM
- 1.5. HMI
- 1.6. Other Water Automation Solutions
-
2. Water Instrumentation Solution
- 2.1. Pressure Transmitter
- 2.2. Level Transmitter
- 2.3. Temperature Transmitter
- 2.4. Liquid Analyzers
- 2.5. Gas Analyzers
- 2.6. Leakage Detection Systems
- 2.7. Flow Sensors/Transmitters
- 2.8. Other Water Instrumentation Solutions
-
3. End-user Industry
- 3.1. Chemical
- 3.2. Manufacturing
- 3.3. Food and Beverages
- 3.4. Utilities
- 3.5. Paper and Pulp
- 3.6. Other End-user Industries
Water Automation And Instrumentation Market Segmentation By Geography
-
1. North America
- 1.1. United States
- 1.2. Canada
-
2. Europe
- 2.1. Germany
- 2.2. United Kingdom
- 2.3. France
- 2.4. Italy
- 2.5. Rest of Europe
-
3. Asia Pacific
- 3.1. Australia
- 3.2. China
- 3.3. Japan
- 3.4. India
- 3.5. Rest of Asia Pacific
- 4. Latin America
-
5. Middle East and Africa
- 5.1. Saudi Arabia
- 5.2. United Arab Emirates
- 5.3. Rest of Middle East and Africa
Water Automation And Instrumentation Market REPORT HIGHLIGHTS
| Aspects | Details |
|---|---|
| Study Period | 2019-2033 |
| Base Year | 2024 |
| Estimated Year | 2025 |
| Forecast Period | 2025-2033 |
| Historical Period | 2019-2024 |
| Growth Rate | CAGR of 7.49% from 2019-2033 |
| Segmentation |
|
Table of Contents
- 1. Introduction
- 1.1. Research Scope
- 1.2. Market Segmentation
- 1.3. Research Methodology
- 1.4. Definitions and Assumptions
- 2. Executive Summary
- 2.1. Introduction
- 3. Market Dynamics
- 3.1. Introduction
- 3.2. Market Drivers
- 3.2.1. Government Regulation to Save Water Resources and Energy; Increase in Adoption of Smart Water Technologies
- 3.3. Market Restrains
- 3.3.1. Lack of Skilled Personnel to Operate Instrumentation
- 3.4. Market Trends
- 3.4.1. Demand from Food and Beverage Industry to Witness a Significant Growth Rate
- 4. Market Factor Analysis
- 4.1. Porters Five Forces
- 4.2. Supply/Value Chain
- 4.3. PESTEL analysis
- 4.4. Market Entropy
- 4.5. Patent/Trademark Analysis
- 5. Global Water Automation And Instrumentation Market Analysis, Insights and Forecast, 2019-2031
- 5.1. Market Analysis, Insights and Forecast - by Water Automation Solution
- 5.1.1. DCS
- 5.1.2. SCADA
- 5.1.3. PLC
- 5.1.4. IAM
- 5.1.5. HMI
- 5.1.6. Other Water Automation Solutions
- 5.2. Market Analysis, Insights and Forecast - by Water Instrumentation Solution
- 5.2.1. Pressure Transmitter
- 5.2.2. Level Transmitter
- 5.2.3. Temperature Transmitter
- 5.2.4. Liquid Analyzers
- 5.2.5. Gas Analyzers
- 5.2.6. Leakage Detection Systems
- 5.2.7. Flow Sensors/Transmitters
- 5.2.8. Other Water Instrumentation Solutions
- 5.3. Market Analysis, Insights and Forecast - by End-user Industry
- 5.3.1. Chemical
- 5.3.2. Manufacturing
- 5.3.3. Food and Beverages
- 5.3.4. Utilities
- 5.3.5. Paper and Pulp
- 5.3.6. Other End-user Industries
- 5.4. Market Analysis, Insights and Forecast - by Region
- 5.4.1. North America
- 5.4.2. Europe
- 5.4.3. Asia Pacific
- 5.4.4. Latin America
- 5.4.5. Middle East and Africa
- 5.1. Market Analysis, Insights and Forecast - by Water Automation Solution
- 6. North America Water Automation And Instrumentation Market Analysis, Insights and Forecast, 2019-2031
- 6.1. Market Analysis, Insights and Forecast - by Water Automation Solution
- 6.1.1. DCS
- 6.1.2. SCADA
- 6.1.3. PLC
- 6.1.4. IAM
- 6.1.5. HMI
- 6.1.6. Other Water Automation Solutions
- 6.2. Market Analysis, Insights and Forecast - by Water Instrumentation Solution
- 6.2.1. Pressure Transmitter
- 6.2.2. Level Transmitter
- 6.2.3. Temperature Transmitter
- 6.2.4. Liquid Analyzers
- 6.2.5. Gas Analyzers
- 6.2.6. Leakage Detection Systems
- 6.2.7. Flow Sensors/Transmitters
- 6.2.8. Other Water Instrumentation Solutions
- 6.3. Market Analysis, Insights and Forecast - by End-user Industry
- 6.3.1. Chemical
- 6.3.2. Manufacturing
- 6.3.3. Food and Beverages
- 6.3.4. Utilities
- 6.3.5. Paper and Pulp
- 6.3.6. Other End-user Industries
- 6.1. Market Analysis, Insights and Forecast - by Water Automation Solution
- 7. Europe Water Automation And Instrumentation Market Analysis, Insights and Forecast, 2019-2031
- 7.1. Market Analysis, Insights and Forecast - by Water Automation Solution
- 7.1.1. DCS
- 7.1.2. SCADA
- 7.1.3. PLC
- 7.1.4. IAM
- 7.1.5. HMI
- 7.1.6. Other Water Automation Solutions
- 7.2. Market Analysis, Insights and Forecast - by Water Instrumentation Solution
- 7.2.1. Pressure Transmitter
- 7.2.2. Level Transmitter
- 7.2.3. Temperature Transmitter
- 7.2.4. Liquid Analyzers
- 7.2.5. Gas Analyzers
- 7.2.6. Leakage Detection Systems
- 7.2.7. Flow Sensors/Transmitters
- 7.2.8. Other Water Instrumentation Solutions
- 7.3. Market Analysis, Insights and Forecast - by End-user Industry
- 7.3.1. Chemical
- 7.3.2. Manufacturing
- 7.3.3. Food and Beverages
- 7.3.4. Utilities
- 7.3.5. Paper and Pulp
- 7.3.6. Other End-user Industries
- 7.1. Market Analysis, Insights and Forecast - by Water Automation Solution
- 8. Asia Pacific Water Automation And Instrumentation Market Analysis, Insights and Forecast, 2019-2031
- 8.1. Market Analysis, Insights and Forecast - by Water Automation Solution
- 8.1.1. DCS
- 8.1.2. SCADA
- 8.1.3. PLC
- 8.1.4. IAM
- 8.1.5. HMI
- 8.1.6. Other Water Automation Solutions
- 8.2. Market Analysis, Insights and Forecast - by Water Instrumentation Solution
- 8.2.1. Pressure Transmitter
- 8.2.2. Level Transmitter
- 8.2.3. Temperature Transmitter
- 8.2.4. Liquid Analyzers
- 8.2.5. Gas Analyzers
- 8.2.6. Leakage Detection Systems
- 8.2.7. Flow Sensors/Transmitters
- 8.2.8. Other Water Instrumentation Solutions
- 8.3. Market Analysis, Insights and Forecast - by End-user Industry
- 8.3.1. Chemical
- 8.3.2. Manufacturing
- 8.3.3. Food and Beverages
- 8.3.4. Utilities
- 8.3.5. Paper and Pulp
- 8.3.6. Other End-user Industries
- 8.1. Market Analysis, Insights and Forecast - by Water Automation Solution
- 9. Latin America Water Automation And Instrumentation Market Analysis, Insights and Forecast, 2019-2031
- 9.1. Market Analysis, Insights and Forecast - by Water Automation Solution
- 9.1.1. DCS
- 9.1.2. SCADA
- 9.1.3. PLC
- 9.1.4. IAM
- 9.1.5. HMI
- 9.1.6. Other Water Automation Solutions
- 9.2. Market Analysis, Insights and Forecast - by Water Instrumentation Solution
- 9.2.1. Pressure Transmitter
- 9.2.2. Level Transmitter
- 9.2.3. Temperature Transmitter
- 9.2.4. Liquid Analyzers
- 9.2.5. Gas Analyzers
- 9.2.6. Leakage Detection Systems
- 9.2.7. Flow Sensors/Transmitters
- 9.2.8. Other Water Instrumentation Solutions
- 9.3. Market Analysis, Insights and Forecast - by End-user Industry
- 9.3.1. Chemical
- 9.3.2. Manufacturing
- 9.3.3. Food and Beverages
- 9.3.4. Utilities
- 9.3.5. Paper and Pulp
- 9.3.6. Other End-user Industries
- 9.1. Market Analysis, Insights and Forecast - by Water Automation Solution
- 10. Middle East and Africa Water Automation And Instrumentation Market Analysis, Insights and Forecast, 2019-2031
- 10.1. Market Analysis, Insights and Forecast - by Water Automation Solution
- 10.1.1. DCS
- 10.1.2. SCADA
- 10.1.3. PLC
- 10.1.4. IAM
- 10.1.5. HMI
- 10.1.6. Other Water Automation Solutions
- 10.2. Market Analysis, Insights and Forecast - by Water Instrumentation Solution
- 10.2.1. Pressure Transmitter
- 10.2.2. Level Transmitter
- 10.2.3. Temperature Transmitter
- 10.2.4. Liquid Analyzers
- 10.2.5. Gas Analyzers
- 10.2.6. Leakage Detection Systems
- 10.2.7. Flow Sensors/Transmitters
- 10.2.8. Other Water Instrumentation Solutions
- 10.3. Market Analysis, Insights and Forecast - by End-user Industry
- 10.3.1. Chemical
- 10.3.2. Manufacturing
- 10.3.3. Food and Beverages
- 10.3.4. Utilities
- 10.3.5. Paper and Pulp
- 10.3.6. Other End-user Industries
- 10.1. Market Analysis, Insights and Forecast - by Water Automation Solution
- 11. North America Water Automation And Instrumentation Market Analysis, Insights and Forecast, 2019-2031
- 11.1. Market Analysis, Insights and Forecast - By Country/Sub-region
- 11.1.1. undefined
- 12. Europe Water Automation And Instrumentation Market Analysis, Insights and Forecast, 2019-2031
- 12.1. Market Analysis, Insights and Forecast - By Country/Sub-region
- 12.1.1. undefined
- 13. Asia Pacific Water Automation And Instrumentation Market Analysis, Insights and Forecast, 2019-2031
- 13.1. Market Analysis, Insights and Forecast - By Country/Sub-region
- 13.1.1. undefined
- 14. South America Water Automation And Instrumentation Market Analysis, Insights and Forecast, 2019-2031
- 14.1. Market Analysis, Insights and Forecast - By Country/Sub-region
- 14.1.1. undefined
- 15. North America Water Automation And Instrumentation Market Analysis, Insights and Forecast, 2019-2031
- 15.1. Market Analysis, Insights and Forecast - By Country/Sub-region
- 15.1.1. undefined
- 16. MEA Water Automation And Instrumentation Market Analysis, Insights and Forecast, 2019-2031
- 16.1. Market Analysis, Insights and Forecast - By Country/Sub-region
- 16.1.1. undefined
- 17. Competitive Analysis
- 17.1. Global Market Share Analysis 2024
- 17.2. Company Profiles
- 17.2.1 NALCO
- 17.2.1.1. Overview
- 17.2.1.2. Products
- 17.2.1.3. SWOT Analysis
- 17.2.1.4. Recent Developments
- 17.2.1.5. Financials (Based on Availability)
- 17.2.2 Phoenix Contact
- 17.2.2.1. Overview
- 17.2.2.2. Products
- 17.2.2.3. SWOT Analysis
- 17.2.2.4. Recent Developments
- 17.2.2.5. Financials (Based on Availability)
- 17.2.3 Endress + Hauser Pvt Ltd
- 17.2.3.1. Overview
- 17.2.3.2. Products
- 17.2.3.3. SWOT Analysis
- 17.2.3.4. Recent Developments
- 17.2.3.5. Financials (Based on Availability)
- 17.2.4 GE Corporation
- 17.2.4.1. Overview
- 17.2.4.2. Products
- 17.2.4.3. SWOT Analysis
- 17.2.4.4. Recent Developments
- 17.2.4.5. Financials (Based on Availability)
- 17.2.5 KROHNE LT
- 17.2.5.1. Overview
- 17.2.5.2. Products
- 17.2.5.3. SWOT Analysis
- 17.2.5.4. Recent Developments
- 17.2.5.5. Financials (Based on Availability)
- 17.2.6 MJK Automation
- 17.2.6.1. Overview
- 17.2.6.2. Products
- 17.2.6.3. SWOT Analysis
- 17.2.6.4. Recent Developments
- 17.2.6.5. Financials (Based on Availability)
- 17.2.7 Siemens AG
- 17.2.7.1. Overview
- 17.2.7.2. Products
- 17.2.7.3. SWOT Analysis
- 17.2.7.4. Recent Developments
- 17.2.7.5. Financials (Based on Availability)
- 17.2.8 Schneider Electric SE
- 17.2.8.1. Overview
- 17.2.8.2. Products
- 17.2.8.3. SWOT Analysis
- 17.2.8.4. Recent Developments
- 17.2.8.5. Financials (Based on Availability)
- 17.2.9 Emerson Electric
- 17.2.9.1. Overview
- 17.2.9.2. Products
- 17.2.9.3. SWOT Analysis
- 17.2.9.4. Recent Developments
- 17.2.9.5. Financials (Based on Availability)
- 17.2.10 ABB Group
- 17.2.10.1. Overview
- 17.2.10.2. Products
- 17.2.10.3. SWOT Analysis
- 17.2.10.4. Recent Developments
- 17.2.10.5. Financials (Based on Availability)
- 17.2.11 Rockwell Automation Inc
- 17.2.11.1. Overview
- 17.2.11.2. Products
- 17.2.11.3. SWOT Analysis
- 17.2.11.4. Recent Developments
- 17.2.11.5. Financials (Based on Availability)
- 17.2.12 Yokogawa Electric Corporation
- 17.2.12.1. Overview
- 17.2.12.2. Products
- 17.2.12.3. SWOT Analysis
- 17.2.12.4. Recent Developments
- 17.2.12.5. Financials (Based on Availability)
- 17.2.13 Mitsubishi Motors Corporation
- 17.2.13.1. Overview
- 17.2.13.2. Products
- 17.2.13.3. SWOT Analysis
- 17.2.13.4. Recent Developments
- 17.2.13.5. Financials (Based on Availability)
- 17.2.14 Eurotek India
- 17.2.14.1. Overview
- 17.2.14.2. Products
- 17.2.14.3. SWOT Analysis
- 17.2.14.4. Recent Developments
- 17.2.14.5. Financials (Based on Availability)
- 17.2.1 NALCO
List of Figures
- Figure 1: Global Water Automation And Instrumentation Market Revenue Breakdown (Million, %) by Region 2024 & 2032
- Figure 2: Global Water Automation And Instrumentation Market Volume Breakdown (K Unit, %) by Region 2024 & 2032
- Figure 3: North America Water Automation And Instrumentation Market Revenue (Million), by Country 2024 & 2032
- Figure 4: North America Water Automation And Instrumentation Market Volume (K Unit), by Country 2024 & 2032
- Figure 5: North America Water Automation And Instrumentation Market Revenue Share (%), by Country 2024 & 2032
- Figure 6: North America Water Automation And Instrumentation Market Volume Share (%), by Country 2024 & 2032
- Figure 7: Europe Water Automation And Instrumentation Market Revenue (Million), by Country 2024 & 2032
- Figure 8: Europe Water Automation And Instrumentation Market Volume (K Unit), by Country 2024 & 2032
- Figure 9: Europe Water Automation And Instrumentation Market Revenue Share (%), by Country 2024 & 2032
- Figure 10: Europe Water Automation And Instrumentation Market Volume Share (%), by Country 2024 & 2032
- Figure 11: Asia Pacific Water Automation And Instrumentation Market Revenue (Million), by Country 2024 & 2032
- Figure 12: Asia Pacific Water Automation And Instrumentation Market Volume (K Unit), by Country 2024 & 2032
- Figure 13: Asia Pacific Water Automation And Instrumentation Market Revenue Share (%), by Country 2024 & 2032
- Figure 14: Asia Pacific Water Automation And Instrumentation Market Volume Share (%), by Country 2024 & 2032
- Figure 15: South America Water Automation And Instrumentation Market Revenue (Million), by Country 2024 & 2032
- Figure 16: South America Water Automation And Instrumentation Market Volume (K Unit), by Country 2024 & 2032
- Figure 17: South America Water Automation And Instrumentation Market Revenue Share (%), by Country 2024 & 2032
- Figure 18: South America Water Automation And Instrumentation Market Volume Share (%), by Country 2024 & 2032
- Figure 19: North America Water Automation And Instrumentation Market Revenue (Million), by Country 2024 & 2032
- Figure 20: North America Water Automation And Instrumentation Market Volume (K Unit), by Country 2024 & 2032
- Figure 21: North America Water Automation And Instrumentation Market Revenue Share (%), by Country 2024 & 2032
- Figure 22: North America Water Automation And Instrumentation Market Volume Share (%), by Country 2024 & 2032
- Figure 23: MEA Water Automation And Instrumentation Market Revenue (Million), by Country 2024 & 2032
- Figure 24: MEA Water Automation And Instrumentation Market Volume (K Unit), by Country 2024 & 2032
- Figure 25: MEA Water Automation And Instrumentation Market Revenue Share (%), by Country 2024 & 2032
- Figure 26: MEA Water Automation And Instrumentation Market Volume Share (%), by Country 2024 & 2032
- Figure 27: North America Water Automation And Instrumentation Market Revenue (Million), by Water Automation Solution 2024 & 2032
- Figure 28: North America Water Automation And Instrumentation Market Volume (K Unit), by Water Automation Solution 2024 & 2032
- Figure 29: North America Water Automation And Instrumentation Market Revenue Share (%), by Water Automation Solution 2024 & 2032
- Figure 30: North America Water Automation And Instrumentation Market Volume Share (%), by Water Automation Solution 2024 & 2032
- Figure 31: North America Water Automation And Instrumentation Market Revenue (Million), by Water Instrumentation Solution 2024 & 2032
- Figure 32: North America Water Automation And Instrumentation Market Volume (K Unit), by Water Instrumentation Solution 2024 & 2032
- Figure 33: North America Water Automation And Instrumentation Market Revenue Share (%), by Water Instrumentation Solution 2024 & 2032
- Figure 34: North America Water Automation And Instrumentation Market Volume Share (%), by Water Instrumentation Solution 2024 & 2032
- Figure 35: North America Water Automation And Instrumentation Market Revenue (Million), by End-user Industry 2024 & 2032
- Figure 36: North America Water Automation And Instrumentation Market Volume (K Unit), by End-user Industry 2024 & 2032
- Figure 37: North America Water Automation And Instrumentation Market Revenue Share (%), by End-user Industry 2024 & 2032
- Figure 38: North America Water Automation And Instrumentation Market Volume Share (%), by End-user Industry 2024 & 2032
- Figure 39: North America Water Automation And Instrumentation Market Revenue (Million), by Country 2024 & 2032
- Figure 40: North America Water Automation And Instrumentation Market Volume (K Unit), by Country 2024 & 2032
- Figure 41: North America Water Automation And Instrumentation Market Revenue Share (%), by Country 2024 & 2032
- Figure 42: North America Water Automation And Instrumentation Market Volume Share (%), by Country 2024 & 2032
- Figure 43: Europe Water Automation And Instrumentation Market Revenue (Million), by Water Automation Solution 2024 & 2032
- Figure 44: Europe Water Automation And Instrumentation Market Volume (K Unit), by Water Automation Solution 2024 & 2032
- Figure 45: Europe Water Automation And Instrumentation Market Revenue Share (%), by Water Automation Solution 2024 & 2032
- Figure 46: Europe Water Automation And Instrumentation Market Volume Share (%), by Water Automation Solution 2024 & 2032
- Figure 47: Europe Water Automation And Instrumentation Market Revenue (Million), by Water Instrumentation Solution 2024 & 2032
- Figure 48: Europe Water Automation And Instrumentation Market Volume (K Unit), by Water Instrumentation Solution 2024 & 2032
- Figure 49: Europe Water Automation And Instrumentation Market Revenue Share (%), by Water Instrumentation Solution 2024 & 2032
- Figure 50: Europe Water Automation And Instrumentation Market Volume Share (%), by Water Instrumentation Solution 2024 & 2032
- Figure 51: Europe Water Automation And Instrumentation Market Revenue (Million), by End-user Industry 2024 & 2032
- Figure 52: Europe Water Automation And Instrumentation Market Volume (K Unit), by End-user Industry 2024 & 2032
- Figure 53: Europe Water Automation And Instrumentation Market Revenue Share (%), by End-user Industry 2024 & 2032
- Figure 54: Europe Water Automation And Instrumentation Market Volume Share (%), by End-user Industry 2024 & 2032
- Figure 55: Europe Water Automation And Instrumentation Market Revenue (Million), by Country 2024 & 2032
- Figure 56: Europe Water Automation And Instrumentation Market Volume (K Unit), by Country 2024 & 2032
- Figure 57: Europe Water Automation And Instrumentation Market Revenue Share (%), by Country 2024 & 2032
- Figure 58: Europe Water Automation And Instrumentation Market Volume Share (%), by Country 2024 & 2032
- Figure 59: Asia Pacific Water Automation And Instrumentation Market Revenue (Million), by Water Automation Solution 2024 & 2032
- Figure 60: Asia Pacific Water Automation And Instrumentation Market Volume (K Unit), by Water Automation Solution 2024 & 2032
- Figure 61: Asia Pacific Water Automation And Instrumentation Market Revenue Share (%), by Water Automation Solution 2024 & 2032
- Figure 62: Asia Pacific Water Automation And Instrumentation Market Volume Share (%), by Water Automation Solution 2024 & 2032
- Figure 63: Asia Pacific Water Automation And Instrumentation Market Revenue (Million), by Water Instrumentation Solution 2024 & 2032
- Figure 64: Asia Pacific Water Automation And Instrumentation Market Volume (K Unit), by Water Instrumentation Solution 2024 & 2032
- Figure 65: Asia Pacific Water Automation And Instrumentation Market Revenue Share (%), by Water Instrumentation Solution 2024 & 2032
- Figure 66: Asia Pacific Water Automation And Instrumentation Market Volume Share (%), by Water Instrumentation Solution 2024 & 2032
- Figure 67: Asia Pacific Water Automation And Instrumentation Market Revenue (Million), by End-user Industry 2024 & 2032
- Figure 68: Asia Pacific Water Automation And Instrumentation Market Volume (K Unit), by End-user Industry 2024 & 2032
- Figure 69: Asia Pacific Water Automation And Instrumentation Market Revenue Share (%), by End-user Industry 2024 & 2032
- Figure 70: Asia Pacific Water Automation And Instrumentation Market Volume Share (%), by End-user Industry 2024 & 2032
- Figure 71: Asia Pacific Water Automation And Instrumentation Market Revenue (Million), by Country 2024 & 2032
- Figure 72: Asia Pacific Water Automation And Instrumentation Market Volume (K Unit), by Country 2024 & 2032
- Figure 73: Asia Pacific Water Automation And Instrumentation Market Revenue Share (%), by Country 2024 & 2032
- Figure 74: Asia Pacific Water Automation And Instrumentation Market Volume Share (%), by Country 2024 & 2032
- Figure 75: Latin America Water Automation And Instrumentation Market Revenue (Million), by Water Automation Solution 2024 & 2032
- Figure 76: Latin America Water Automation And Instrumentation Market Volume (K Unit), by Water Automation Solution 2024 & 2032
- Figure 77: Latin America Water Automation And Instrumentation Market Revenue Share (%), by Water Automation Solution 2024 & 2032
- Figure 78: Latin America Water Automation And Instrumentation Market Volume Share (%), by Water Automation Solution 2024 & 2032
- Figure 79: Latin America Water Automation And Instrumentation Market Revenue (Million), by Water Instrumentation Solution 2024 & 2032
- Figure 80: Latin America Water Automation And Instrumentation Market Volume (K Unit), by Water Instrumentation Solution 2024 & 2032
- Figure 81: Latin America Water Automation And Instrumentation Market Revenue Share (%), by Water Instrumentation Solution 2024 & 2032
- Figure 82: Latin America Water Automation And Instrumentation Market Volume Share (%), by Water Instrumentation Solution 2024 & 2032
- Figure 83: Latin America Water Automation And Instrumentation Market Revenue (Million), by End-user Industry 2024 & 2032
- Figure 84: Latin America Water Automation And Instrumentation Market Volume (K Unit), by End-user Industry 2024 & 2032
- Figure 85: Latin America Water Automation And Instrumentation Market Revenue Share (%), by End-user Industry 2024 & 2032
- Figure 86: Latin America Water Automation And Instrumentation Market Volume Share (%), by End-user Industry 2024 & 2032
- Figure 87: Latin America Water Automation And Instrumentation Market Revenue (Million), by Country 2024 & 2032
- Figure 88: Latin America Water Automation And Instrumentation Market Volume (K Unit), by Country 2024 & 2032
- Figure 89: Latin America Water Automation And Instrumentation Market Revenue Share (%), by Country 2024 & 2032
- Figure 90: Latin America Water Automation And Instrumentation Market Volume Share (%), by Country 2024 & 2032
- Figure 91: Middle East and Africa Water Automation And Instrumentation Market Revenue (Million), by Water Automation Solution 2024 & 2032
- Figure 92: Middle East and Africa Water Automation And Instrumentation Market Volume (K Unit), by Water Automation Solution 2024 & 2032
- Figure 93: Middle East and Africa Water Automation And Instrumentation Market Revenue Share (%), by Water Automation Solution 2024 & 2032
- Figure 94: Middle East and Africa Water Automation And Instrumentation Market Volume Share (%), by Water Automation Solution 2024 & 2032
- Figure 95: Middle East and Africa Water Automation And Instrumentation Market Revenue (Million), by Water Instrumentation Solution 2024 & 2032
- Figure 96: Middle East and Africa Water Automation And Instrumentation Market Volume (K Unit), by Water Instrumentation Solution 2024 & 2032
- Figure 97: Middle East and Africa Water Automation And Instrumentation Market Revenue Share (%), by Water Instrumentation Solution 2024 & 2032
- Figure 98: Middle East and Africa Water Automation And Instrumentation Market Volume Share (%), by Water Instrumentation Solution 2024 & 2032
- Figure 99: Middle East and Africa Water Automation And Instrumentation Market Revenue (Million), by End-user Industry 2024 & 2032
- Figure 100: Middle East and Africa Water Automation And Instrumentation Market Volume (K Unit), by End-user Industry 2024 & 2032
- Figure 101: Middle East and Africa Water Automation And Instrumentation Market Revenue Share (%), by End-user Industry 2024 & 2032
- Figure 102: Middle East and Africa Water Automation And Instrumentation Market Volume Share (%), by End-user Industry 2024 & 2032
- Figure 103: Middle East and Africa Water Automation And Instrumentation Market Revenue (Million), by Country 2024 & 2032
- Figure 104: Middle East and Africa Water Automation And Instrumentation Market Volume (K Unit), by Country 2024 & 2032
- Figure 105: Middle East and Africa Water Automation And Instrumentation Market Revenue Share (%), by Country 2024 & 2032
- Figure 106: Middle East and Africa Water Automation And Instrumentation Market Volume Share (%), by Country 2024 & 2032
List of Tables
- Table 1: Global Water Automation And Instrumentation Market Revenue Million Forecast, by Region 2019 & 2032
- Table 2: Global Water Automation And Instrumentation Market Volume K Unit Forecast, by Region 2019 & 2032
- Table 3: Global Water Automation And Instrumentation Market Revenue Million Forecast, by Water Automation Solution 2019 & 2032
- Table 4: Global Water Automation And Instrumentation Market Volume K Unit Forecast, by Water Automation Solution 2019 & 2032
- Table 5: Global Water Automation And Instrumentation Market Revenue Million Forecast, by Water Instrumentation Solution 2019 & 2032
- Table 6: Global Water Automation And Instrumentation Market Volume K Unit Forecast, by Water Instrumentation Solution 2019 & 2032
- Table 7: Global Water Automation And Instrumentation Market Revenue Million Forecast, by End-user Industry 2019 & 2032
- Table 8: Global Water Automation And Instrumentation Market Volume K Unit Forecast, by End-user Industry 2019 & 2032
- Table 9: Global Water Automation And Instrumentation Market Revenue Million Forecast, by Region 2019 & 2032
- Table 10: Global Water Automation And Instrumentation Market Volume K Unit Forecast, by Region 2019 & 2032
- Table 11: Global Water Automation And Instrumentation Market Revenue Million Forecast, by Country 2019 & 2032
- Table 12: Global Water Automation And Instrumentation Market Volume K Unit Forecast, by Country 2019 & 2032
- Table 13: Global Water Automation And Instrumentation Market Revenue Million Forecast, by Country 2019 & 2032
- Table 14: Global Water Automation And Instrumentation Market Volume K Unit Forecast, by Country 2019 & 2032
- Table 15: Global Water Automation And Instrumentation Market Revenue Million Forecast, by Country 2019 & 2032
- Table 16: Global Water Automation And Instrumentation Market Volume K Unit Forecast, by Country 2019 & 2032
- Table 17: Global Water Automation And Instrumentation Market Revenue Million Forecast, by Country 2019 & 2032
- Table 18: Global Water Automation And Instrumentation Market Volume K Unit Forecast, by Country 2019 & 2032
- Table 19: Global Water Automation And Instrumentation Market Revenue Million Forecast, by Country 2019 & 2032
- Table 20: Global Water Automation And Instrumentation Market Volume K Unit Forecast, by Country 2019 & 2032
- Table 21: Global Water Automation And Instrumentation Market Revenue Million Forecast, by Country 2019 & 2032
- Table 22: Global Water Automation And Instrumentation Market Volume K Unit Forecast, by Country 2019 & 2032
- Table 23: Global Water Automation And Instrumentation Market Revenue Million Forecast, by Water Automation Solution 2019 & 2032
- Table 24: Global Water Automation And Instrumentation Market Volume K Unit Forecast, by Water Automation Solution 2019 & 2032
- Table 25: Global Water Automation And Instrumentation Market Revenue Million Forecast, by Water Instrumentation Solution 2019 & 2032
- Table 26: Global Water Automation And Instrumentation Market Volume K Unit Forecast, by Water Instrumentation Solution 2019 & 2032
- Table 27: Global Water Automation And Instrumentation Market Revenue Million Forecast, by End-user Industry 2019 & 2032
- Table 28: Global Water Automation And Instrumentation Market Volume K Unit Forecast, by End-user Industry 2019 & 2032
- Table 29: Global Water Automation And Instrumentation Market Revenue Million Forecast, by Country 2019 & 2032
- Table 30: Global Water Automation And Instrumentation Market Volume K Unit Forecast, by Country 2019 & 2032
- Table 31: United States Water Automation And Instrumentation Market Revenue (Million) Forecast, by Application 2019 & 2032
- Table 32: United States Water Automation And Instrumentation Market Volume (K Unit) Forecast, by Application 2019 & 2032
- Table 33: Canada Water Automation And Instrumentation Market Revenue (Million) Forecast, by Application 2019 & 2032
- Table 34: Canada Water Automation And Instrumentation Market Volume (K Unit) Forecast, by Application 2019 & 2032
- Table 35: Global Water Automation And Instrumentation Market Revenue Million Forecast, by Water Automation Solution 2019 & 2032
- Table 36: Global Water Automation And Instrumentation Market Volume K Unit Forecast, by Water Automation Solution 2019 & 2032
- Table 37: Global Water Automation And Instrumentation Market Revenue Million Forecast, by Water Instrumentation Solution 2019 & 2032
- Table 38: Global Water Automation And Instrumentation Market Volume K Unit Forecast, by Water Instrumentation Solution 2019 & 2032
- Table 39: Global Water Automation And Instrumentation Market Revenue Million Forecast, by End-user Industry 2019 & 2032
- Table 40: Global Water Automation And Instrumentation Market Volume K Unit Forecast, by End-user Industry 2019 & 2032
- Table 41: Global Water Automation And Instrumentation Market Revenue Million Forecast, by Country 2019 & 2032
- Table 42: Global Water Automation And Instrumentation Market Volume K Unit Forecast, by Country 2019 & 2032
- Table 43: Germany Water Automation And Instrumentation Market Revenue (Million) Forecast, by Application 2019 & 2032
- Table 44: Germany Water Automation And Instrumentation Market Volume (K Unit) Forecast, by Application 2019 & 2032
- Table 45: United Kingdom Water Automation And Instrumentation Market Revenue (Million) Forecast, by Application 2019 & 2032
- Table 46: United Kingdom Water Automation And Instrumentation Market Volume (K Unit) Forecast, by Application 2019 & 2032
- Table 47: France Water Automation And Instrumentation Market Revenue (Million) Forecast, by Application 2019 & 2032
- Table 48: France Water Automation And Instrumentation Market Volume (K Unit) Forecast, by Application 2019 & 2032
- Table 49: Italy Water Automation And Instrumentation Market Revenue (Million) Forecast, by Application 2019 & 2032
- Table 50: Italy Water Automation And Instrumentation Market Volume (K Unit) Forecast, by Application 2019 & 2032
- Table 51: Rest of Europe Water Automation And Instrumentation Market Revenue (Million) Forecast, by Application 2019 & 2032
- Table 52: Rest of Europe Water Automation And Instrumentation Market Volume (K Unit) Forecast, by Application 2019 & 2032
- Table 53: Global Water Automation And Instrumentation Market Revenue Million Forecast, by Water Automation Solution 2019 & 2032
- Table 54: Global Water Automation And Instrumentation Market Volume K Unit Forecast, by Water Automation Solution 2019 & 2032
- Table 55: Global Water Automation And Instrumentation Market Revenue Million Forecast, by Water Instrumentation Solution 2019 & 2032
- Table 56: Global Water Automation And Instrumentation Market Volume K Unit Forecast, by Water Instrumentation Solution 2019 & 2032
- Table 57: Global Water Automation And Instrumentation Market Revenue Million Forecast, by End-user Industry 2019 & 2032
- Table 58: Global Water Automation And Instrumentation Market Volume K Unit Forecast, by End-user Industry 2019 & 2032
- Table 59: Global Water Automation And Instrumentation Market Revenue Million Forecast, by Country 2019 & 2032
- Table 60: Global Water Automation And Instrumentation Market Volume K Unit Forecast, by Country 2019 & 2032
- Table 61: Australia Water Automation And Instrumentation Market Revenue (Million) Forecast, by Application 2019 & 2032
- Table 62: Australia Water Automation And Instrumentation Market Volume (K Unit) Forecast, by Application 2019 & 2032
- Table 63: China Water Automation And Instrumentation Market Revenue (Million) Forecast, by Application 2019 & 2032
- Table 64: China Water Automation And Instrumentation Market Volume (K Unit) Forecast, by Application 2019 & 2032
- Table 65: Japan Water Automation And Instrumentation Market Revenue (Million) Forecast, by Application 2019 & 2032
- Table 66: Japan Water Automation And Instrumentation Market Volume (K Unit) Forecast, by Application 2019 & 2032
- Table 67: India Water Automation And Instrumentation Market Revenue (Million) Forecast, by Application 2019 & 2032
- Table 68: India Water Automation And Instrumentation Market Volume (K Unit) Forecast, by Application 2019 & 2032
- Table 69: Rest of Asia Pacific Water Automation And Instrumentation Market Revenue (Million) Forecast, by Application 2019 & 2032
- Table 70: Rest of Asia Pacific Water Automation And Instrumentation Market Volume (K Unit) Forecast, by Application 2019 & 2032
- Table 71: Global Water Automation And Instrumentation Market Revenue Million Forecast, by Water Automation Solution 2019 & 2032
- Table 72: Global Water Automation And Instrumentation Market Volume K Unit Forecast, by Water Automation Solution 2019 & 2032
- Table 73: Global Water Automation And Instrumentation Market Revenue Million Forecast, by Water Instrumentation Solution 2019 & 2032
- Table 74: Global Water Automation And Instrumentation Market Volume K Unit Forecast, by Water Instrumentation Solution 2019 & 2032
- Table 75: Global Water Automation And Instrumentation Market Revenue Million Forecast, by End-user Industry 2019 & 2032
- Table 76: Global Water Automation And Instrumentation Market Volume K Unit Forecast, by End-user Industry 2019 & 2032
- Table 77: Global Water Automation And Instrumentation Market Revenue Million Forecast, by Country 2019 & 2032
- Table 78: Global Water Automation And Instrumentation Market Volume K Unit Forecast, by Country 2019 & 2032
- Table 79: Global Water Automation And Instrumentation Market Revenue Million Forecast, by Water Automation Solution 2019 & 2032
- Table 80: Global Water Automation And Instrumentation Market Volume K Unit Forecast, by Water Automation Solution 2019 & 2032
- Table 81: Global Water Automation And Instrumentation Market Revenue Million Forecast, by Water Instrumentation Solution 2019 & 2032
- Table 82: Global Water Automation And Instrumentation Market Volume K Unit Forecast, by Water Instrumentation Solution 2019 & 2032
- Table 83: Global Water Automation And Instrumentation Market Revenue Million Forecast, by End-user Industry 2019 & 2032
- Table 84: Global Water Automation And Instrumentation Market Volume K Unit Forecast, by End-user Industry 2019 & 2032
- Table 85: Global Water Automation And Instrumentation Market Revenue Million Forecast, by Country 2019 & 2032
- Table 86: Global Water Automation And Instrumentation Market Volume K Unit Forecast, by Country 2019 & 2032
- Table 87: Saudi Arabia Water Automation And Instrumentation Market Revenue (Million) Forecast, by Application 2019 & 2032
- Table 88: Saudi Arabia Water Automation And Instrumentation Market Volume (K Unit) Forecast, by Application 2019 & 2032
- Table 89: United Arab Emirates Water Automation And Instrumentation Market Revenue (Million) Forecast, by Application 2019 & 2032
- Table 90: United Arab Emirates Water Automation And Instrumentation Market Volume (K Unit) Forecast, by Application 2019 & 2032
- Table 91: Rest of Middle East and Africa Water Automation And Instrumentation Market Revenue (Million) Forecast, by Application 2019 & 2032
- Table 92: Rest of Middle East and Africa Water Automation And Instrumentation Market Volume (K Unit) Forecast, by Application 2019 & 2032
Frequently Asked Questions
1. What is the projected Compound Annual Growth Rate (CAGR) of the Water Automation And Instrumentation Market?
The projected CAGR is approximately 7.49%.
2. Which companies are prominent players in the Water Automation And Instrumentation Market?
Key companies in the market include NALCO, Phoenix Contact, Endress + Hauser Pvt Ltd, GE Corporation, KROHNE LT, MJK Automation, Siemens AG, Schneider Electric SE, Emerson Electric, ABB Group, Rockwell Automation Inc, Yokogawa Electric Corporation, Mitsubishi Motors Corporation, Eurotek India.
3. What are the main segments of the Water Automation And Instrumentation Market?
The market segments include Water Automation Solution, Water Instrumentation Solution, End-user Industry.
4. Can you provide details about the market size?
The market size is estimated to be USD 4.12 Million as of 2022.
5. What are some drivers contributing to market growth?
Government Regulation to Save Water Resources and Energy; Increase in Adoption of Smart Water Technologies.
6. What are the notable trends driving market growth?
Demand from Food and Beverage Industry to Witness a Significant Growth Rate.
7. Are there any restraints impacting market growth?
Lack of Skilled Personnel to Operate Instrumentation.
8. Can you provide examples of recent developments in the market?
May 2021 - Schneider Electric partnered with Roca Group to accelerate decarbonization. Roca Group, a world leader in the design, production, and commercialization of products, defines a new roadmap toward decarbonization, establishing a single, global strategy across the Group.
9. What pricing options are available for accessing the report?
Pricing options include single-user, multi-user, and enterprise licenses priced at USD 4750, USD 5250, and USD 8750 respectively.
10. Is the market size provided in terms of value or volume?
The market size is provided in terms of value, measured in Million and volume, measured in K Unit.
11. Are there any specific market keywords associated with the report?
Yes, the market keyword associated with the report is "Water Automation And Instrumentation Market," which aids in identifying and referencing the specific market segment covered.
12. How do I determine which pricing option suits my needs best?
The pricing options vary based on user requirements and access needs. Individual users may opt for single-user licenses, while businesses requiring broader access may choose multi-user or enterprise licenses for cost-effective access to the report.
13. Are there any additional resources or data provided in the Water Automation And Instrumentation Market report?
While the report offers comprehensive insights, it's advisable to review the specific contents or supplementary materials provided to ascertain if additional resources or data are available.
14. How can I stay updated on further developments or reports in the Water Automation And Instrumentation Market?
To stay informed about further developments, trends, and reports in the Water Automation And Instrumentation Market, consider subscribing to industry newsletters, following relevant companies and organizations, or regularly checking reputable industry news sources and publications.
Methodology
Step 1 - Identification of Relevant Samples Size from Population Database


Step 2 - Approaches for Defining Global Market Size (Value, Volume* & Price*)

Note*: In applicable scenarios
Step 3 - Data Sources
Primary Research
- Web Analytics
- Survey Reports
- Research Institute
- Latest Research Reports
- Opinion Leaders
Secondary Research
- Annual Reports
- White Paper
- Latest Press Release
- Industry Association
- Paid Database
- Investor Presentations

Step 4 - Data Triangulation
Involves using different sources of information in order to increase the validity of a study
These sources are likely to be stakeholders in a program - participants, other researchers, program staff, other community members, and so on.
Then we put all data in single framework & apply various statistical tools to find out the dynamic on the market.
During the analysis stage, feedback from the stakeholder groups would be compared to determine areas of agreement as well as areas of divergence


