
Key Insights
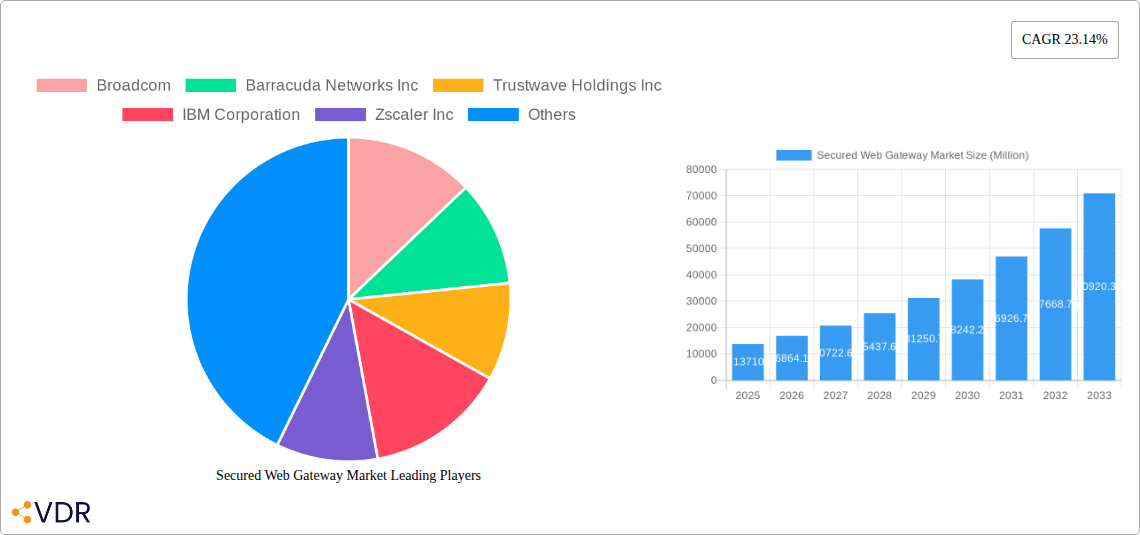
The Secured Web Gateway (SWG) market is experiencing robust growth, projected to reach a substantial size, driven by the escalating need for robust cybersecurity solutions in an increasingly interconnected world. The market's Compound Annual Growth Rate (CAGR) of 23.14% from 2019 to 2024 indicates significant expansion, fueled by factors such as the rising adoption of cloud-based applications, the proliferation of remote work environments, and the persistent threat of sophisticated cyberattacks targeting businesses and government entities across various sectors. The BFSI, healthcare, and manufacturing industries are key drivers, demanding advanced security measures to protect sensitive data and maintain operational continuity. The growing adoption of cloud-based SWGs simplifies deployment and management, while the increasing sophistication of threat vectors fuels demand for solutions offering advanced threat protection, such as AI-powered malware detection and URL filtering. The market segmentation highlights strong demand across all organization sizes, with large organizations driving a significant portion of the market revenue due to their more complex security needs. Competitive forces are intense, with established players like Broadcom, Fortinet, and Cisco competing with emerging players who leverage innovative technologies.
The market's future growth will depend on several factors, including advancements in artificial intelligence and machine learning for threat detection, the continued shift to cloud-based deployments, and the growing awareness of cybersecurity threats among organizations. The increasing adoption of secure access service edge (SASE) architectures, which integrate SWG capabilities with other network security functions, will further shape the market landscape. Geographical expansion, particularly in regions with rapidly developing digital infrastructures like Asia-Pacific, will also contribute to market growth. However, challenges such as the complexity of integrating SWGs with existing security infrastructure, and the increasing costs associated with advanced security features, represent potential restraints. Nevertheless, the overall outlook remains positive, with sustained growth anticipated throughout the forecast period (2025-2033), owing to the undeniable necessity for robust web security in a rapidly evolving digital environment.
Secured Web Gateway Market Report: A Comprehensive Analysis (2019-2033)
This comprehensive report provides an in-depth analysis of the Secured Web Gateway market, encompassing market dynamics, growth trends, regional dominance, product landscape, key players, and future outlook. The study period spans 2019-2033, with 2025 serving as the base and estimated year. The forecast period is 2025-2033, and the historical period covers 2019-2024. The market is segmented by component (solutions, services), organization size (large, small & medium), deployment (cloud, on-premise), and end-user (BFSI, healthcare, manufacturing, government & defense, IT & telecommunication, other). Market values are presented in million units.
Secured Web Gateway Market Dynamics & Structure
The Secured Web Gateway market is experiencing robust growth, driven by the increasing adoption of cloud computing, the rise of remote work, and the escalating threat landscape. Market concentration is moderate, with several key players holding significant shares, but a fragmented landscape overall. Technological innovation, particularly in areas like AI-powered threat detection and SASE (Secure Access Service Edge), is a primary growth driver. Stringent regulatory frameworks, such as GDPR and CCPA, are also influencing market dynamics, demanding enhanced security measures. Competitive substitutes include traditional firewalls and VPNs, but the integrated security capabilities of secured web gateways are driving adoption. M&A activity is relatively frequent, with larger players acquiring smaller firms to expand their portfolios and enhance technological capabilities.
- Market Concentration: Moderately concentrated, with top 5 players holding approximately xx% market share (2024).
- Technological Innovation: AI-powered threat detection, SASE integration, and improved user experience are key drivers.
- Regulatory Frameworks: GDPR, CCPA, and other data privacy regulations are influencing market adoption.
- Competitive Substitutes: Traditional firewalls and VPNs pose a competitive challenge.
- M&A Activity: xx major M&A deals in the last 5 years, driven by expansion strategies.
- End-User Demographics: Increasing adoption across all segments, with BFSI and Government & Defense showing particularly high growth potential.
- Innovation Barriers: High initial investment costs and a skills gap in managing advanced security solutions can present hurdles.
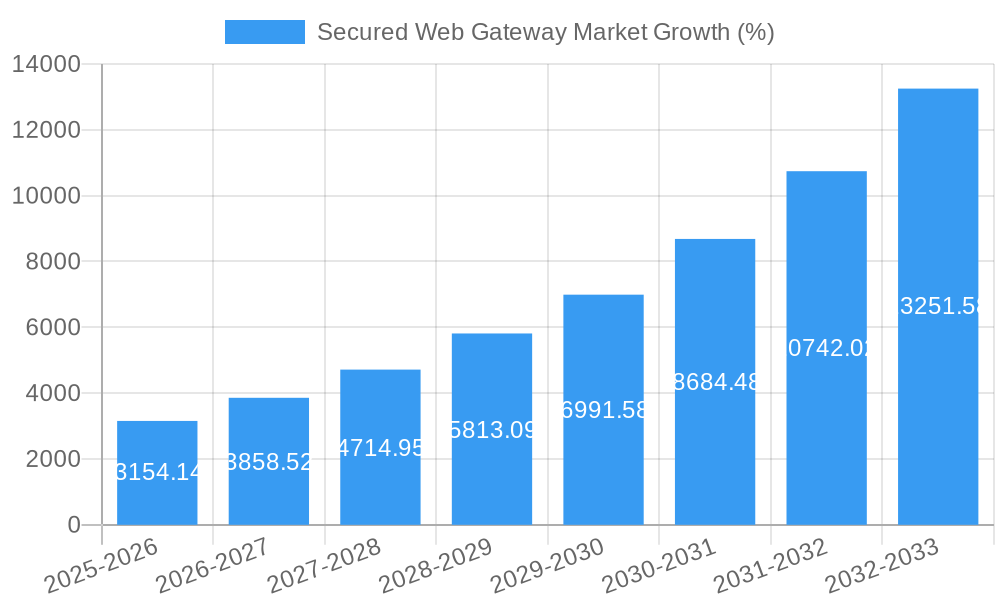
Secured Web Gateway Market Growth Trends & Insights
The Secured Web Gateway market exhibits a significant Compound Annual Growth Rate (CAGR) of xx% during the forecast period (2025-2033). Market size is projected to reach xx million by 2033, driven by several factors. The widespread adoption of cloud-based solutions is a major catalyst, alongside rising cybersecurity concerns among organizations of all sizes. Technological disruptions, such as the rise of SASE, are shaping the market landscape, leading to increased adoption rates. Consumer behavior shifts, including the widespread adoption of remote work and BYOD (Bring Your Own Device) policies, are also contributing to market growth. Market penetration is expected to increase from xx% in 2024 to xx% by 2033.
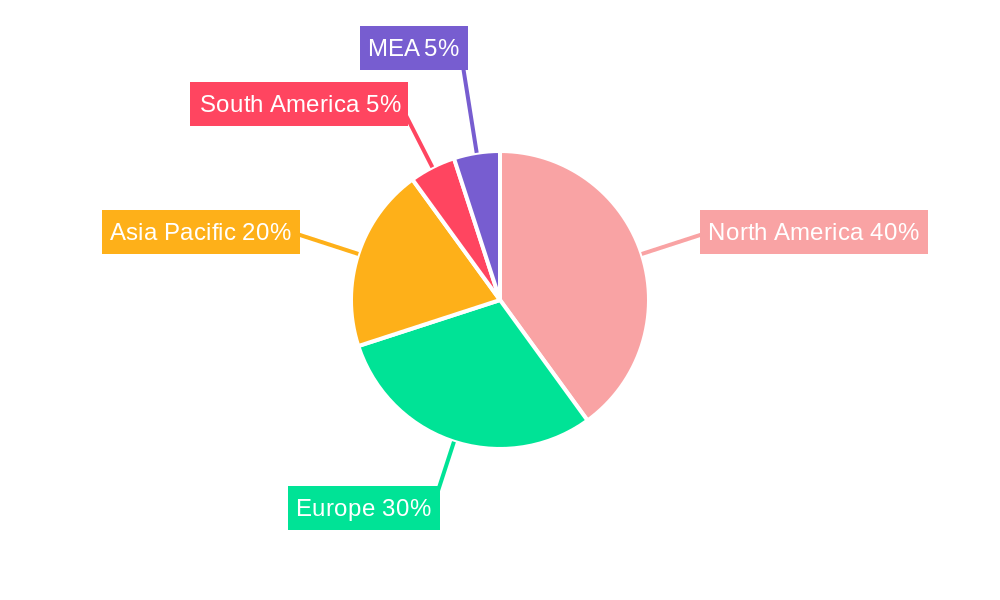
Dominant Regions, Countries, or Segments in Secured Web Gateway Market
North America currently holds the largest market share, followed by Europe. However, the Asia-Pacific region is projected to experience the fastest growth during the forecast period, driven by increasing digitalization and rising cybersecurity awareness.
By Component: The Solutions segment is currently dominant, driven by demand for advanced threat detection and prevention capabilities. However, the Services segment is showing faster growth due to increasing demand for managed security services.
By Organization Size: Large organizations are the primary adopters currently, but the Small & Medium Organization segment is exhibiting high growth potential due to increasing affordability and awareness of security risks.
By Deployment: Cloud-based deployments are gaining significant traction, owing to their scalability, flexibility, and cost-effectiveness. However, on-premise deployments remain relevant, especially for organizations with high security compliance requirements.
By End-User: The BFSI sector and Government & Defense are key drivers of market growth due to their stringent security requirements and large budgets. The IT and Telecommunication sector is also a significant end-user segment.
- North America: High adoption rates due to strong cybersecurity awareness and advanced infrastructure.
- Europe: Significant market share driven by GDPR compliance requirements.
- Asia-Pacific: Fastest growth potential due to increasing digitalization and rising cybersecurity awareness.
- Cloud Deployment: Fastest growth segment, driven by scalability and cost-effectiveness.
- BFSI & Government & Defense: Highest spending on Secured Web Gateway solutions.
Secured Web Gateway Market Product Landscape
The Secured Web Gateway market offers a range of solutions, from basic web filtering and malware protection to advanced features like AI-powered threat detection, data loss prevention, and secure remote access. Products are constantly evolving, incorporating advanced technologies like machine learning and behavioral analytics to enhance their effectiveness. Key features include granular policy controls, integrated threat intelligence feeds, and robust reporting capabilities. The focus is shifting towards integrated solutions offering enhanced security through SASE architectures.
Key Drivers, Barriers & Challenges in Secured Web Gateway Market
Key Drivers: The increasing frequency and sophistication of cyberattacks, the rise of remote work, and the growing adoption of cloud-based applications are key drivers. Government regulations mandating enhanced cybersecurity measures also fuel market expansion. The transition to SASE architectures is creating significant demand for integrated solutions.
Key Challenges: The complexity of managing and maintaining secured web gateway solutions, the high cost of implementation, and the skills gap in cybersecurity expertise present major challenges. The ever-evolving threat landscape requires continuous updates and adaptations, presenting an ongoing investment burden. Competition is intense, with numerous vendors vying for market share. Supply chain disruptions can impact the availability of hardware components, particularly in niche markets.
Emerging Opportunities in Secured Web Gateway Market
Emerging opportunities include the integration of advanced AI and machine learning capabilities for threat detection and response, the expansion into underserved markets such as small and medium-sized businesses, and the development of customized solutions catering to specific industry needs. The increasing adoption of IoT devices and the growth of 5G networks will create new security challenges and opportunities in the coming years.
Growth Accelerators in the Secured Web Gateway Market Industry
Strategic partnerships between security vendors and cloud providers are fostering market growth. Technological advancements, particularly in AI-powered threat detection and SASE architectures, are driving innovation and adoption. Increased investment in cybersecurity awareness training and education is reducing the skills gap and enhancing market demand. Expansion into emerging markets and the development of customized solutions for niche sectors are further contributing to long-term growth.
Key Players Shaping the Secured Web Gateway Market Market
- Broadcom
- Barracuda Networks Inc
- Trustwave Holdings Inc
- IBM Corporation
- Zscaler Inc
- Fortinet Inc
- McAfee LLC
- Check Point Software Technologies Ltd
- Cisco Umbrella
- Trend Micro (BlueAlly)
- Sophos Ltd
Notable Milestones in Secured Web Gateway Market Sector
- July 2023: Hughes Network Systems and Netskope partnered to offer a new SASE solution.
- June 2023: Absolute Software launched its Absolute Secure Web Gateway Service, expanding its SSE solution.
In-Depth Secured Web Gateway Market Market Outlook
The Secured Web Gateway market is poised for continued strong growth, driven by several factors. The increasing reliance on cloud-based services, the expansion of remote work models, and the growing sophistication of cyberattacks will fuel demand for advanced security solutions. Strategic partnerships, technological innovations, and increased investment in cybersecurity awareness will further accelerate market growth. The market presents significant opportunities for vendors offering innovative and integrated solutions, particularly in the areas of SASE and AI-powered threat detection.
Secured Web Gateway Market Segmentation
-
1. Component
- 1.1. Solutions
- 1.2. Services
-
2. Organization Size
- 2.1. Large Organization
- 2.2. Small & Medium Organization
-
3. Deployment
- 3.1. Cloud
- 3.2. On-premise
-
4. End User
- 4.1. BFSI
- 4.2. Healthcare
- 4.3. Manufacturing
- 4.4. Government & Defense
- 4.5. IT and Telecommunication
- 4.6. Other End Users
Secured Web Gateway Market Segmentation By Geography
- 1. North America
- 2. Europe
- 3. Asia
- 4. Australia and New Zealand
- 5. Latin America
- 6. Middle East and Africa
Secured Web Gateway Market REPORT HIGHLIGHTS
| Aspects | Details |
|---|---|
| Study Period | 2019-2033 |
| Base Year | 2024 |
| Estimated Year | 2025 |
| Forecast Period | 2025-2033 |
| Historical Period | 2019-2024 |
| Growth Rate | CAGR of 23.14% from 2019-2033 |
| Segmentation |
|
Table of Contents
- 1. Introduction
- 1.1. Research Scope
- 1.2. Market Segmentation
- 1.3. Research Methodology
- 1.4. Definitions and Assumptions
- 2. Executive Summary
- 2.1. Introduction
- 3. Market Dynamics
- 3.1. Introduction
- 3.2. Market Drivers
- 3.2.1. Increasing Demand for Digitalization and Scalable IT Infrastructure; Increase in number of sophisticated cyber attacks
- 3.3. Market Restrains
- 3.3.1. Lack of Assessment Tools to Measure Serious Game Effectiveness
- 3.4. Market Trends
- 3.4.1. Increase in Number of Sophisticated Cyber Attacks is Expected to Drive the Market Growth
- 4. Market Factor Analysis
- 4.1. Porters Five Forces
- 4.2. Supply/Value Chain
- 4.3. PESTEL analysis
- 4.4. Market Entropy
- 4.5. Patent/Trademark Analysis
- 5. Global Secured Web Gateway Market Analysis, Insights and Forecast, 2019-2031
- 5.1. Market Analysis, Insights and Forecast - by Component
- 5.1.1. Solutions
- 5.1.2. Services
- 5.2. Market Analysis, Insights and Forecast - by Organization Size
- 5.2.1. Large Organization
- 5.2.2. Small & Medium Organization
- 5.3. Market Analysis, Insights and Forecast - by Deployment
- 5.3.1. Cloud
- 5.3.2. On-premise
- 5.4. Market Analysis, Insights and Forecast - by End User
- 5.4.1. BFSI
- 5.4.2. Healthcare
- 5.4.3. Manufacturing
- 5.4.4. Government & Defense
- 5.4.5. IT and Telecommunication
- 5.4.6. Other End Users
- 5.5. Market Analysis, Insights and Forecast - by Region
- 5.5.1. North America
- 5.5.2. Europe
- 5.5.3. Asia
- 5.5.4. Australia and New Zealand
- 5.5.5. Latin America
- 5.5.6. Middle East and Africa
- 5.1. Market Analysis, Insights and Forecast - by Component
- 6. North America Secured Web Gateway Market Analysis, Insights and Forecast, 2019-2031
- 6.1. Market Analysis, Insights and Forecast - by Component
- 6.1.1. Solutions
- 6.1.2. Services
- 6.2. Market Analysis, Insights and Forecast - by Organization Size
- 6.2.1. Large Organization
- 6.2.2. Small & Medium Organization
- 6.3. Market Analysis, Insights and Forecast - by Deployment
- 6.3.1. Cloud
- 6.3.2. On-premise
- 6.4. Market Analysis, Insights and Forecast - by End User
- 6.4.1. BFSI
- 6.4.2. Healthcare
- 6.4.3. Manufacturing
- 6.4.4. Government & Defense
- 6.4.5. IT and Telecommunication
- 6.4.6. Other End Users
- 6.1. Market Analysis, Insights and Forecast - by Component
- 7. Europe Secured Web Gateway Market Analysis, Insights and Forecast, 2019-2031
- 7.1. Market Analysis, Insights and Forecast - by Component
- 7.1.1. Solutions
- 7.1.2. Services
- 7.2. Market Analysis, Insights and Forecast - by Organization Size
- 7.2.1. Large Organization
- 7.2.2. Small & Medium Organization
- 7.3. Market Analysis, Insights and Forecast - by Deployment
- 7.3.1. Cloud
- 7.3.2. On-premise
- 7.4. Market Analysis, Insights and Forecast - by End User
- 7.4.1. BFSI
- 7.4.2. Healthcare
- 7.4.3. Manufacturing
- 7.4.4. Government & Defense
- 7.4.5. IT and Telecommunication
- 7.4.6. Other End Users
- 7.1. Market Analysis, Insights and Forecast - by Component
- 8. Asia Secured Web Gateway Market Analysis, Insights and Forecast, 2019-2031
- 8.1. Market Analysis, Insights and Forecast - by Component
- 8.1.1. Solutions
- 8.1.2. Services
- 8.2. Market Analysis, Insights and Forecast - by Organization Size
- 8.2.1. Large Organization
- 8.2.2. Small & Medium Organization
- 8.3. Market Analysis, Insights and Forecast - by Deployment
- 8.3.1. Cloud
- 8.3.2. On-premise
- 8.4. Market Analysis, Insights and Forecast - by End User
- 8.4.1. BFSI
- 8.4.2. Healthcare
- 8.4.3. Manufacturing
- 8.4.4. Government & Defense
- 8.4.5. IT and Telecommunication
- 8.4.6. Other End Users
- 8.1. Market Analysis, Insights and Forecast - by Component
- 9. Australia and New Zealand Secured Web Gateway Market Analysis, Insights and Forecast, 2019-2031
- 9.1. Market Analysis, Insights and Forecast - by Component
- 9.1.1. Solutions
- 9.1.2. Services
- 9.2. Market Analysis, Insights and Forecast - by Organization Size
- 9.2.1. Large Organization
- 9.2.2. Small & Medium Organization
- 9.3. Market Analysis, Insights and Forecast - by Deployment
- 9.3.1. Cloud
- 9.3.2. On-premise
- 9.4. Market Analysis, Insights and Forecast - by End User
- 9.4.1. BFSI
- 9.4.2. Healthcare
- 9.4.3. Manufacturing
- 9.4.4. Government & Defense
- 9.4.5. IT and Telecommunication
- 9.4.6. Other End Users
- 9.1. Market Analysis, Insights and Forecast - by Component
- 10. Latin America Secured Web Gateway Market Analysis, Insights and Forecast, 2019-2031
- 10.1. Market Analysis, Insights and Forecast - by Component
- 10.1.1. Solutions
- 10.1.2. Services
- 10.2. Market Analysis, Insights and Forecast - by Organization Size
- 10.2.1. Large Organization
- 10.2.2. Small & Medium Organization
- 10.3. Market Analysis, Insights and Forecast - by Deployment
- 10.3.1. Cloud
- 10.3.2. On-premise
- 10.4. Market Analysis, Insights and Forecast - by End User
- 10.4.1. BFSI
- 10.4.2. Healthcare
- 10.4.3. Manufacturing
- 10.4.4. Government & Defense
- 10.4.5. IT and Telecommunication
- 10.4.6. Other End Users
- 10.1. Market Analysis, Insights and Forecast - by Component
- 11. Middle East and Africa Secured Web Gateway Market Analysis, Insights and Forecast, 2019-2031
- 11.1. Market Analysis, Insights and Forecast - by Component
- 11.1.1. Solutions
- 11.1.2. Services
- 11.2. Market Analysis, Insights and Forecast - by Organization Size
- 11.2.1. Large Organization
- 11.2.2. Small & Medium Organization
- 11.3. Market Analysis, Insights and Forecast - by Deployment
- 11.3.1. Cloud
- 11.3.2. On-premise
- 11.4. Market Analysis, Insights and Forecast - by End User
- 11.4.1. BFSI
- 11.4.2. Healthcare
- 11.4.3. Manufacturing
- 11.4.4. Government & Defense
- 11.4.5. IT and Telecommunication
- 11.4.6. Other End Users
- 11.1. Market Analysis, Insights and Forecast - by Component
- 12. North America Secured Web Gateway Market Analysis, Insights and Forecast, 2019-2031
- 12.1. Market Analysis, Insights and Forecast - By Country/Sub-region
- 12.1.1 United States
- 12.1.2 Canada
- 12.1.3 Mexico
- 13. Europe Secured Web Gateway Market Analysis, Insights and Forecast, 2019-2031
- 13.1. Market Analysis, Insights and Forecast - By Country/Sub-region
- 13.1.1 Germany
- 13.1.2 United Kingdom
- 13.1.3 France
- 13.1.4 Spain
- 13.1.5 Italy
- 13.1.6 Spain
- 13.1.7 Belgium
- 13.1.8 Netherland
- 13.1.9 Nordics
- 13.1.10 Rest of Europe
- 14. Asia Pacific Secured Web Gateway Market Analysis, Insights and Forecast, 2019-2031
- 14.1. Market Analysis, Insights and Forecast - By Country/Sub-region
- 14.1.1 China
- 14.1.2 Japan
- 14.1.3 India
- 14.1.4 South Korea
- 14.1.5 Southeast Asia
- 14.1.6 Australia
- 14.1.7 Indonesia
- 14.1.8 Phillipes
- 14.1.9 Singapore
- 14.1.10 Thailandc
- 14.1.11 Rest of Asia Pacific
- 15. South America Secured Web Gateway Market Analysis, Insights and Forecast, 2019-2031
- 15.1. Market Analysis, Insights and Forecast - By Country/Sub-region
- 15.1.1 Brazil
- 15.1.2 Argentina
- 15.1.3 Peru
- 15.1.4 Chile
- 15.1.5 Colombia
- 15.1.6 Ecuador
- 15.1.7 Venezuela
- 15.1.8 Rest of South America
- 16. North America Secured Web Gateway Market Analysis, Insights and Forecast, 2019-2031
- 16.1. Market Analysis, Insights and Forecast - By Country/Sub-region
- 16.1.1 United States
- 16.1.2 Canada
- 16.1.3 Mexico
- 17. MEA Secured Web Gateway Market Analysis, Insights and Forecast, 2019-2031
- 17.1. Market Analysis, Insights and Forecast - By Country/Sub-region
- 17.1.1 United Arab Emirates
- 17.1.2 Saudi Arabia
- 17.1.3 South Africa
- 17.1.4 Rest of Middle East and Africa
- 18. Competitive Analysis
- 18.1. Global Market Share Analysis 2024
- 18.2. Company Profiles
- 18.2.1 Broadcom
- 18.2.1.1. Overview
- 18.2.1.2. Products
- 18.2.1.3. SWOT Analysis
- 18.2.1.4. Recent Developments
- 18.2.1.5. Financials (Based on Availability)
- 18.2.2 Barracuda Networks Inc
- 18.2.2.1. Overview
- 18.2.2.2. Products
- 18.2.2.3. SWOT Analysis
- 18.2.2.4. Recent Developments
- 18.2.2.5. Financials (Based on Availability)
- 18.2.3 Trustwave Holdings Inc
- 18.2.3.1. Overview
- 18.2.3.2. Products
- 18.2.3.3. SWOT Analysis
- 18.2.3.4. Recent Developments
- 18.2.3.5. Financials (Based on Availability)
- 18.2.4 IBM Corporation
- 18.2.4.1. Overview
- 18.2.4.2. Products
- 18.2.4.3. SWOT Analysis
- 18.2.4.4. Recent Developments
- 18.2.4.5. Financials (Based on Availability)
- 18.2.5 Zscaler Inc
- 18.2.5.1. Overview
- 18.2.5.2. Products
- 18.2.5.3. SWOT Analysis
- 18.2.5.4. Recent Developments
- 18.2.5.5. Financials (Based on Availability)
- 18.2.6 Fortinet Inc
- 18.2.6.1. Overview
- 18.2.6.2. Products
- 18.2.6.3. SWOT Analysis
- 18.2.6.4. Recent Developments
- 18.2.6.5. Financials (Based on Availability)
- 18.2.7 McAfee LLC
- 18.2.7.1. Overview
- 18.2.7.2. Products
- 18.2.7.3. SWOT Analysis
- 18.2.7.4. Recent Developments
- 18.2.7.5. Financials (Based on Availability)
- 18.2.8 Check Point Software Technologies Ltd
- 18.2.8.1. Overview
- 18.2.8.2. Products
- 18.2.8.3. SWOT Analysis
- 18.2.8.4. Recent Developments
- 18.2.8.5. Financials (Based on Availability)
- 18.2.9 Cisco Umbrella
- 18.2.9.1. Overview
- 18.2.9.2. Products
- 18.2.9.3. SWOT Analysis
- 18.2.9.4. Recent Developments
- 18.2.9.5. Financials (Based on Availability)
- 18.2.10 Trend Micro (BlueAlly)
- 18.2.10.1. Overview
- 18.2.10.2. Products
- 18.2.10.3. SWOT Analysis
- 18.2.10.4. Recent Developments
- 18.2.10.5. Financials (Based on Availability)
- 18.2.11 Sophos Ltd
- 18.2.11.1. Overview
- 18.2.11.2. Products
- 18.2.11.3. SWOT Analysis
- 18.2.11.4. Recent Developments
- 18.2.11.5. Financials (Based on Availability)
- 18.2.1 Broadcom
List of Figures
- Figure 1: Global Secured Web Gateway Market Revenue Breakdown (Million, %) by Region 2024 & 2032
- Figure 2: North America Secured Web Gateway Market Revenue (Million), by Country 2024 & 2032
- Figure 3: North America Secured Web Gateway Market Revenue Share (%), by Country 2024 & 2032
- Figure 4: Europe Secured Web Gateway Market Revenue (Million), by Country 2024 & 2032
- Figure 5: Europe Secured Web Gateway Market Revenue Share (%), by Country 2024 & 2032
- Figure 6: Asia Pacific Secured Web Gateway Market Revenue (Million), by Country 2024 & 2032
- Figure 7: Asia Pacific Secured Web Gateway Market Revenue Share (%), by Country 2024 & 2032
- Figure 8: South America Secured Web Gateway Market Revenue (Million), by Country 2024 & 2032
- Figure 9: South America Secured Web Gateway Market Revenue Share (%), by Country 2024 & 2032
- Figure 10: North America Secured Web Gateway Market Revenue (Million), by Country 2024 & 2032
- Figure 11: North America Secured Web Gateway Market Revenue Share (%), by Country 2024 & 2032
- Figure 12: MEA Secured Web Gateway Market Revenue (Million), by Country 2024 & 2032
- Figure 13: MEA Secured Web Gateway Market Revenue Share (%), by Country 2024 & 2032
- Figure 14: North America Secured Web Gateway Market Revenue (Million), by Component 2024 & 2032
- Figure 15: North America Secured Web Gateway Market Revenue Share (%), by Component 2024 & 2032
- Figure 16: North America Secured Web Gateway Market Revenue (Million), by Organization Size 2024 & 2032
- Figure 17: North America Secured Web Gateway Market Revenue Share (%), by Organization Size 2024 & 2032
- Figure 18: North America Secured Web Gateway Market Revenue (Million), by Deployment 2024 & 2032
- Figure 19: North America Secured Web Gateway Market Revenue Share (%), by Deployment 2024 & 2032
- Figure 20: North America Secured Web Gateway Market Revenue (Million), by End User 2024 & 2032
- Figure 21: North America Secured Web Gateway Market Revenue Share (%), by End User 2024 & 2032
- Figure 22: North America Secured Web Gateway Market Revenue (Million), by Country 2024 & 2032
- Figure 23: North America Secured Web Gateway Market Revenue Share (%), by Country 2024 & 2032
- Figure 24: Europe Secured Web Gateway Market Revenue (Million), by Component 2024 & 2032
- Figure 25: Europe Secured Web Gateway Market Revenue Share (%), by Component 2024 & 2032
- Figure 26: Europe Secured Web Gateway Market Revenue (Million), by Organization Size 2024 & 2032
- Figure 27: Europe Secured Web Gateway Market Revenue Share (%), by Organization Size 2024 & 2032
- Figure 28: Europe Secured Web Gateway Market Revenue (Million), by Deployment 2024 & 2032
- Figure 29: Europe Secured Web Gateway Market Revenue Share (%), by Deployment 2024 & 2032
- Figure 30: Europe Secured Web Gateway Market Revenue (Million), by End User 2024 & 2032
- Figure 31: Europe Secured Web Gateway Market Revenue Share (%), by End User 2024 & 2032
- Figure 32: Europe Secured Web Gateway Market Revenue (Million), by Country 2024 & 2032
- Figure 33: Europe Secured Web Gateway Market Revenue Share (%), by Country 2024 & 2032
- Figure 34: Asia Secured Web Gateway Market Revenue (Million), by Component 2024 & 2032
- Figure 35: Asia Secured Web Gateway Market Revenue Share (%), by Component 2024 & 2032
- Figure 36: Asia Secured Web Gateway Market Revenue (Million), by Organization Size 2024 & 2032
- Figure 37: Asia Secured Web Gateway Market Revenue Share (%), by Organization Size 2024 & 2032
- Figure 38: Asia Secured Web Gateway Market Revenue (Million), by Deployment 2024 & 2032
- Figure 39: Asia Secured Web Gateway Market Revenue Share (%), by Deployment 2024 & 2032
- Figure 40: Asia Secured Web Gateway Market Revenue (Million), by End User 2024 & 2032
- Figure 41: Asia Secured Web Gateway Market Revenue Share (%), by End User 2024 & 2032
- Figure 42: Asia Secured Web Gateway Market Revenue (Million), by Country 2024 & 2032
- Figure 43: Asia Secured Web Gateway Market Revenue Share (%), by Country 2024 & 2032
- Figure 44: Australia and New Zealand Secured Web Gateway Market Revenue (Million), by Component 2024 & 2032
- Figure 45: Australia and New Zealand Secured Web Gateway Market Revenue Share (%), by Component 2024 & 2032
- Figure 46: Australia and New Zealand Secured Web Gateway Market Revenue (Million), by Organization Size 2024 & 2032
- Figure 47: Australia and New Zealand Secured Web Gateway Market Revenue Share (%), by Organization Size 2024 & 2032
- Figure 48: Australia and New Zealand Secured Web Gateway Market Revenue (Million), by Deployment 2024 & 2032
- Figure 49: Australia and New Zealand Secured Web Gateway Market Revenue Share (%), by Deployment 2024 & 2032
- Figure 50: Australia and New Zealand Secured Web Gateway Market Revenue (Million), by End User 2024 & 2032
- Figure 51: Australia and New Zealand Secured Web Gateway Market Revenue Share (%), by End User 2024 & 2032
- Figure 52: Australia and New Zealand Secured Web Gateway Market Revenue (Million), by Country 2024 & 2032
- Figure 53: Australia and New Zealand Secured Web Gateway Market Revenue Share (%), by Country 2024 & 2032
- Figure 54: Latin America Secured Web Gateway Market Revenue (Million), by Component 2024 & 2032
- Figure 55: Latin America Secured Web Gateway Market Revenue Share (%), by Component 2024 & 2032
- Figure 56: Latin America Secured Web Gateway Market Revenue (Million), by Organization Size 2024 & 2032
- Figure 57: Latin America Secured Web Gateway Market Revenue Share (%), by Organization Size 2024 & 2032
- Figure 58: Latin America Secured Web Gateway Market Revenue (Million), by Deployment 2024 & 2032
- Figure 59: Latin America Secured Web Gateway Market Revenue Share (%), by Deployment 2024 & 2032
- Figure 60: Latin America Secured Web Gateway Market Revenue (Million), by End User 2024 & 2032
- Figure 61: Latin America Secured Web Gateway Market Revenue Share (%), by End User 2024 & 2032
- Figure 62: Latin America Secured Web Gateway Market Revenue (Million), by Country 2024 & 2032
- Figure 63: Latin America Secured Web Gateway Market Revenue Share (%), by Country 2024 & 2032
- Figure 64: Middle East and Africa Secured Web Gateway Market Revenue (Million), by Component 2024 & 2032
- Figure 65: Middle East and Africa Secured Web Gateway Market Revenue Share (%), by Component 2024 & 2032
- Figure 66: Middle East and Africa Secured Web Gateway Market Revenue (Million), by Organization Size 2024 & 2032
- Figure 67: Middle East and Africa Secured Web Gateway Market Revenue Share (%), by Organization Size 2024 & 2032
- Figure 68: Middle East and Africa Secured Web Gateway Market Revenue (Million), by Deployment 2024 & 2032
- Figure 69: Middle East and Africa Secured Web Gateway Market Revenue Share (%), by Deployment 2024 & 2032
- Figure 70: Middle East and Africa Secured Web Gateway Market Revenue (Million), by End User 2024 & 2032
- Figure 71: Middle East and Africa Secured Web Gateway Market Revenue Share (%), by End User 2024 & 2032
- Figure 72: Middle East and Africa Secured Web Gateway Market Revenue (Million), by Country 2024 & 2032
- Figure 73: Middle East and Africa Secured Web Gateway Market Revenue Share (%), by Country 2024 & 2032
List of Tables
- Table 1: Global Secured Web Gateway Market Revenue Million Forecast, by Region 2019 & 2032
- Table 2: Global Secured Web Gateway Market Revenue Million Forecast, by Component 2019 & 2032
- Table 3: Global Secured Web Gateway Market Revenue Million Forecast, by Organization Size 2019 & 2032
- Table 4: Global Secured Web Gateway Market Revenue Million Forecast, by Deployment 2019 & 2032
- Table 5: Global Secured Web Gateway Market Revenue Million Forecast, by End User 2019 & 2032
- Table 6: Global Secured Web Gateway Market Revenue Million Forecast, by Region 2019 & 2032
- Table 7: Global Secured Web Gateway Market Revenue Million Forecast, by Country 2019 & 2032
- Table 8: United States Secured Web Gateway Market Revenue (Million) Forecast, by Application 2019 & 2032
- Table 9: Canada Secured Web Gateway Market Revenue (Million) Forecast, by Application 2019 & 2032
- Table 10: Mexico Secured Web Gateway Market Revenue (Million) Forecast, by Application 2019 & 2032
- Table 11: Global Secured Web Gateway Market Revenue Million Forecast, by Country 2019 & 2032
- Table 12: Germany Secured Web Gateway Market Revenue (Million) Forecast, by Application 2019 & 2032
- Table 13: United Kingdom Secured Web Gateway Market Revenue (Million) Forecast, by Application 2019 & 2032
- Table 14: France Secured Web Gateway Market Revenue (Million) Forecast, by Application 2019 & 2032
- Table 15: Spain Secured Web Gateway Market Revenue (Million) Forecast, by Application 2019 & 2032
- Table 16: Italy Secured Web Gateway Market Revenue (Million) Forecast, by Application 2019 & 2032
- Table 17: Spain Secured Web Gateway Market Revenue (Million) Forecast, by Application 2019 & 2032
- Table 18: Belgium Secured Web Gateway Market Revenue (Million) Forecast, by Application 2019 & 2032
- Table 19: Netherland Secured Web Gateway Market Revenue (Million) Forecast, by Application 2019 & 2032
- Table 20: Nordics Secured Web Gateway Market Revenue (Million) Forecast, by Application 2019 & 2032
- Table 21: Rest of Europe Secured Web Gateway Market Revenue (Million) Forecast, by Application 2019 & 2032
- Table 22: Global Secured Web Gateway Market Revenue Million Forecast, by Country 2019 & 2032
- Table 23: China Secured Web Gateway Market Revenue (Million) Forecast, by Application 2019 & 2032
- Table 24: Japan Secured Web Gateway Market Revenue (Million) Forecast, by Application 2019 & 2032
- Table 25: India Secured Web Gateway Market Revenue (Million) Forecast, by Application 2019 & 2032
- Table 26: South Korea Secured Web Gateway Market Revenue (Million) Forecast, by Application 2019 & 2032
- Table 27: Southeast Asia Secured Web Gateway Market Revenue (Million) Forecast, by Application 2019 & 2032
- Table 28: Australia Secured Web Gateway Market Revenue (Million) Forecast, by Application 2019 & 2032
- Table 29: Indonesia Secured Web Gateway Market Revenue (Million) Forecast, by Application 2019 & 2032
- Table 30: Phillipes Secured Web Gateway Market Revenue (Million) Forecast, by Application 2019 & 2032
- Table 31: Singapore Secured Web Gateway Market Revenue (Million) Forecast, by Application 2019 & 2032
- Table 32: Thailandc Secured Web Gateway Market Revenue (Million) Forecast, by Application 2019 & 2032
- Table 33: Rest of Asia Pacific Secured Web Gateway Market Revenue (Million) Forecast, by Application 2019 & 2032
- Table 34: Global Secured Web Gateway Market Revenue Million Forecast, by Country 2019 & 2032
- Table 35: Brazil Secured Web Gateway Market Revenue (Million) Forecast, by Application 2019 & 2032
- Table 36: Argentina Secured Web Gateway Market Revenue (Million) Forecast, by Application 2019 & 2032
- Table 37: Peru Secured Web Gateway Market Revenue (Million) Forecast, by Application 2019 & 2032
- Table 38: Chile Secured Web Gateway Market Revenue (Million) Forecast, by Application 2019 & 2032
- Table 39: Colombia Secured Web Gateway Market Revenue (Million) Forecast, by Application 2019 & 2032
- Table 40: Ecuador Secured Web Gateway Market Revenue (Million) Forecast, by Application 2019 & 2032
- Table 41: Venezuela Secured Web Gateway Market Revenue (Million) Forecast, by Application 2019 & 2032
- Table 42: Rest of South America Secured Web Gateway Market Revenue (Million) Forecast, by Application 2019 & 2032
- Table 43: Global Secured Web Gateway Market Revenue Million Forecast, by Country 2019 & 2032
- Table 44: United States Secured Web Gateway Market Revenue (Million) Forecast, by Application 2019 & 2032
- Table 45: Canada Secured Web Gateway Market Revenue (Million) Forecast, by Application 2019 & 2032
- Table 46: Mexico Secured Web Gateway Market Revenue (Million) Forecast, by Application 2019 & 2032
- Table 47: Global Secured Web Gateway Market Revenue Million Forecast, by Country 2019 & 2032
- Table 48: United Arab Emirates Secured Web Gateway Market Revenue (Million) Forecast, by Application 2019 & 2032
- Table 49: Saudi Arabia Secured Web Gateway Market Revenue (Million) Forecast, by Application 2019 & 2032
- Table 50: South Africa Secured Web Gateway Market Revenue (Million) Forecast, by Application 2019 & 2032
- Table 51: Rest of Middle East and Africa Secured Web Gateway Market Revenue (Million) Forecast, by Application 2019 & 2032
- Table 52: Global Secured Web Gateway Market Revenue Million Forecast, by Component 2019 & 2032
- Table 53: Global Secured Web Gateway Market Revenue Million Forecast, by Organization Size 2019 & 2032
- Table 54: Global Secured Web Gateway Market Revenue Million Forecast, by Deployment 2019 & 2032
- Table 55: Global Secured Web Gateway Market Revenue Million Forecast, by End User 2019 & 2032
- Table 56: Global Secured Web Gateway Market Revenue Million Forecast, by Country 2019 & 2032
- Table 57: Global Secured Web Gateway Market Revenue Million Forecast, by Component 2019 & 2032
- Table 58: Global Secured Web Gateway Market Revenue Million Forecast, by Organization Size 2019 & 2032
- Table 59: Global Secured Web Gateway Market Revenue Million Forecast, by Deployment 2019 & 2032
- Table 60: Global Secured Web Gateway Market Revenue Million Forecast, by End User 2019 & 2032
- Table 61: Global Secured Web Gateway Market Revenue Million Forecast, by Country 2019 & 2032
- Table 62: Global Secured Web Gateway Market Revenue Million Forecast, by Component 2019 & 2032
- Table 63: Global Secured Web Gateway Market Revenue Million Forecast, by Organization Size 2019 & 2032
- Table 64: Global Secured Web Gateway Market Revenue Million Forecast, by Deployment 2019 & 2032
- Table 65: Global Secured Web Gateway Market Revenue Million Forecast, by End User 2019 & 2032
- Table 66: Global Secured Web Gateway Market Revenue Million Forecast, by Country 2019 & 2032
- Table 67: Global Secured Web Gateway Market Revenue Million Forecast, by Component 2019 & 2032
- Table 68: Global Secured Web Gateway Market Revenue Million Forecast, by Organization Size 2019 & 2032
- Table 69: Global Secured Web Gateway Market Revenue Million Forecast, by Deployment 2019 & 2032
- Table 70: Global Secured Web Gateway Market Revenue Million Forecast, by End User 2019 & 2032
- Table 71: Global Secured Web Gateway Market Revenue Million Forecast, by Country 2019 & 2032
- Table 72: Global Secured Web Gateway Market Revenue Million Forecast, by Component 2019 & 2032
- Table 73: Global Secured Web Gateway Market Revenue Million Forecast, by Organization Size 2019 & 2032
- Table 74: Global Secured Web Gateway Market Revenue Million Forecast, by Deployment 2019 & 2032
- Table 75: Global Secured Web Gateway Market Revenue Million Forecast, by End User 2019 & 2032
- Table 76: Global Secured Web Gateway Market Revenue Million Forecast, by Country 2019 & 2032
- Table 77: Global Secured Web Gateway Market Revenue Million Forecast, by Component 2019 & 2032
- Table 78: Global Secured Web Gateway Market Revenue Million Forecast, by Organization Size 2019 & 2032
- Table 79: Global Secured Web Gateway Market Revenue Million Forecast, by Deployment 2019 & 2032
- Table 80: Global Secured Web Gateway Market Revenue Million Forecast, by End User 2019 & 2032
- Table 81: Global Secured Web Gateway Market Revenue Million Forecast, by Country 2019 & 2032
Frequently Asked Questions
1. What is the projected Compound Annual Growth Rate (CAGR) of the Secured Web Gateway Market?
The projected CAGR is approximately 23.14%.
2. Which companies are prominent players in the Secured Web Gateway Market?
Key companies in the market include Broadcom, Barracuda Networks Inc, Trustwave Holdings Inc, IBM Corporation, Zscaler Inc, Fortinet Inc, McAfee LLC, Check Point Software Technologies Ltd, Cisco Umbrella, Trend Micro (BlueAlly), Sophos Ltd.
3. What are the main segments of the Secured Web Gateway Market?
The market segments include Component, Organization Size, Deployment, End User.
4. Can you provide details about the market size?
The market size is estimated to be USD 13.71 Million as of 2022.
5. What are some drivers contributing to market growth?
Increasing Demand for Digitalization and Scalable IT Infrastructure; Increase in number of sophisticated cyber attacks.
6. What are the notable trends driving market growth?
Increase in Number of Sophisticated Cyber Attacks is Expected to Drive the Market Growth.
7. Are there any restraints impacting market growth?
Lack of Assessment Tools to Measure Serious Game Effectiveness.
8. Can you provide examples of recent developments in the market?
July 2023 - Hughes Network Systems, LLC (HUGHES), an EchoStar company, and Netskope, one of the leaders in Security Access Service Edge (SASE), announced the partnership to bring Hughes customers a new SASE solution that combines Hughes managed services expertise with Netskope’s leading Security Service Edge (SSE) capabilities.
9. What pricing options are available for accessing the report?
Pricing options include single-user, multi-user, and enterprise licenses priced at USD 4750, USD 5250, and USD 8750 respectively.
10. Is the market size provided in terms of value or volume?
The market size is provided in terms of value, measured in Million.
11. Are there any specific market keywords associated with the report?
Yes, the market keyword associated with the report is "Secured Web Gateway Market," which aids in identifying and referencing the specific market segment covered.
12. How do I determine which pricing option suits my needs best?
The pricing options vary based on user requirements and access needs. Individual users may opt for single-user licenses, while businesses requiring broader access may choose multi-user or enterprise licenses for cost-effective access to the report.
13. Are there any additional resources or data provided in the Secured Web Gateway Market report?
While the report offers comprehensive insights, it's advisable to review the specific contents or supplementary materials provided to ascertain if additional resources or data are available.
14. How can I stay updated on further developments or reports in the Secured Web Gateway Market?
To stay informed about further developments, trends, and reports in the Secured Web Gateway Market, consider subscribing to industry newsletters, following relevant companies and organizations, or regularly checking reputable industry news sources and publications.
Methodology
Step 1 - Identification of Relevant Samples Size from Population Database


Step 2 - Approaches for Defining Global Market Size (Value, Volume* & Price*)

Note*: In applicable scenarios
Step 3 - Data Sources
Primary Research
- Web Analytics
- Survey Reports
- Research Institute
- Latest Research Reports
- Opinion Leaders
Secondary Research
- Annual Reports
- White Paper
- Latest Press Release
- Industry Association
- Paid Database
- Investor Presentations

Step 4 - Data Triangulation
Involves using different sources of information in order to increase the validity of a study
These sources are likely to be stakeholders in a program - participants, other researchers, program staff, other community members, and so on.
Then we put all data in single framework & apply various statistical tools to find out the dynamic on the market.
During the analysis stage, feedback from the stakeholder groups would be compared to determine areas of agreement as well as areas of divergence


