
Key Insights
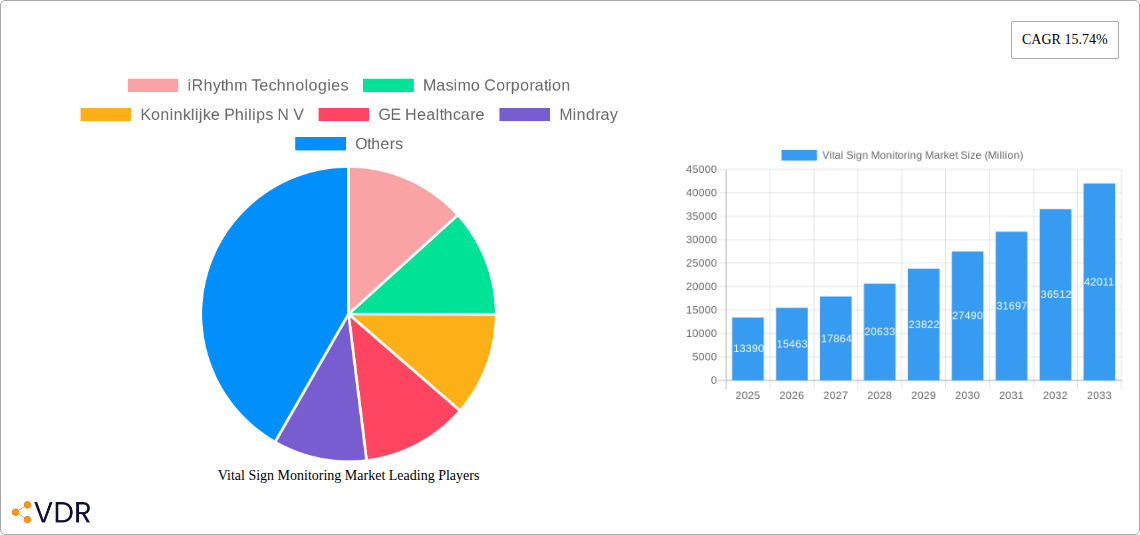
The global vital sign monitoring market, valued at $13.39 billion in 2025, is projected to experience robust growth, driven by a compound annual growth rate (CAGR) of 15.74% from 2025 to 2033. This expansion is fueled by several key factors. The increasing prevalence of chronic diseases, such as heart disease and diabetes, necessitates continuous monitoring of vital signs, boosting demand for advanced monitoring devices. Furthermore, technological advancements, including the development of wireless and wearable monitoring technologies, are enhancing the convenience and accessibility of vital sign monitoring, leading to wider adoption across various healthcare settings. The growing geriatric population, which is particularly susceptible to health complications requiring frequent vital sign checks, further contributes to market growth. Hospitals and clinics remain the largest segment, however, the growing preference for home healthcare and ambulatory services is also driving significant market expansion in these segments. The integration of remote patient monitoring (RPM) systems and the rise of telehealth are key trends facilitating this shift. While high initial investment costs for advanced technologies might pose a restraint, the long-term benefits in terms of improved patient outcomes and reduced hospital readmissions are outweighing these concerns. Competition among major players such as iRhythm Technologies, Masimo Corporation, and Philips is fostering innovation and driving down costs, making vital sign monitoring more accessible.
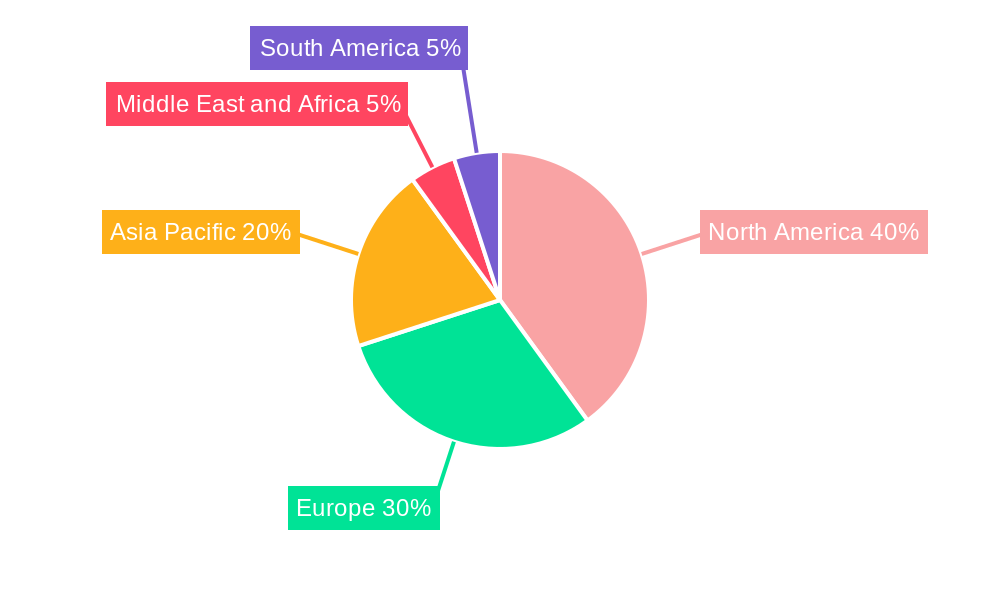
The market's segmentation offers further insights. Consumer wearables are gaining popularity for personal health management, creating a significant growth opportunity. The geographical distribution reveals North America and Europe currently hold substantial market shares, owing to advanced healthcare infrastructure and high adoption rates of innovative technologies. However, the Asia-Pacific region is expected to experience the fastest growth over the forecast period, driven by increasing healthcare expenditure and rising awareness of preventive healthcare. This dynamic market landscape promises continued expansion in the coming years, presenting attractive opportunities for market players to capitalize on technological advancements, evolving healthcare trends, and increasing demand for continuous health monitoring.
This comprehensive report offers an in-depth analysis of the Vital Sign Monitoring Market, encompassing market dynamics, growth trends, regional dominance, product landscape, key players, and future outlook. The report covers the period from 2019 to 2033, with a focus on the forecast period 2025-2033 and a base year of 2025. This detailed analysis caters to industry professionals, investors, and stakeholders seeking to understand and capitalize on opportunities within this rapidly evolving sector. The parent market is the wider healthcare technology sector, while the child market is specifically focused on remote patient monitoring (RPM) and wearable health technologies.
Vital Sign Monitoring Market Dynamics & Structure
The Vital Sign Monitoring market is characterized by a moderately concentrated landscape with key players holding significant market share. Technological innovation, particularly in wearable sensors and AI-driven analytics, is a primary driver. Stringent regulatory frameworks, especially concerning data privacy and device accuracy, heavily influence market dynamics. Competitive pressures arise from both established medical device companies and emerging technology players offering increasingly sophisticated and user-friendly solutions. The market is further segmented by product type (Consumer Wearables, Professional Devices) and end-user (Hospitals and Clinics, Ambulatory and Health Centers, Home Care). Mergers and acquisitions (M&A) activity has been notable, with larger companies consolidating their position through strategic acquisitions of smaller technology firms.
- Market Concentration: The top 5 players hold an estimated xx% market share in 2025.
- Technological Innovation: Advancements in AI, miniaturization, and wireless connectivity are key drivers.
- Regulatory Landscape: Compliance with FDA regulations and data privacy standards (e.g., HIPAA) is crucial.
- Competitive Substitutes: The market faces competition from alternative monitoring technologies and telehealth platforms.
- End-User Demographics: Aging populations and rising chronic disease prevalence are boosting demand.
- M&A Activity: An estimated xx M&A deals occurred in the vital signs monitoring sector between 2019 and 2024.
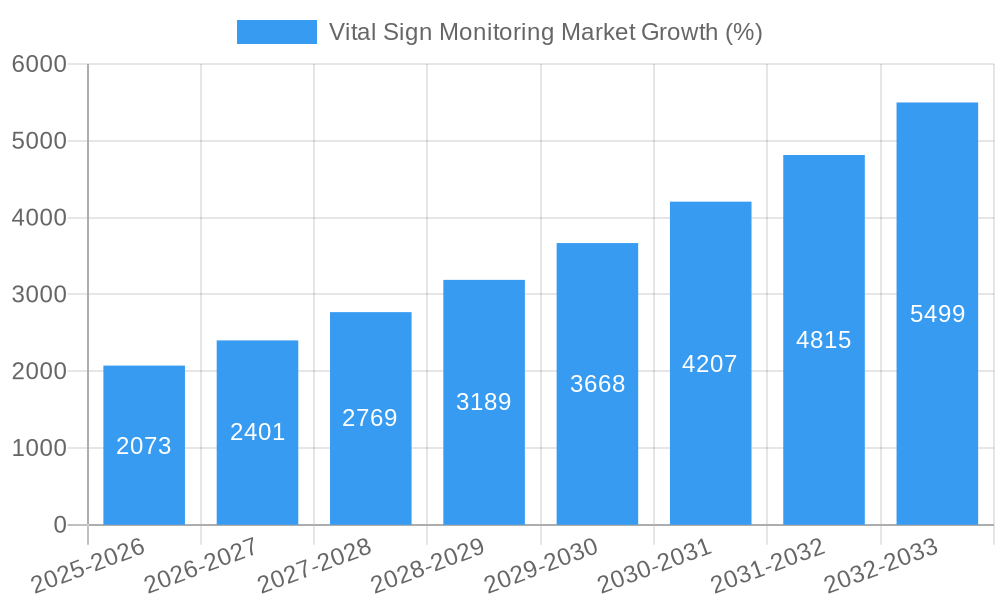
Vital Sign Monitoring Market Growth Trends & Insights
The global vital sign monitoring market is experiencing robust growth, driven by factors such as the increasing prevalence of chronic diseases, rising healthcare expenditure, and the growing adoption of remote patient monitoring (RPM) solutions. The market size is projected to reach xx Million units by 2033, exhibiting a Compound Annual Growth Rate (CAGR) of xx% during the forecast period (2025-2033). This growth is fueled by technological advancements such as the integration of artificial intelligence (AI) and machine learning (ML) into monitoring devices, leading to improved accuracy and efficiency in diagnostics. Consumer preference for convenient, home-based health monitoring is further contributing to the market expansion. The adoption rate of wearable vital sign monitoring devices, particularly in the consumer segment, is showing significant growth, and this trend is expected to continue.
Dominant Regions, Countries, or Segments in Vital Sign Monitoring Market
North America currently holds the largest market share in the vital sign monitoring market, driven by factors such as high healthcare expenditure, advanced healthcare infrastructure, and early adoption of innovative technologies. Within North America, the United States dominates due to its large population size and high prevalence of chronic diseases. However, Asia Pacific is expected to witness the fastest growth rate during the forecast period, driven by rising healthcare expenditure, increasing technological advancements, and a growing awareness of health and wellness amongst consumers. Within this region, China and India are seen as significant growth markets. The Hospitals and Clinics segment dominates in terms of revenue generation, followed by Ambulatory and Health centers, and Home Care segments demonstrating considerable potential growth, particularly for wearable consumer devices.
- North America: High healthcare expenditure, advanced infrastructure, and early adoption of new technologies.
- Europe: Significant market size driven by government initiatives and aging population.
- Asia Pacific: Fastest-growing region due to rising healthcare expenditure and expanding middle class.
- Hospitals and Clinics: High demand for professional-grade devices and integrated systems.
- Home Care: Growing adoption of wearable devices for remote monitoring and increased patient convenience.
- Ambulatory and Health Centers: Increasing demand for portable and efficient monitoring solutions.
Vital Sign Monitoring Market Product Landscape
The vital sign monitoring market offers a diverse range of products, from basic manual devices to sophisticated, AI-powered wearable systems. Continuous advancements focus on improving accuracy, miniaturization, and user-friendliness. Many devices offer integrated data analytics and remote connectivity, facilitating proactive patient care and improved healthcare outcomes. Unique selling propositions (USPs) often include features like wireless connectivity, extended battery life, ease of use, and data integration with Electronic Health Records (EHR) systems. Recent innovations are focused on non-invasive sensing technologies, providing a more comfortable and user-friendly experience.
Key Drivers, Barriers & Challenges in Vital Sign Monitoring Market
Key Drivers:
- Increasing prevalence of chronic diseases.
- Rising healthcare expenditure.
- Growing demand for remote patient monitoring (RPM).
- Technological advancements in sensor technology and data analytics.
- Government initiatives promoting telehealth and home healthcare.
Key Barriers and Challenges:
- High initial investment costs for advanced technologies.
- Data security and privacy concerns.
- Regulatory hurdles and approval processes.
- Interoperability issues between different devices and systems.
- The limited reimbursement policies in some healthcare systems.
Emerging Opportunities in Vital Sign Monitoring Market
Emerging opportunities exist in the integration of AI and machine learning for predictive analytics, enabling proactive intervention and improved patient outcomes. The expansion into untapped markets, particularly in developing countries, presents significant growth potential. Personalized medicine applications, using vital sign data for tailored treatment plans, are gaining traction. There is also an increasing focus on integrating vital sign monitoring with other wearable health technologies to provide holistic health insights.
Growth Accelerators in the Vital Sign Monitoring Market Industry
Long-term growth is fueled by several factors. Strategic partnerships between technology providers and healthcare organizations are enhancing market penetration and adoption. Technological breakthroughs continue to miniaturize devices and improve their accuracy, lowering the barrier to entry and adoption. Expansion into new geographic markets, especially in developing economies, is a significant driver of long-term growth. Finally, the increasing emphasis on preventative care and remote monitoring positions this market for sustainable, long-term expansion.
Key Players Shaping the Vital Sign Monitoring Market Market
- iRhythm Technologies
- Masimo Corporation
- Koninklijke Philips N V
- GE Healthcare
- Mindray
- Medtronic PLC
- Contec Medical Systems Limited
- Omron Healthcare Inc
- Nihon Kohden Corporation
- BioBeat Technologies
- Apple Inc
- A&D Company Limited
Notable Milestones in Vital Sign Monitoring Market Sector
- April 2022: Anelto Inc. partnered with BioIntelliSense, Inc. to integrate BioSticker and BioButton with Anelto's RemoteCareLive! platform, expanding RPM capabilities.
- March 2022: Alder Hey Children's NHS Foundation Trust partnered with Isansys Lifecare to improve at-home patient monitoring, demonstrating the growing adoption of remote monitoring solutions in healthcare systems.
In-Depth Vital Sign Monitoring Market Market Outlook
The vital sign monitoring market is poised for continued expansion, driven by technological advancements, the increasing adoption of remote patient monitoring, and a growing awareness of preventative healthcare. Strategic partnerships and investments in research and development will further fuel market growth. The integration of artificial intelligence and machine learning will enable more sophisticated data analysis and proactive interventions, positioning this market for significant future expansion and transformative impact on patient care.
Vital Sign Monitoring Market Segmentation
-
1. Product
-
1.1. Consumer Wearables
- 1.1.1. Smartwatches
- 1.1.2. Fitness & Activity Trackers
- 1.1.3. Smart Patches
- 1.1.4. Other Wearables
-
1.2. Medical Device
- 1.2.1. Blood Pressure Monitors (Analog & Digital)
- 1.2.2. Pulse Oximeters (Fingertip, Handheld & Others)
- 1.2.3. Temperature Monitoring Device
- 1.2.4. Respiratory rate Monitors
-
1.1. Consumer Wearables
-
2. End-user
- 2.1. Hospitals and Clinics
- 2.2. Ambulatory and Health centers
- 2.3. Home care
Vital Sign Monitoring Market Segmentation By Geography
-
1. North America
- 1.1. United States
- 1.2. Canada
- 1.3. Mexico
-
2. Europe
- 2.1. Germany
- 2.2. United Kingdom
- 2.3. France
- 2.4. Italy
- 2.5. Spain
- 2.6. Rest of Europe
-
3. Asia Pacific
- 3.1. China
- 3.2. Japan
- 3.3. India
- 3.4. Australia
- 3.5. South Korea
- 3.6. Rest of Asia Pacific
-
4. Middle East and Africa
- 4.1. GCC
- 4.2. South Africa
- 4.3. Rest of Middle East and Africa
-
5. South America
- 5.1. Brazil
- 5.2. Argentina
- 5.3. Rest of South America
Vital Sign Monitoring Market REPORT HIGHLIGHTS
| Aspects | Details |
|---|---|
| Study Period | 2019-2033 |
| Base Year | 2024 |
| Estimated Year | 2025 |
| Forecast Period | 2025-2033 |
| Historical Period | 2019-2024 |
| Growth Rate | CAGR of 15.74% from 2019-2033 |
| Segmentation |
|
Table of Contents
- 1. Introduction
- 1.1. Research Scope
- 1.2. Market Segmentation
- 1.3. Research Methodology
- 1.4. Definitions and Assumptions
- 2. Executive Summary
- 2.1. Introduction
- 3. Market Dynamics
- 3.1. Introduction
- 3.2. Market Drivers
- 3.2.1. Increasing prevalence of Chronic Diseases; Recent Technological Innovations (at the component level) and the Fast-Tracking of Regulatory Approvals in the Field of Wearables; Growth in Demand for Home Care Monitoring
- 3.3. Market Restrains
- 3.3.1. User Readiness and Unresponsiveness of Some Monitoring Devices; Competitive Pricing Pressure and Presence of Counterfeit Products
- 3.4. Market Trends
- 3.4.1. Hospitals and Clinics Segment is Expected to Hold a Significant Share in the Market Over the Forecast Period
- 4. Market Factor Analysis
- 4.1. Porters Five Forces
- 4.2. Supply/Value Chain
- 4.3. PESTEL analysis
- 4.4. Market Entropy
- 4.5. Patent/Trademark Analysis
- 5. Global Vital Sign Monitoring Market Analysis, Insights and Forecast, 2019-2031
- 5.1. Market Analysis, Insights and Forecast - by Product
- 5.1.1. Consumer Wearables
- 5.1.1.1. Smartwatches
- 5.1.1.2. Fitness & Activity Trackers
- 5.1.1.3. Smart Patches
- 5.1.1.4. Other Wearables
- 5.1.2. Medical Device
- 5.1.2.1. Blood Pressure Monitors (Analog & Digital)
- 5.1.2.2. Pulse Oximeters (Fingertip, Handheld & Others)
- 5.1.2.3. Temperature Monitoring Device
- 5.1.2.4. Respiratory rate Monitors
- 5.1.1. Consumer Wearables
- 5.2. Market Analysis, Insights and Forecast - by End-user
- 5.2.1. Hospitals and Clinics
- 5.2.2. Ambulatory and Health centers
- 5.2.3. Home care
- 5.3. Market Analysis, Insights and Forecast - by Region
- 5.3.1. North America
- 5.3.2. Europe
- 5.3.3. Asia Pacific
- 5.3.4. Middle East and Africa
- 5.3.5. South America
- 5.1. Market Analysis, Insights and Forecast - by Product
- 6. North America Vital Sign Monitoring Market Analysis, Insights and Forecast, 2019-2031
- 6.1. Market Analysis, Insights and Forecast - by Product
- 6.1.1. Consumer Wearables
- 6.1.1.1. Smartwatches
- 6.1.1.2. Fitness & Activity Trackers
- 6.1.1.3. Smart Patches
- 6.1.1.4. Other Wearables
- 6.1.2. Medical Device
- 6.1.2.1. Blood Pressure Monitors (Analog & Digital)
- 6.1.2.2. Pulse Oximeters (Fingertip, Handheld & Others)
- 6.1.2.3. Temperature Monitoring Device
- 6.1.2.4. Respiratory rate Monitors
- 6.1.1. Consumer Wearables
- 6.2. Market Analysis, Insights and Forecast - by End-user
- 6.2.1. Hospitals and Clinics
- 6.2.2. Ambulatory and Health centers
- 6.2.3. Home care
- 6.1. Market Analysis, Insights and Forecast - by Product
- 7. Europe Vital Sign Monitoring Market Analysis, Insights and Forecast, 2019-2031
- 7.1. Market Analysis, Insights and Forecast - by Product
- 7.1.1. Consumer Wearables
- 7.1.1.1. Smartwatches
- 7.1.1.2. Fitness & Activity Trackers
- 7.1.1.3. Smart Patches
- 7.1.1.4. Other Wearables
- 7.1.2. Medical Device
- 7.1.2.1. Blood Pressure Monitors (Analog & Digital)
- 7.1.2.2. Pulse Oximeters (Fingertip, Handheld & Others)
- 7.1.2.3. Temperature Monitoring Device
- 7.1.2.4. Respiratory rate Monitors
- 7.1.1. Consumer Wearables
- 7.2. Market Analysis, Insights and Forecast - by End-user
- 7.2.1. Hospitals and Clinics
- 7.2.2. Ambulatory and Health centers
- 7.2.3. Home care
- 7.1. Market Analysis, Insights and Forecast - by Product
- 8. Asia Pacific Vital Sign Monitoring Market Analysis, Insights and Forecast, 2019-2031
- 8.1. Market Analysis, Insights and Forecast - by Product
- 8.1.1. Consumer Wearables
- 8.1.1.1. Smartwatches
- 8.1.1.2. Fitness & Activity Trackers
- 8.1.1.3. Smart Patches
- 8.1.1.4. Other Wearables
- 8.1.2. Medical Device
- 8.1.2.1. Blood Pressure Monitors (Analog & Digital)
- 8.1.2.2. Pulse Oximeters (Fingertip, Handheld & Others)
- 8.1.2.3. Temperature Monitoring Device
- 8.1.2.4. Respiratory rate Monitors
- 8.1.1. Consumer Wearables
- 8.2. Market Analysis, Insights and Forecast - by End-user
- 8.2.1. Hospitals and Clinics
- 8.2.2. Ambulatory and Health centers
- 8.2.3. Home care
- 8.1. Market Analysis, Insights and Forecast - by Product
- 9. Middle East and Africa Vital Sign Monitoring Market Analysis, Insights and Forecast, 2019-2031
- 9.1. Market Analysis, Insights and Forecast - by Product
- 9.1.1. Consumer Wearables
- 9.1.1.1. Smartwatches
- 9.1.1.2. Fitness & Activity Trackers
- 9.1.1.3. Smart Patches
- 9.1.1.4. Other Wearables
- 9.1.2. Medical Device
- 9.1.2.1. Blood Pressure Monitors (Analog & Digital)
- 9.1.2.2. Pulse Oximeters (Fingertip, Handheld & Others)
- 9.1.2.3. Temperature Monitoring Device
- 9.1.2.4. Respiratory rate Monitors
- 9.1.1. Consumer Wearables
- 9.2. Market Analysis, Insights and Forecast - by End-user
- 9.2.1. Hospitals and Clinics
- 9.2.2. Ambulatory and Health centers
- 9.2.3. Home care
- 9.1. Market Analysis, Insights and Forecast - by Product
- 10. South America Vital Sign Monitoring Market Analysis, Insights and Forecast, 2019-2031
- 10.1. Market Analysis, Insights and Forecast - by Product
- 10.1.1. Consumer Wearables
- 10.1.1.1. Smartwatches
- 10.1.1.2. Fitness & Activity Trackers
- 10.1.1.3. Smart Patches
- 10.1.1.4. Other Wearables
- 10.1.2. Medical Device
- 10.1.2.1. Blood Pressure Monitors (Analog & Digital)
- 10.1.2.2. Pulse Oximeters (Fingertip, Handheld & Others)
- 10.1.2.3. Temperature Monitoring Device
- 10.1.2.4. Respiratory rate Monitors
- 10.1.1. Consumer Wearables
- 10.2. Market Analysis, Insights and Forecast - by End-user
- 10.2.1. Hospitals and Clinics
- 10.2.2. Ambulatory and Health centers
- 10.2.3. Home care
- 10.1. Market Analysis, Insights and Forecast - by Product
- 11. North America Vital Sign Monitoring Market Analysis, Insights and Forecast, 2019-2031
- 11.1. Market Analysis, Insights and Forecast - By Country/Sub-region
- 11.1.1. undefined
- 12. Europe Vital Sign Monitoring Market Analysis, Insights and Forecast, 2019-2031
- 12.1. Market Analysis, Insights and Forecast - By Country/Sub-region
- 12.1.1. undefined
- 13. Asia Pacific Vital Sign Monitoring Market Analysis, Insights and Forecast, 2019-2031
- 13.1. Market Analysis, Insights and Forecast - By Country/Sub-region
- 13.1.1. undefined
- 14. Middle East and Africa Vital Sign Monitoring Market Analysis, Insights and Forecast, 2019-2031
- 14.1. Market Analysis, Insights and Forecast - By Country/Sub-region
- 14.1.1. undefined
- 15. South America Vital Sign Monitoring Market Analysis, Insights and Forecast, 2019-2031
- 15.1. Market Analysis, Insights and Forecast - By Country/Sub-region
- 15.1.1. undefined
- 16. Competitive Analysis
- 16.1. Global Market Share Analysis 2024
- 16.2. Company Profiles
- 16.2.1 iRhythm Technologies
- 16.2.1.1. Overview
- 16.2.1.2. Products
- 16.2.1.3. SWOT Analysis
- 16.2.1.4. Recent Developments
- 16.2.1.5. Financials (Based on Availability)
- 16.2.2 Masimo Corporation
- 16.2.2.1. Overview
- 16.2.2.2. Products
- 16.2.2.3. SWOT Analysis
- 16.2.2.4. Recent Developments
- 16.2.2.5. Financials (Based on Availability)
- 16.2.3 Koninklijke Philips N V
- 16.2.3.1. Overview
- 16.2.3.2. Products
- 16.2.3.3. SWOT Analysis
- 16.2.3.4. Recent Developments
- 16.2.3.5. Financials (Based on Availability)
- 16.2.4 GE Healthcare
- 16.2.4.1. Overview
- 16.2.4.2. Products
- 16.2.4.3. SWOT Analysis
- 16.2.4.4. Recent Developments
- 16.2.4.5. Financials (Based on Availability)
- 16.2.5 Mindray
- 16.2.5.1. Overview
- 16.2.5.2. Products
- 16.2.5.3. SWOT Analysis
- 16.2.5.4. Recent Developments
- 16.2.5.5. Financials (Based on Availability)
- 16.2.6 Medtronic PLC
- 16.2.6.1. Overview
- 16.2.6.2. Products
- 16.2.6.3. SWOT Analysis
- 16.2.6.4. Recent Developments
- 16.2.6.5. Financials (Based on Availability)
- 16.2.7 Contec Medical Systems Limited
- 16.2.7.1. Overview
- 16.2.7.2. Products
- 16.2.7.3. SWOT Analysis
- 16.2.7.4. Recent Developments
- 16.2.7.5. Financials (Based on Availability)
- 16.2.8 Omron Healthcare Inc
- 16.2.8.1. Overview
- 16.2.8.2. Products
- 16.2.8.3. SWOT Analysis
- 16.2.8.4. Recent Developments
- 16.2.8.5. Financials (Based on Availability)
- 16.2.9 Nihon Kohden Corporation
- 16.2.9.1. Overview
- 16.2.9.2. Products
- 16.2.9.3. SWOT Analysis
- 16.2.9.4. Recent Developments
- 16.2.9.5. Financials (Based on Availability)
- 16.2.10 BioBeat Technologies
- 16.2.10.1. Overview
- 16.2.10.2. Products
- 16.2.10.3. SWOT Analysis
- 16.2.10.4. Recent Developments
- 16.2.10.5. Financials (Based on Availability)
- 16.2.11 Apple Inc
- 16.2.11.1. Overview
- 16.2.11.2. Products
- 16.2.11.3. SWOT Analysis
- 16.2.11.4. Recent Developments
- 16.2.11.5. Financials (Based on Availability)
- 16.2.12 A&D Company Limited
- 16.2.12.1. Overview
- 16.2.12.2. Products
- 16.2.12.3. SWOT Analysis
- 16.2.12.4. Recent Developments
- 16.2.12.5. Financials (Based on Availability)
- 16.2.1 iRhythm Technologies
List of Figures
- Figure 1: Global Vital Sign Monitoring Market Revenue Breakdown (Million, %) by Region 2024 & 2032
- Figure 2: Global Vital Sign Monitoring Market Volume Breakdown (K Unit, %) by Region 2024 & 2032
- Figure 3: North America Vital Sign Monitoring Market Revenue (Million), by Country 2024 & 2032
- Figure 4: North America Vital Sign Monitoring Market Volume (K Unit), by Country 2024 & 2032
- Figure 5: North America Vital Sign Monitoring Market Revenue Share (%), by Country 2024 & 2032
- Figure 6: North America Vital Sign Monitoring Market Volume Share (%), by Country 2024 & 2032
- Figure 7: Europe Vital Sign Monitoring Market Revenue (Million), by Country 2024 & 2032
- Figure 8: Europe Vital Sign Monitoring Market Volume (K Unit), by Country 2024 & 2032
- Figure 9: Europe Vital Sign Monitoring Market Revenue Share (%), by Country 2024 & 2032
- Figure 10: Europe Vital Sign Monitoring Market Volume Share (%), by Country 2024 & 2032
- Figure 11: Asia Pacific Vital Sign Monitoring Market Revenue (Million), by Country 2024 & 2032
- Figure 12: Asia Pacific Vital Sign Monitoring Market Volume (K Unit), by Country 2024 & 2032
- Figure 13: Asia Pacific Vital Sign Monitoring Market Revenue Share (%), by Country 2024 & 2032
- Figure 14: Asia Pacific Vital Sign Monitoring Market Volume Share (%), by Country 2024 & 2032
- Figure 15: Middle East and Africa Vital Sign Monitoring Market Revenue (Million), by Country 2024 & 2032
- Figure 16: Middle East and Africa Vital Sign Monitoring Market Volume (K Unit), by Country 2024 & 2032
- Figure 17: Middle East and Africa Vital Sign Monitoring Market Revenue Share (%), by Country 2024 & 2032
- Figure 18: Middle East and Africa Vital Sign Monitoring Market Volume Share (%), by Country 2024 & 2032
- Figure 19: South America Vital Sign Monitoring Market Revenue (Million), by Country 2024 & 2032
- Figure 20: South America Vital Sign Monitoring Market Volume (K Unit), by Country 2024 & 2032
- Figure 21: South America Vital Sign Monitoring Market Revenue Share (%), by Country 2024 & 2032
- Figure 22: South America Vital Sign Monitoring Market Volume Share (%), by Country 2024 & 2032
- Figure 23: North America Vital Sign Monitoring Market Revenue (Million), by Product 2024 & 2032
- Figure 24: North America Vital Sign Monitoring Market Volume (K Unit), by Product 2024 & 2032
- Figure 25: North America Vital Sign Monitoring Market Revenue Share (%), by Product 2024 & 2032
- Figure 26: North America Vital Sign Monitoring Market Volume Share (%), by Product 2024 & 2032
- Figure 27: North America Vital Sign Monitoring Market Revenue (Million), by End-user 2024 & 2032
- Figure 28: North America Vital Sign Monitoring Market Volume (K Unit), by End-user 2024 & 2032
- Figure 29: North America Vital Sign Monitoring Market Revenue Share (%), by End-user 2024 & 2032
- Figure 30: North America Vital Sign Monitoring Market Volume Share (%), by End-user 2024 & 2032
- Figure 31: North America Vital Sign Monitoring Market Revenue (Million), by Country 2024 & 2032
- Figure 32: North America Vital Sign Monitoring Market Volume (K Unit), by Country 2024 & 2032
- Figure 33: North America Vital Sign Monitoring Market Revenue Share (%), by Country 2024 & 2032
- Figure 34: North America Vital Sign Monitoring Market Volume Share (%), by Country 2024 & 2032
- Figure 35: Europe Vital Sign Monitoring Market Revenue (Million), by Product 2024 & 2032
- Figure 36: Europe Vital Sign Monitoring Market Volume (K Unit), by Product 2024 & 2032
- Figure 37: Europe Vital Sign Monitoring Market Revenue Share (%), by Product 2024 & 2032
- Figure 38: Europe Vital Sign Monitoring Market Volume Share (%), by Product 2024 & 2032
- Figure 39: Europe Vital Sign Monitoring Market Revenue (Million), by End-user 2024 & 2032
- Figure 40: Europe Vital Sign Monitoring Market Volume (K Unit), by End-user 2024 & 2032
- Figure 41: Europe Vital Sign Monitoring Market Revenue Share (%), by End-user 2024 & 2032
- Figure 42: Europe Vital Sign Monitoring Market Volume Share (%), by End-user 2024 & 2032
- Figure 43: Europe Vital Sign Monitoring Market Revenue (Million), by Country 2024 & 2032
- Figure 44: Europe Vital Sign Monitoring Market Volume (K Unit), by Country 2024 & 2032
- Figure 45: Europe Vital Sign Monitoring Market Revenue Share (%), by Country 2024 & 2032
- Figure 46: Europe Vital Sign Monitoring Market Volume Share (%), by Country 2024 & 2032
- Figure 47: Asia Pacific Vital Sign Monitoring Market Revenue (Million), by Product 2024 & 2032
- Figure 48: Asia Pacific Vital Sign Monitoring Market Volume (K Unit), by Product 2024 & 2032
- Figure 49: Asia Pacific Vital Sign Monitoring Market Revenue Share (%), by Product 2024 & 2032
- Figure 50: Asia Pacific Vital Sign Monitoring Market Volume Share (%), by Product 2024 & 2032
- Figure 51: Asia Pacific Vital Sign Monitoring Market Revenue (Million), by End-user 2024 & 2032
- Figure 52: Asia Pacific Vital Sign Monitoring Market Volume (K Unit), by End-user 2024 & 2032
- Figure 53: Asia Pacific Vital Sign Monitoring Market Revenue Share (%), by End-user 2024 & 2032
- Figure 54: Asia Pacific Vital Sign Monitoring Market Volume Share (%), by End-user 2024 & 2032
- Figure 55: Asia Pacific Vital Sign Monitoring Market Revenue (Million), by Country 2024 & 2032
- Figure 56: Asia Pacific Vital Sign Monitoring Market Volume (K Unit), by Country 2024 & 2032
- Figure 57: Asia Pacific Vital Sign Monitoring Market Revenue Share (%), by Country 2024 & 2032
- Figure 58: Asia Pacific Vital Sign Monitoring Market Volume Share (%), by Country 2024 & 2032
- Figure 59: Middle East and Africa Vital Sign Monitoring Market Revenue (Million), by Product 2024 & 2032
- Figure 60: Middle East and Africa Vital Sign Monitoring Market Volume (K Unit), by Product 2024 & 2032
- Figure 61: Middle East and Africa Vital Sign Monitoring Market Revenue Share (%), by Product 2024 & 2032
- Figure 62: Middle East and Africa Vital Sign Monitoring Market Volume Share (%), by Product 2024 & 2032
- Figure 63: Middle East and Africa Vital Sign Monitoring Market Revenue (Million), by End-user 2024 & 2032
- Figure 64: Middle East and Africa Vital Sign Monitoring Market Volume (K Unit), by End-user 2024 & 2032
- Figure 65: Middle East and Africa Vital Sign Monitoring Market Revenue Share (%), by End-user 2024 & 2032
- Figure 66: Middle East and Africa Vital Sign Monitoring Market Volume Share (%), by End-user 2024 & 2032
- Figure 67: Middle East and Africa Vital Sign Monitoring Market Revenue (Million), by Country 2024 & 2032
- Figure 68: Middle East and Africa Vital Sign Monitoring Market Volume (K Unit), by Country 2024 & 2032
- Figure 69: Middle East and Africa Vital Sign Monitoring Market Revenue Share (%), by Country 2024 & 2032
- Figure 70: Middle East and Africa Vital Sign Monitoring Market Volume Share (%), by Country 2024 & 2032
- Figure 71: South America Vital Sign Monitoring Market Revenue (Million), by Product 2024 & 2032
- Figure 72: South America Vital Sign Monitoring Market Volume (K Unit), by Product 2024 & 2032
- Figure 73: South America Vital Sign Monitoring Market Revenue Share (%), by Product 2024 & 2032
- Figure 74: South America Vital Sign Monitoring Market Volume Share (%), by Product 2024 & 2032
- Figure 75: South America Vital Sign Monitoring Market Revenue (Million), by End-user 2024 & 2032
- Figure 76: South America Vital Sign Monitoring Market Volume (K Unit), by End-user 2024 & 2032
- Figure 77: South America Vital Sign Monitoring Market Revenue Share (%), by End-user 2024 & 2032
- Figure 78: South America Vital Sign Monitoring Market Volume Share (%), by End-user 2024 & 2032
- Figure 79: South America Vital Sign Monitoring Market Revenue (Million), by Country 2024 & 2032
- Figure 80: South America Vital Sign Monitoring Market Volume (K Unit), by Country 2024 & 2032
- Figure 81: South America Vital Sign Monitoring Market Revenue Share (%), by Country 2024 & 2032
- Figure 82: South America Vital Sign Monitoring Market Volume Share (%), by Country 2024 & 2032
List of Tables
- Table 1: Global Vital Sign Monitoring Market Revenue Million Forecast, by Region 2019 & 2032
- Table 2: Global Vital Sign Monitoring Market Volume K Unit Forecast, by Region 2019 & 2032
- Table 3: Global Vital Sign Monitoring Market Revenue Million Forecast, by Product 2019 & 2032
- Table 4: Global Vital Sign Monitoring Market Volume K Unit Forecast, by Product 2019 & 2032
- Table 5: Global Vital Sign Monitoring Market Revenue Million Forecast, by End-user 2019 & 2032
- Table 6: Global Vital Sign Monitoring Market Volume K Unit Forecast, by End-user 2019 & 2032
- Table 7: Global Vital Sign Monitoring Market Revenue Million Forecast, by Region 2019 & 2032
- Table 8: Global Vital Sign Monitoring Market Volume K Unit Forecast, by Region 2019 & 2032
- Table 9: Global Vital Sign Monitoring Market Revenue Million Forecast, by Country 2019 & 2032
- Table 10: Global Vital Sign Monitoring Market Volume K Unit Forecast, by Country 2019 & 2032
- Table 11: Global Vital Sign Monitoring Market Revenue Million Forecast, by Country 2019 & 2032
- Table 12: Global Vital Sign Monitoring Market Volume K Unit Forecast, by Country 2019 & 2032
- Table 13: Global Vital Sign Monitoring Market Revenue Million Forecast, by Country 2019 & 2032
- Table 14: Global Vital Sign Monitoring Market Volume K Unit Forecast, by Country 2019 & 2032
- Table 15: Global Vital Sign Monitoring Market Revenue Million Forecast, by Country 2019 & 2032
- Table 16: Global Vital Sign Monitoring Market Volume K Unit Forecast, by Country 2019 & 2032
- Table 17: Global Vital Sign Monitoring Market Revenue Million Forecast, by Country 2019 & 2032
- Table 18: Global Vital Sign Monitoring Market Volume K Unit Forecast, by Country 2019 & 2032
- Table 19: Global Vital Sign Monitoring Market Revenue Million Forecast, by Product 2019 & 2032
- Table 20: Global Vital Sign Monitoring Market Volume K Unit Forecast, by Product 2019 & 2032
- Table 21: Global Vital Sign Monitoring Market Revenue Million Forecast, by End-user 2019 & 2032
- Table 22: Global Vital Sign Monitoring Market Volume K Unit Forecast, by End-user 2019 & 2032
- Table 23: Global Vital Sign Monitoring Market Revenue Million Forecast, by Country 2019 & 2032
- Table 24: Global Vital Sign Monitoring Market Volume K Unit Forecast, by Country 2019 & 2032
- Table 25: United States Vital Sign Monitoring Market Revenue (Million) Forecast, by Application 2019 & 2032
- Table 26: United States Vital Sign Monitoring Market Volume (K Unit) Forecast, by Application 2019 & 2032
- Table 27: Canada Vital Sign Monitoring Market Revenue (Million) Forecast, by Application 2019 & 2032
- Table 28: Canada Vital Sign Monitoring Market Volume (K Unit) Forecast, by Application 2019 & 2032
- Table 29: Mexico Vital Sign Monitoring Market Revenue (Million) Forecast, by Application 2019 & 2032
- Table 30: Mexico Vital Sign Monitoring Market Volume (K Unit) Forecast, by Application 2019 & 2032
- Table 31: Global Vital Sign Monitoring Market Revenue Million Forecast, by Product 2019 & 2032
- Table 32: Global Vital Sign Monitoring Market Volume K Unit Forecast, by Product 2019 & 2032
- Table 33: Global Vital Sign Monitoring Market Revenue Million Forecast, by End-user 2019 & 2032
- Table 34: Global Vital Sign Monitoring Market Volume K Unit Forecast, by End-user 2019 & 2032
- Table 35: Global Vital Sign Monitoring Market Revenue Million Forecast, by Country 2019 & 2032
- Table 36: Global Vital Sign Monitoring Market Volume K Unit Forecast, by Country 2019 & 2032
- Table 37: Germany Vital Sign Monitoring Market Revenue (Million) Forecast, by Application 2019 & 2032
- Table 38: Germany Vital Sign Monitoring Market Volume (K Unit) Forecast, by Application 2019 & 2032
- Table 39: United Kingdom Vital Sign Monitoring Market Revenue (Million) Forecast, by Application 2019 & 2032
- Table 40: United Kingdom Vital Sign Monitoring Market Volume (K Unit) Forecast, by Application 2019 & 2032
- Table 41: France Vital Sign Monitoring Market Revenue (Million) Forecast, by Application 2019 & 2032
- Table 42: France Vital Sign Monitoring Market Volume (K Unit) Forecast, by Application 2019 & 2032
- Table 43: Italy Vital Sign Monitoring Market Revenue (Million) Forecast, by Application 2019 & 2032
- Table 44: Italy Vital Sign Monitoring Market Volume (K Unit) Forecast, by Application 2019 & 2032
- Table 45: Spain Vital Sign Monitoring Market Revenue (Million) Forecast, by Application 2019 & 2032
- Table 46: Spain Vital Sign Monitoring Market Volume (K Unit) Forecast, by Application 2019 & 2032
- Table 47: Rest of Europe Vital Sign Monitoring Market Revenue (Million) Forecast, by Application 2019 & 2032
- Table 48: Rest of Europe Vital Sign Monitoring Market Volume (K Unit) Forecast, by Application 2019 & 2032
- Table 49: Global Vital Sign Monitoring Market Revenue Million Forecast, by Product 2019 & 2032
- Table 50: Global Vital Sign Monitoring Market Volume K Unit Forecast, by Product 2019 & 2032
- Table 51: Global Vital Sign Monitoring Market Revenue Million Forecast, by End-user 2019 & 2032
- Table 52: Global Vital Sign Monitoring Market Volume K Unit Forecast, by End-user 2019 & 2032
- Table 53: Global Vital Sign Monitoring Market Revenue Million Forecast, by Country 2019 & 2032
- Table 54: Global Vital Sign Monitoring Market Volume K Unit Forecast, by Country 2019 & 2032
- Table 55: China Vital Sign Monitoring Market Revenue (Million) Forecast, by Application 2019 & 2032
- Table 56: China Vital Sign Monitoring Market Volume (K Unit) Forecast, by Application 2019 & 2032
- Table 57: Japan Vital Sign Monitoring Market Revenue (Million) Forecast, by Application 2019 & 2032
- Table 58: Japan Vital Sign Monitoring Market Volume (K Unit) Forecast, by Application 2019 & 2032
- Table 59: India Vital Sign Monitoring Market Revenue (Million) Forecast, by Application 2019 & 2032
- Table 60: India Vital Sign Monitoring Market Volume (K Unit) Forecast, by Application 2019 & 2032
- Table 61: Australia Vital Sign Monitoring Market Revenue (Million) Forecast, by Application 2019 & 2032
- Table 62: Australia Vital Sign Monitoring Market Volume (K Unit) Forecast, by Application 2019 & 2032
- Table 63: South Korea Vital Sign Monitoring Market Revenue (Million) Forecast, by Application 2019 & 2032
- Table 64: South Korea Vital Sign Monitoring Market Volume (K Unit) Forecast, by Application 2019 & 2032
- Table 65: Rest of Asia Pacific Vital Sign Monitoring Market Revenue (Million) Forecast, by Application 2019 & 2032
- Table 66: Rest of Asia Pacific Vital Sign Monitoring Market Volume (K Unit) Forecast, by Application 2019 & 2032
- Table 67: Global Vital Sign Monitoring Market Revenue Million Forecast, by Product 2019 & 2032
- Table 68: Global Vital Sign Monitoring Market Volume K Unit Forecast, by Product 2019 & 2032
- Table 69: Global Vital Sign Monitoring Market Revenue Million Forecast, by End-user 2019 & 2032
- Table 70: Global Vital Sign Monitoring Market Volume K Unit Forecast, by End-user 2019 & 2032
- Table 71: Global Vital Sign Monitoring Market Revenue Million Forecast, by Country 2019 & 2032
- Table 72: Global Vital Sign Monitoring Market Volume K Unit Forecast, by Country 2019 & 2032
- Table 73: GCC Vital Sign Monitoring Market Revenue (Million) Forecast, by Application 2019 & 2032
- Table 74: GCC Vital Sign Monitoring Market Volume (K Unit) Forecast, by Application 2019 & 2032
- Table 75: South Africa Vital Sign Monitoring Market Revenue (Million) Forecast, by Application 2019 & 2032
- Table 76: South Africa Vital Sign Monitoring Market Volume (K Unit) Forecast, by Application 2019 & 2032
- Table 77: Rest of Middle East and Africa Vital Sign Monitoring Market Revenue (Million) Forecast, by Application 2019 & 2032
- Table 78: Rest of Middle East and Africa Vital Sign Monitoring Market Volume (K Unit) Forecast, by Application 2019 & 2032
- Table 79: Global Vital Sign Monitoring Market Revenue Million Forecast, by Product 2019 & 2032
- Table 80: Global Vital Sign Monitoring Market Volume K Unit Forecast, by Product 2019 & 2032
- Table 81: Global Vital Sign Monitoring Market Revenue Million Forecast, by End-user 2019 & 2032
- Table 82: Global Vital Sign Monitoring Market Volume K Unit Forecast, by End-user 2019 & 2032
- Table 83: Global Vital Sign Monitoring Market Revenue Million Forecast, by Country 2019 & 2032
- Table 84: Global Vital Sign Monitoring Market Volume K Unit Forecast, by Country 2019 & 2032
- Table 85: Brazil Vital Sign Monitoring Market Revenue (Million) Forecast, by Application 2019 & 2032
- Table 86: Brazil Vital Sign Monitoring Market Volume (K Unit) Forecast, by Application 2019 & 2032
- Table 87: Argentina Vital Sign Monitoring Market Revenue (Million) Forecast, by Application 2019 & 2032
- Table 88: Argentina Vital Sign Monitoring Market Volume (K Unit) Forecast, by Application 2019 & 2032
- Table 89: Rest of South America Vital Sign Monitoring Market Revenue (Million) Forecast, by Application 2019 & 2032
- Table 90: Rest of South America Vital Sign Monitoring Market Volume (K Unit) Forecast, by Application 2019 & 2032
Frequently Asked Questions
1. What is the projected Compound Annual Growth Rate (CAGR) of the Vital Sign Monitoring Market?
The projected CAGR is approximately 15.74%.
2. Which companies are prominent players in the Vital Sign Monitoring Market?
Key companies in the market include iRhythm Technologies, Masimo Corporation, Koninklijke Philips N V, GE Healthcare, Mindray, Medtronic PLC, Contec Medical Systems Limited, Omron Healthcare Inc, Nihon Kohden Corporation, BioBeat Technologies, Apple Inc, A&D Company Limited.
3. What are the main segments of the Vital Sign Monitoring Market?
The market segments include Product, End-user.
4. Can you provide details about the market size?
The market size is estimated to be USD 13.39 Million as of 2022.
5. What are some drivers contributing to market growth?
Increasing prevalence of Chronic Diseases; Recent Technological Innovations (at the component level) and the Fast-Tracking of Regulatory Approvals in the Field of Wearables; Growth in Demand for Home Care Monitoring.
6. What are the notable trends driving market growth?
Hospitals and Clinics Segment is Expected to Hold a Significant Share in the Market Over the Forecast Period.
7. Are there any restraints impacting market growth?
User Readiness and Unresponsiveness of Some Monitoring Devices; Competitive Pricing Pressure and Presence of Counterfeit Products.
8. Can you provide examples of recent developments in the market?
In April 2022, Anelto Inc, one of the leading providers of Remote Patient Monitoring (RPM) solutions, partnered with BioIntelliSense, Inc., a continuous health monitoring and clinical intelligence company, to integrate BioIntelliSense's FDA-cleared BioSticker and BioButton wearable medical devices and data services with Anelto's RemoteCareLive! RPM platform.
9. What pricing options are available for accessing the report?
Pricing options include single-user, multi-user, and enterprise licenses priced at USD 4750, USD 5250, and USD 8750 respectively.
10. Is the market size provided in terms of value or volume?
The market size is provided in terms of value, measured in Million and volume, measured in K Unit.
11. Are there any specific market keywords associated with the report?
Yes, the market keyword associated with the report is "Vital Sign Monitoring Market," which aids in identifying and referencing the specific market segment covered.
12. How do I determine which pricing option suits my needs best?
The pricing options vary based on user requirements and access needs. Individual users may opt for single-user licenses, while businesses requiring broader access may choose multi-user or enterprise licenses for cost-effective access to the report.
13. Are there any additional resources or data provided in the Vital Sign Monitoring Market report?
While the report offers comprehensive insights, it's advisable to review the specific contents or supplementary materials provided to ascertain if additional resources or data are available.
14. How can I stay updated on further developments or reports in the Vital Sign Monitoring Market?
To stay informed about further developments, trends, and reports in the Vital Sign Monitoring Market, consider subscribing to industry newsletters, following relevant companies and organizations, or regularly checking reputable industry news sources and publications.
Methodology
Step 1 - Identification of Relevant Samples Size from Population Database


Step 2 - Approaches for Defining Global Market Size (Value, Volume* & Price*)

Note*: In applicable scenarios
Step 3 - Data Sources
Primary Research
- Web Analytics
- Survey Reports
- Research Institute
- Latest Research Reports
- Opinion Leaders
Secondary Research
- Annual Reports
- White Paper
- Latest Press Release
- Industry Association
- Paid Database
- Investor Presentations

Step 4 - Data Triangulation
Involves using different sources of information in order to increase the validity of a study
These sources are likely to be stakeholders in a program - participants, other researchers, program staff, other community members, and so on.
Then we put all data in single framework & apply various statistical tools to find out the dynamic on the market.
During the analysis stage, feedback from the stakeholder groups would be compared to determine areas of agreement as well as areas of divergence


