
Key Insights
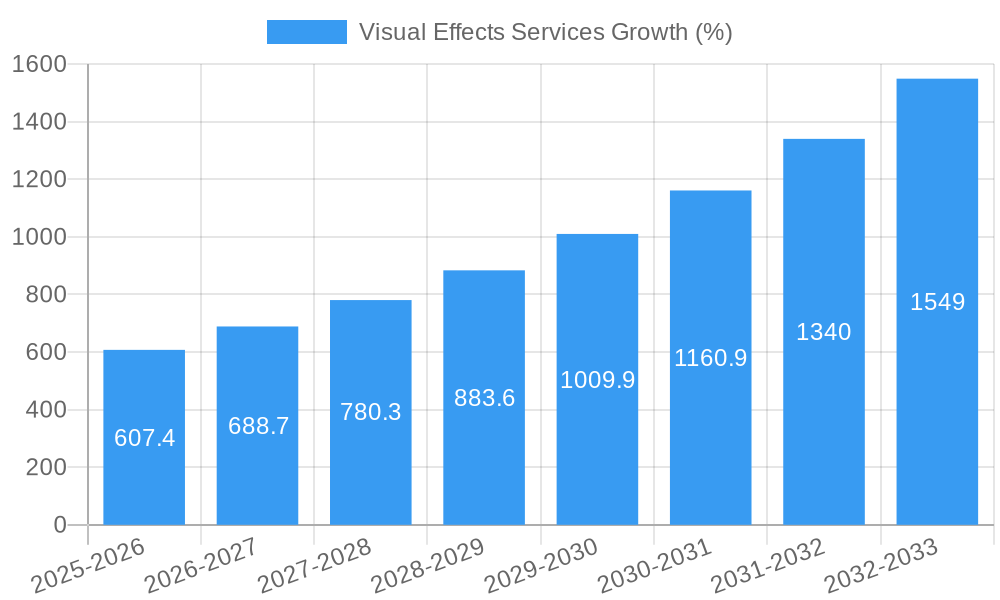
The visual effects (VFX) services market is experiencing robust growth, projected to reach a substantial size. The market's Compound Annual Growth Rate (CAGR) of 12.4% from 2019 to 2024 indicates a significant expansion driven by several factors. The increasing demand for high-quality VFX in movies, television series, video games, and advertising fuels this expansion. Technological advancements, such as improved rendering techniques, AI-powered tools, and virtual production methods, are further accelerating market growth. Furthermore, the rising adoption of streaming platforms and the expansion of the global entertainment industry contribute to increased demand for VFX services. The market is also witnessing a shift towards cloud-based VFX solutions, offering scalability and cost-effectiveness for studios of all sizes.
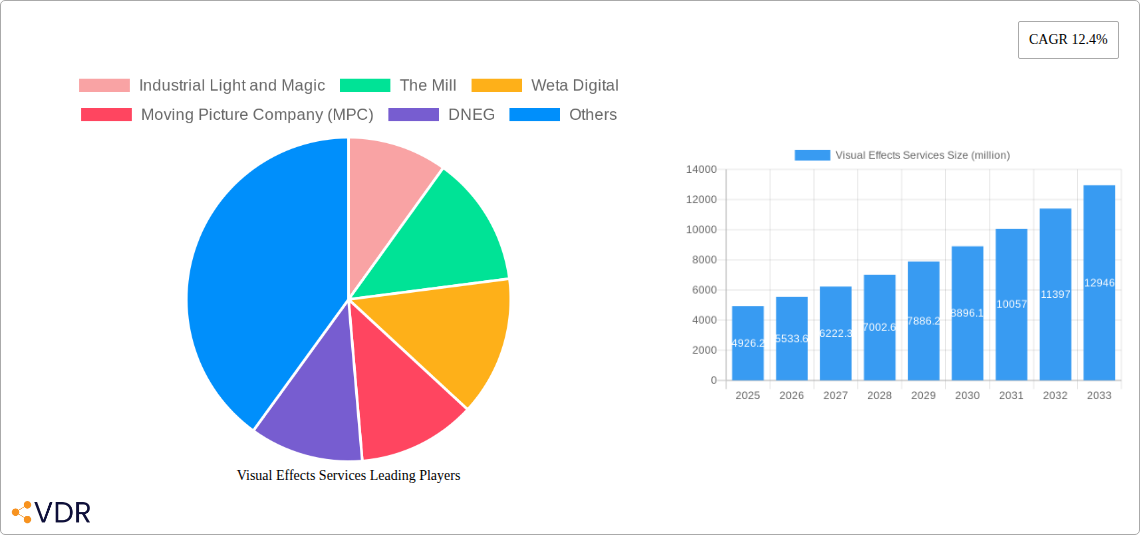
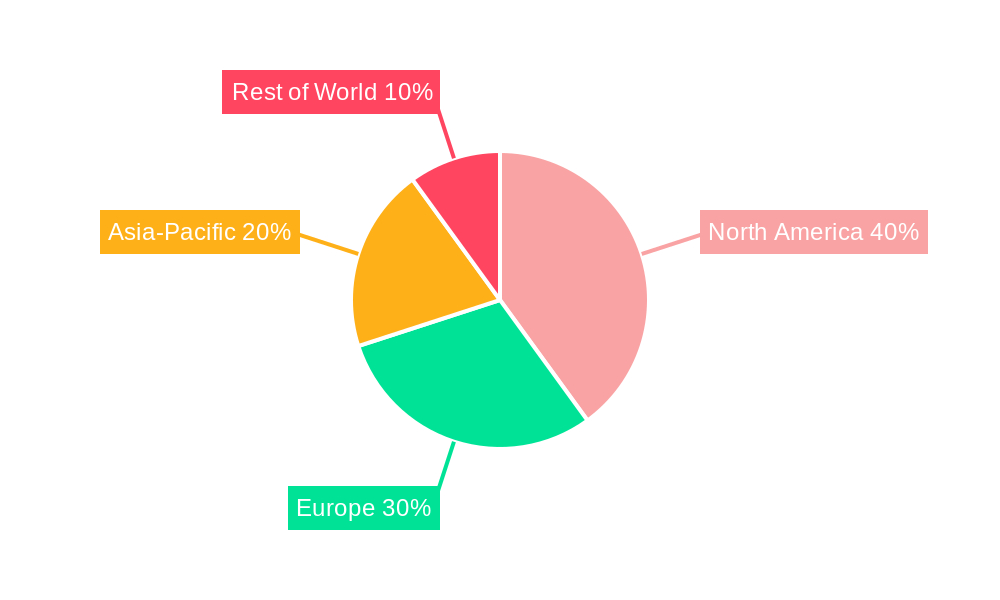
However, the VFX industry also faces challenges. The high cost of production, skilled labor shortages, and intense competition among VFX studios are key constraints on growth. Nevertheless, the ongoing evolution of technology and persistent high demand suggest that the market will continue its upward trajectory. The major players, including Industrial Light and Magic, The Mill, Weta Digital, and others, are strategically investing in R&D and acquiring smaller studios to strengthen their market positions and meet the escalating demand for innovative and complex VFX. The market is segmented based on service type (2D/3D animation, compositing, modeling, etc.), application (film, television, advertising, gaming), and geography. While precise regional breakdowns aren't provided, North America and Europe are likely to hold significant market shares given the concentration of major studios and production houses in these regions. The forecast period (2025-2033) anticipates continued strong growth, driven by the aforementioned factors, making the VFX services market an attractive investment opportunity.
Visual Effects Services Market Report: 2019-2033
This comprehensive report provides a detailed analysis of the global Visual Effects (VFX) services market, encompassing market dynamics, growth trends, regional dominance, product landscape, key players, and future outlook. The study period covers 2019-2033, with a base year of 2025 and a forecast period of 2025-2033. The report leverages extensive data and analysis to provide actionable insights for industry professionals, investors, and stakeholders. The total market size is projected to reach xx million by 2033.
Visual Effects Services Market Dynamics & Structure
The VFX services market is characterized by a moderately concentrated structure, with a few dominant players and numerous smaller, specialized firms. Technological innovation, driven by advancements in software, hardware, and AI, is a key driver. Regulatory frameworks, particularly concerning intellectual property and data privacy, play a significant role. The market witnesses continuous product substitution, with new rendering techniques and software constantly emerging. End-users predominantly include film studios, television broadcasters, advertising agencies, and video game developers. Mergers and acquisitions (M&A) are frequent, reflecting consolidation and expansion strategies.
- Market Concentration: The top 5 players hold an estimated xx% market share in 2025.
- Technological Innovation: Advancements in real-time rendering, AI-powered tools, and cloud-based workflows are transforming the industry.
- M&A Activity: An average of xx M&A deals were recorded annually during 2019-2024, with deal values totaling xx million.
- Regulatory Landscape: Compliance with data privacy regulations (GDPR, CCPA) and intellectual property rights is crucial.
- Innovation Barriers: High initial investment costs for software and hardware can hinder entry for smaller firms.
Visual Effects Services Growth Trends & Insights
The global VFX services market experienced significant growth during the historical period (2019-2024), driven by increased demand from the entertainment and advertising sectors. The market size reached xx million in 2024, exhibiting a CAGR of xx% during this period. Technological disruptions, such as the rise of real-time rendering and AI-driven tools, are accelerating market expansion. Consumer preference for high-quality visual content fuels demand across various platforms, including streaming services and video games. The adoption rate of advanced VFX technologies is steadily increasing, further driving market growth. The forecast period (2025-2033) is expected to witness a CAGR of xx%, with market penetration reaching xx% by 2033.
Dominant Regions, Countries, or Segments in Visual Effects Services
North America (primarily the US) remains the dominant region in the VFX services market, driven by a robust entertainment industry, established VFX studios, and advanced technological infrastructure. Asia-Pacific, particularly India and China, is a rapidly growing segment due to increasing production volumes and a large pool of skilled VFX artists. Europe also holds a significant market share, with strong VFX hubs in the UK and other countries.
- North America: High concentration of major VFX studios, strong technological advancements, and high demand for high-quality VFX.
- Asia-Pacific: Rapid growth fueled by rising production volumes, a burgeoning talent pool, and cost-effectiveness.
- Europe: Established VFX industry with specialized expertise, particularly in film and television.
Visual Effects Services Product Landscape
The VFX services market offers a wide range of services, including visual effects compositing, 3D modeling and animation, motion capture, and virtual production. Significant product innovations include real-time rendering engines, AI-powered tools for automated tasks, and cloud-based platforms enabling collaborative workflows. These advancements enhance efficiency, reduce production costs, and improve the overall quality of visual effects. Unique selling propositions for VFX companies often include specialized expertise, proprietary software, and established relationships with major studios.
Key Drivers, Barriers & Challenges in Visual Effects Services
Key Drivers:
- Increased demand from the entertainment industry (film, television, streaming).
- Advancements in technology (AI, real-time rendering, cloud computing).
- Growing adoption of VFX in advertising and video games.
Challenges & Restraints:
- High production costs and specialized skill requirements.
- Intense competition among VFX studios.
- Dependence on large-scale projects and potential budget constraints.
- Maintaining data security and intellectual property rights.
Emerging Opportunities in Visual Effects Services
- Growing demand for immersive experiences (VR, AR, XR).
- Expansion into new markets (e.g., virtual production for live events).
- Development of new VFX tools and techniques (e.g., AI-powered character animation).
- Increased focus on sustainability and ethical practices within the industry.
Growth Accelerators in the Visual Effects Services Industry
Technological breakthroughs, strategic partnerships between VFX companies and technology providers, and expansion into new markets (virtual production, AR/VR) are key catalysts for long-term market growth. The increasing adoption of cloud-based workflows and AI-powered tools will further enhance efficiency and reduce production costs.
Key Players Shaping the Visual Effects Services Market
- Industrial Light and Magic
- The Mill
- Weta Digital
- Moving Picture Company (MPC)
- DNEG
- Sony Pictures Imageworks
- Cinesite
- Digital Domain
- Deluxe Entertainment
- Framestore
- Animal Logic
- Pixomondo
- Digital Idea
- Tippett Studio
- Flatworld Solutions Pvt
- Method Studios
- BUF
- Scanline vfx
- TNG Visual Effects
Notable Milestones in Visual Effects Services Sector
- 2020: Increased adoption of cloud-based VFX pipelines due to remote work needs.
- 2021: Several major VFX studios invested heavily in AI-powered tools.
- 2022: Significant advancements in real-time rendering technology for virtual production.
- 2023: Several mergers and acquisitions among mid-sized VFX companies.
- 2024: Growing use of virtual production techniques across various media.
In-Depth Visual Effects Services Market Outlook
The future of the VFX services market is bright, driven by continuous technological advancements, increasing demand for high-quality visual content, and the expansion into new applications such as AR/VR and virtual production. Strategic partnerships, investment in talent development, and focus on innovation will be crucial for companies to capitalize on the long-term growth opportunities within this dynamic market. The market is projected to witness strong growth, with substantial expansion across various regions and segments in the coming decade.
Visual Effects Services Segmentation
-
1. Application
- 1.1. Television
- 1.2. Film
- 1.3. Video Game
- 1.4. Others
-
2. Types
- 2.1. Special Effects
- 2.2. Digital Effects
Visual Effects Services Segmentation By Geography
-
1. North America
- 1.1. United States
- 1.2. Canada
- 1.3. Mexico
-
2. South America
- 2.1. Brazil
- 2.2. Argentina
- 2.3. Rest of South America
-
3. Europe
- 3.1. United Kingdom
- 3.2. Germany
- 3.3. France
- 3.4. Italy
- 3.5. Spain
- 3.6. Russia
- 3.7. Benelux
- 3.8. Nordics
- 3.9. Rest of Europe
-
4. Middle East & Africa
- 4.1. Turkey
- 4.2. Israel
- 4.3. GCC
- 4.4. North Africa
- 4.5. South Africa
- 4.6. Rest of Middle East & Africa
-
5. Asia Pacific
- 5.1. China
- 5.2. India
- 5.3. Japan
- 5.4. South Korea
- 5.5. ASEAN
- 5.6. Oceania
- 5.7. Rest of Asia Pacific
Visual Effects Services REPORT HIGHLIGHTS
| Aspects | Details |
|---|---|
| Study Period | 2019-2033 |
| Base Year | 2024 |
| Estimated Year | 2025 |
| Forecast Period | 2025-2033 |
| Historical Period | 2019-2024 |
| Growth Rate | CAGR of 12.4% from 2019-2033 |
| Segmentation |
|
Table of Contents
- 1. Introduction
- 1.1. Research Scope
- 1.2. Market Segmentation
- 1.3. Research Methodology
- 1.4. Definitions and Assumptions
- 2. Executive Summary
- 2.1. Introduction
- 3. Market Dynamics
- 3.1. Introduction
- 3.2. Market Drivers
- 3.3. Market Restrains
- 3.4. Market Trends
- 4. Market Factor Analysis
- 4.1. Porters Five Forces
- 4.2. Supply/Value Chain
- 4.3. PESTEL analysis
- 4.4. Market Entropy
- 4.5. Patent/Trademark Analysis
- 5. Global Visual Effects Services Analysis, Insights and Forecast, 2019-2031
- 5.1. Market Analysis, Insights and Forecast - by Application
- 5.1.1. Television
- 5.1.2. Film
- 5.1.3. Video Game
- 5.1.4. Others
- 5.2. Market Analysis, Insights and Forecast - by Types
- 5.2.1. Special Effects
- 5.2.2. Digital Effects
- 5.3. Market Analysis, Insights and Forecast - by Region
- 5.3.1. North America
- 5.3.2. South America
- 5.3.3. Europe
- 5.3.4. Middle East & Africa
- 5.3.5. Asia Pacific
- 5.1. Market Analysis, Insights and Forecast - by Application
- 6. North America Visual Effects Services Analysis, Insights and Forecast, 2019-2031
- 6.1. Market Analysis, Insights and Forecast - by Application
- 6.1.1. Television
- 6.1.2. Film
- 6.1.3. Video Game
- 6.1.4. Others
- 6.2. Market Analysis, Insights and Forecast - by Types
- 6.2.1. Special Effects
- 6.2.2. Digital Effects
- 6.1. Market Analysis, Insights and Forecast - by Application
- 7. South America Visual Effects Services Analysis, Insights and Forecast, 2019-2031
- 7.1. Market Analysis, Insights and Forecast - by Application
- 7.1.1. Television
- 7.1.2. Film
- 7.1.3. Video Game
- 7.1.4. Others
- 7.2. Market Analysis, Insights and Forecast - by Types
- 7.2.1. Special Effects
- 7.2.2. Digital Effects
- 7.1. Market Analysis, Insights and Forecast - by Application
- 8. Europe Visual Effects Services Analysis, Insights and Forecast, 2019-2031
- 8.1. Market Analysis, Insights and Forecast - by Application
- 8.1.1. Television
- 8.1.2. Film
- 8.1.3. Video Game
- 8.1.4. Others
- 8.2. Market Analysis, Insights and Forecast - by Types
- 8.2.1. Special Effects
- 8.2.2. Digital Effects
- 8.1. Market Analysis, Insights and Forecast - by Application
- 9. Middle East & Africa Visual Effects Services Analysis, Insights and Forecast, 2019-2031
- 9.1. Market Analysis, Insights and Forecast - by Application
- 9.1.1. Television
- 9.1.2. Film
- 9.1.3. Video Game
- 9.1.4. Others
- 9.2. Market Analysis, Insights and Forecast - by Types
- 9.2.1. Special Effects
- 9.2.2. Digital Effects
- 9.1. Market Analysis, Insights and Forecast - by Application
- 10. Asia Pacific Visual Effects Services Analysis, Insights and Forecast, 2019-2031
- 10.1. Market Analysis, Insights and Forecast - by Application
- 10.1.1. Television
- 10.1.2. Film
- 10.1.3. Video Game
- 10.1.4. Others
- 10.2. Market Analysis, Insights and Forecast - by Types
- 10.2.1. Special Effects
- 10.2.2. Digital Effects
- 10.1. Market Analysis, Insights and Forecast - by Application
- 11. Competitive Analysis
- 11.1. Global Market Share Analysis 2024
- 11.2. Company Profiles
- 11.2.1 Industrial Light and Magic
- 11.2.1.1. Overview
- 11.2.1.2. Products
- 11.2.1.3. SWOT Analysis
- 11.2.1.4. Recent Developments
- 11.2.1.5. Financials (Based on Availability)
- 11.2.2 The Mill
- 11.2.2.1. Overview
- 11.2.2.2. Products
- 11.2.2.3. SWOT Analysis
- 11.2.2.4. Recent Developments
- 11.2.2.5. Financials (Based on Availability)
- 11.2.3 Weta Digital
- 11.2.3.1. Overview
- 11.2.3.2. Products
- 11.2.3.3. SWOT Analysis
- 11.2.3.4. Recent Developments
- 11.2.3.5. Financials (Based on Availability)
- 11.2.4 Moving Picture Company (MPC)
- 11.2.4.1. Overview
- 11.2.4.2. Products
- 11.2.4.3. SWOT Analysis
- 11.2.4.4. Recent Developments
- 11.2.4.5. Financials (Based on Availability)
- 11.2.5 DNEG
- 11.2.5.1. Overview
- 11.2.5.2. Products
- 11.2.5.3. SWOT Analysis
- 11.2.5.4. Recent Developments
- 11.2.5.5. Financials (Based on Availability)
- 11.2.6 Sony Pictures Imageworks
- 11.2.6.1. Overview
- 11.2.6.2. Products
- 11.2.6.3. SWOT Analysis
- 11.2.6.4. Recent Developments
- 11.2.6.5. Financials (Based on Availability)
- 11.2.7 Cinesite
- 11.2.7.1. Overview
- 11.2.7.2. Products
- 11.2.7.3. SWOT Analysis
- 11.2.7.4. Recent Developments
- 11.2.7.5. Financials (Based on Availability)
- 11.2.8 Digital Domain
- 11.2.8.1. Overview
- 11.2.8.2. Products
- 11.2.8.3. SWOT Analysis
- 11.2.8.4. Recent Developments
- 11.2.8.5. Financials (Based on Availability)
- 11.2.9 Deluxe Entertainment
- 11.2.9.1. Overview
- 11.2.9.2. Products
- 11.2.9.3. SWOT Analysis
- 11.2.9.4. Recent Developments
- 11.2.9.5. Financials (Based on Availability)
- 11.2.10 Framestore
- 11.2.10.1. Overview
- 11.2.10.2. Products
- 11.2.10.3. SWOT Analysis
- 11.2.10.4. Recent Developments
- 11.2.10.5. Financials (Based on Availability)
- 11.2.11 Animal Logic
- 11.2.11.1. Overview
- 11.2.11.2. Products
- 11.2.11.3. SWOT Analysis
- 11.2.11.4. Recent Developments
- 11.2.11.5. Financials (Based on Availability)
- 11.2.12 Pixomondo
- 11.2.12.1. Overview
- 11.2.12.2. Products
- 11.2.12.3. SWOT Analysis
- 11.2.12.4. Recent Developments
- 11.2.12.5. Financials (Based on Availability)
- 11.2.13 Digital Idea
- 11.2.13.1. Overview
- 11.2.13.2. Products
- 11.2.13.3. SWOT Analysis
- 11.2.13.4. Recent Developments
- 11.2.13.5. Financials (Based on Availability)
- 11.2.14 Tippett Studio
- 11.2.14.1. Overview
- 11.2.14.2. Products
- 11.2.14.3. SWOT Analysis
- 11.2.14.4. Recent Developments
- 11.2.14.5. Financials (Based on Availability)
- 11.2.15 Flatworld Solutions Pvt
- 11.2.15.1. Overview
- 11.2.15.2. Products
- 11.2.15.3. SWOT Analysis
- 11.2.15.4. Recent Developments
- 11.2.15.5. Financials (Based on Availability)
- 11.2.16 Method Studios
- 11.2.16.1. Overview
- 11.2.16.2. Products
- 11.2.16.3. SWOT Analysis
- 11.2.16.4. Recent Developments
- 11.2.16.5. Financials (Based on Availability)
- 11.2.17 BUF
- 11.2.17.1. Overview
- 11.2.17.2. Products
- 11.2.17.3. SWOT Analysis
- 11.2.17.4. Recent Developments
- 11.2.17.5. Financials (Based on Availability)
- 11.2.18 Scanline vfx
- 11.2.18.1. Overview
- 11.2.18.2. Products
- 11.2.18.3. SWOT Analysis
- 11.2.18.4. Recent Developments
- 11.2.18.5. Financials (Based on Availability)
- 11.2.19 TNG Visual Effects
- 11.2.19.1. Overview
- 11.2.19.2. Products
- 11.2.19.3. SWOT Analysis
- 11.2.19.4. Recent Developments
- 11.2.19.5. Financials (Based on Availability)
- 11.2.1 Industrial Light and Magic
List of Figures
- Figure 1: Global Visual Effects Services Revenue Breakdown (million, %) by Region 2024 & 2032
- Figure 2: North America Visual Effects Services Revenue (million), by Application 2024 & 2032
- Figure 3: North America Visual Effects Services Revenue Share (%), by Application 2024 & 2032
- Figure 4: North America Visual Effects Services Revenue (million), by Types 2024 & 2032
- Figure 5: North America Visual Effects Services Revenue Share (%), by Types 2024 & 2032
- Figure 6: North America Visual Effects Services Revenue (million), by Country 2024 & 2032
- Figure 7: North America Visual Effects Services Revenue Share (%), by Country 2024 & 2032
- Figure 8: South America Visual Effects Services Revenue (million), by Application 2024 & 2032
- Figure 9: South America Visual Effects Services Revenue Share (%), by Application 2024 & 2032
- Figure 10: South America Visual Effects Services Revenue (million), by Types 2024 & 2032
- Figure 11: South America Visual Effects Services Revenue Share (%), by Types 2024 & 2032
- Figure 12: South America Visual Effects Services Revenue (million), by Country 2024 & 2032
- Figure 13: South America Visual Effects Services Revenue Share (%), by Country 2024 & 2032
- Figure 14: Europe Visual Effects Services Revenue (million), by Application 2024 & 2032
- Figure 15: Europe Visual Effects Services Revenue Share (%), by Application 2024 & 2032
- Figure 16: Europe Visual Effects Services Revenue (million), by Types 2024 & 2032
- Figure 17: Europe Visual Effects Services Revenue Share (%), by Types 2024 & 2032
- Figure 18: Europe Visual Effects Services Revenue (million), by Country 2024 & 2032
- Figure 19: Europe Visual Effects Services Revenue Share (%), by Country 2024 & 2032
- Figure 20: Middle East & Africa Visual Effects Services Revenue (million), by Application 2024 & 2032
- Figure 21: Middle East & Africa Visual Effects Services Revenue Share (%), by Application 2024 & 2032
- Figure 22: Middle East & Africa Visual Effects Services Revenue (million), by Types 2024 & 2032
- Figure 23: Middle East & Africa Visual Effects Services Revenue Share (%), by Types 2024 & 2032
- Figure 24: Middle East & Africa Visual Effects Services Revenue (million), by Country 2024 & 2032
- Figure 25: Middle East & Africa Visual Effects Services Revenue Share (%), by Country 2024 & 2032
- Figure 26: Asia Pacific Visual Effects Services Revenue (million), by Application 2024 & 2032
- Figure 27: Asia Pacific Visual Effects Services Revenue Share (%), by Application 2024 & 2032
- Figure 28: Asia Pacific Visual Effects Services Revenue (million), by Types 2024 & 2032
- Figure 29: Asia Pacific Visual Effects Services Revenue Share (%), by Types 2024 & 2032
- Figure 30: Asia Pacific Visual Effects Services Revenue (million), by Country 2024 & 2032
- Figure 31: Asia Pacific Visual Effects Services Revenue Share (%), by Country 2024 & 2032
List of Tables
- Table 1: Global Visual Effects Services Revenue million Forecast, by Region 2019 & 2032
- Table 2: Global Visual Effects Services Revenue million Forecast, by Application 2019 & 2032
- Table 3: Global Visual Effects Services Revenue million Forecast, by Types 2019 & 2032
- Table 4: Global Visual Effects Services Revenue million Forecast, by Region 2019 & 2032
- Table 5: Global Visual Effects Services Revenue million Forecast, by Application 2019 & 2032
- Table 6: Global Visual Effects Services Revenue million Forecast, by Types 2019 & 2032
- Table 7: Global Visual Effects Services Revenue million Forecast, by Country 2019 & 2032
- Table 8: United States Visual Effects Services Revenue (million) Forecast, by Application 2019 & 2032
- Table 9: Canada Visual Effects Services Revenue (million) Forecast, by Application 2019 & 2032
- Table 10: Mexico Visual Effects Services Revenue (million) Forecast, by Application 2019 & 2032
- Table 11: Global Visual Effects Services Revenue million Forecast, by Application 2019 & 2032
- Table 12: Global Visual Effects Services Revenue million Forecast, by Types 2019 & 2032
- Table 13: Global Visual Effects Services Revenue million Forecast, by Country 2019 & 2032
- Table 14: Brazil Visual Effects Services Revenue (million) Forecast, by Application 2019 & 2032
- Table 15: Argentina Visual Effects Services Revenue (million) Forecast, by Application 2019 & 2032
- Table 16: Rest of South America Visual Effects Services Revenue (million) Forecast, by Application 2019 & 2032
- Table 17: Global Visual Effects Services Revenue million Forecast, by Application 2019 & 2032
- Table 18: Global Visual Effects Services Revenue million Forecast, by Types 2019 & 2032
- Table 19: Global Visual Effects Services Revenue million Forecast, by Country 2019 & 2032
- Table 20: United Kingdom Visual Effects Services Revenue (million) Forecast, by Application 2019 & 2032
- Table 21: Germany Visual Effects Services Revenue (million) Forecast, by Application 2019 & 2032
- Table 22: France Visual Effects Services Revenue (million) Forecast, by Application 2019 & 2032
- Table 23: Italy Visual Effects Services Revenue (million) Forecast, by Application 2019 & 2032
- Table 24: Spain Visual Effects Services Revenue (million) Forecast, by Application 2019 & 2032
- Table 25: Russia Visual Effects Services Revenue (million) Forecast, by Application 2019 & 2032
- Table 26: Benelux Visual Effects Services Revenue (million) Forecast, by Application 2019 & 2032
- Table 27: Nordics Visual Effects Services Revenue (million) Forecast, by Application 2019 & 2032
- Table 28: Rest of Europe Visual Effects Services Revenue (million) Forecast, by Application 2019 & 2032
- Table 29: Global Visual Effects Services Revenue million Forecast, by Application 2019 & 2032
- Table 30: Global Visual Effects Services Revenue million Forecast, by Types 2019 & 2032
- Table 31: Global Visual Effects Services Revenue million Forecast, by Country 2019 & 2032
- Table 32: Turkey Visual Effects Services Revenue (million) Forecast, by Application 2019 & 2032
- Table 33: Israel Visual Effects Services Revenue (million) Forecast, by Application 2019 & 2032
- Table 34: GCC Visual Effects Services Revenue (million) Forecast, by Application 2019 & 2032
- Table 35: North Africa Visual Effects Services Revenue (million) Forecast, by Application 2019 & 2032
- Table 36: South Africa Visual Effects Services Revenue (million) Forecast, by Application 2019 & 2032
- Table 37: Rest of Middle East & Africa Visual Effects Services Revenue (million) Forecast, by Application 2019 & 2032
- Table 38: Global Visual Effects Services Revenue million Forecast, by Application 2019 & 2032
- Table 39: Global Visual Effects Services Revenue million Forecast, by Types 2019 & 2032
- Table 40: Global Visual Effects Services Revenue million Forecast, by Country 2019 & 2032
- Table 41: China Visual Effects Services Revenue (million) Forecast, by Application 2019 & 2032
- Table 42: India Visual Effects Services Revenue (million) Forecast, by Application 2019 & 2032
- Table 43: Japan Visual Effects Services Revenue (million) Forecast, by Application 2019 & 2032
- Table 44: South Korea Visual Effects Services Revenue (million) Forecast, by Application 2019 & 2032
- Table 45: ASEAN Visual Effects Services Revenue (million) Forecast, by Application 2019 & 2032
- Table 46: Oceania Visual Effects Services Revenue (million) Forecast, by Application 2019 & 2032
- Table 47: Rest of Asia Pacific Visual Effects Services Revenue (million) Forecast, by Application 2019 & 2032
Frequently Asked Questions
1. What is the projected Compound Annual Growth Rate (CAGR) of the Visual Effects Services?
The projected CAGR is approximately 12.4%.
2. Which companies are prominent players in the Visual Effects Services?
Key companies in the market include Industrial Light and Magic, The Mill, Weta Digital, Moving Picture Company (MPC), DNEG, Sony Pictures Imageworks, Cinesite, Digital Domain, Deluxe Entertainment, Framestore, Animal Logic, Pixomondo, Digital Idea, Tippett Studio, Flatworld Solutions Pvt, Method Studios, BUF, Scanline vfx, TNG Visual Effects.
3. What are the main segments of the Visual Effects Services?
The market segments include Application, Types.
4. Can you provide details about the market size?
The market size is estimated to be USD 4926.2 million as of 2022.
5. What are some drivers contributing to market growth?
N/A
6. What are the notable trends driving market growth?
N/A
7. Are there any restraints impacting market growth?
N/A
8. Can you provide examples of recent developments in the market?
N/A
9. What pricing options are available for accessing the report?
Pricing options include single-user, multi-user, and enterprise licenses priced at USD 3950.00, USD 5925.00, and USD 7900.00 respectively.
10. Is the market size provided in terms of value or volume?
The market size is provided in terms of value, measured in million.
11. Are there any specific market keywords associated with the report?
Yes, the market keyword associated with the report is "Visual Effects Services," which aids in identifying and referencing the specific market segment covered.
12. How do I determine which pricing option suits my needs best?
The pricing options vary based on user requirements and access needs. Individual users may opt for single-user licenses, while businesses requiring broader access may choose multi-user or enterprise licenses for cost-effective access to the report.
13. Are there any additional resources or data provided in the Visual Effects Services report?
While the report offers comprehensive insights, it's advisable to review the specific contents or supplementary materials provided to ascertain if additional resources or data are available.
14. How can I stay updated on further developments or reports in the Visual Effects Services?
To stay informed about further developments, trends, and reports in the Visual Effects Services, consider subscribing to industry newsletters, following relevant companies and organizations, or regularly checking reputable industry news sources and publications.
Methodology
Step 1 - Identification of Relevant Samples Size from Population Database


Step 2 - Approaches for Defining Global Market Size (Value, Volume* & Price*)

Note*: In applicable scenarios
Step 3 - Data Sources
Primary Research
- Web Analytics
- Survey Reports
- Research Institute
- Latest Research Reports
- Opinion Leaders
Secondary Research
- Annual Reports
- White Paper
- Latest Press Release
- Industry Association
- Paid Database
- Investor Presentations

Step 4 - Data Triangulation
Involves using different sources of information in order to increase the validity of a study
These sources are likely to be stakeholders in a program - participants, other researchers, program staff, other community members, and so on.
Then we put all data in single framework & apply various statistical tools to find out the dynamic on the market.
During the analysis stage, feedback from the stakeholder groups would be compared to determine areas of agreement as well as areas of divergence


