
Key Insights
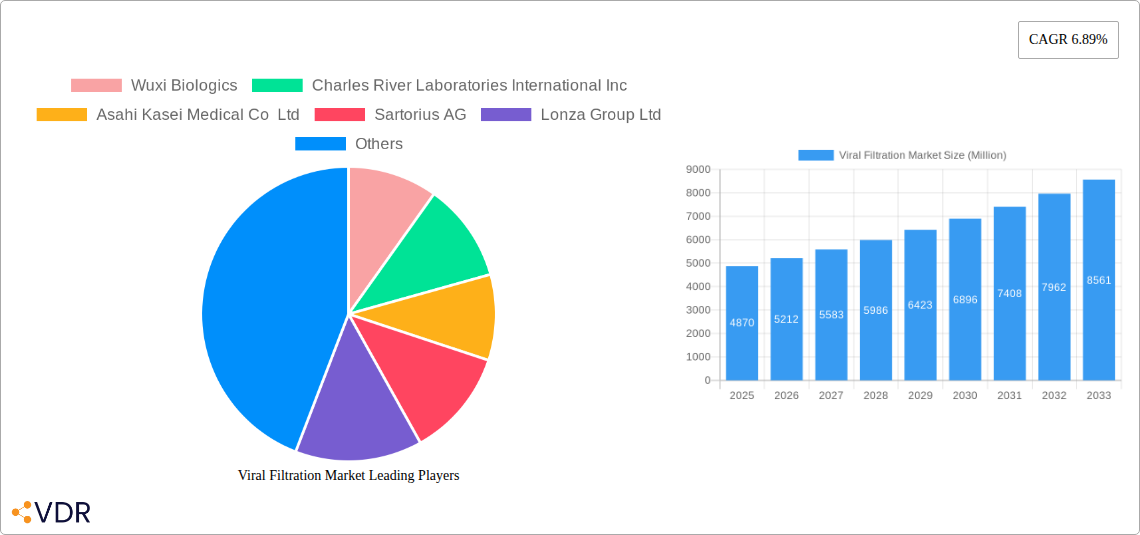
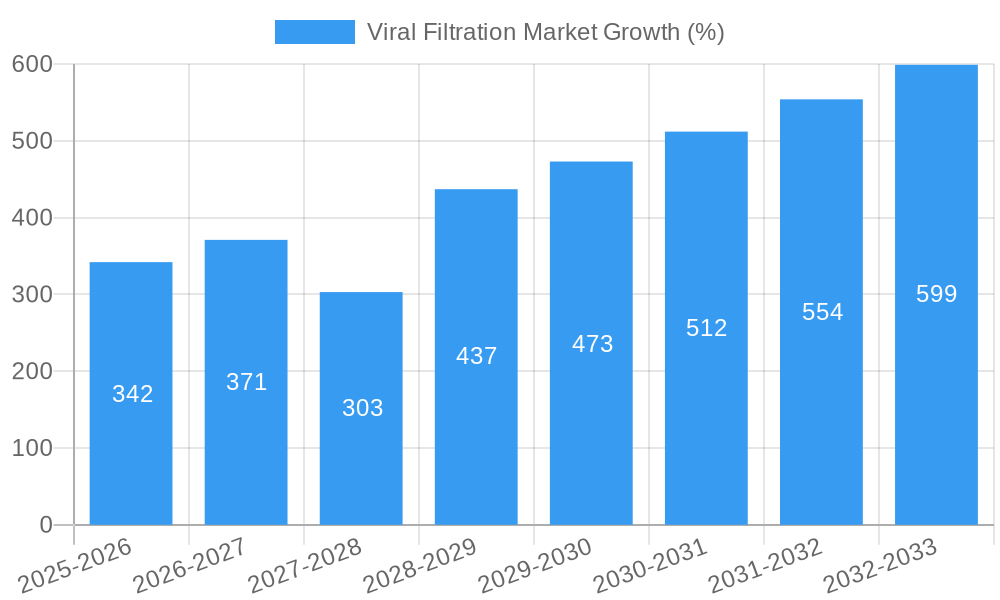
The global viral filtration market, valued at $4.87 billion in 2025, is projected to experience robust growth, driven by a compound annual growth rate (CAGR) of 6.89% from 2025 to 2033. This expansion is fueled by several key factors. The burgeoning pharmaceutical and biotechnology industries, particularly in the development and manufacturing of biopharmaceuticals, necessitate sophisticated viral filtration technologies to ensure product purity and safety. Increased investments in research and development across various therapeutic areas, including vaccines and gene therapy, are further propelling market growth. Advances in filtration technologies, such as the development of novel membrane materials with enhanced efficiency and selectivity, are also contributing to market expansion. The growing prevalence of viral infections globally and increasing demand for safe and effective vaccines further incentivize the adoption of advanced viral filtration solutions. Finally, the rising stringency of regulatory requirements for biopharmaceutical products is driving the adoption of high-quality filtration systems, creating significant demand.
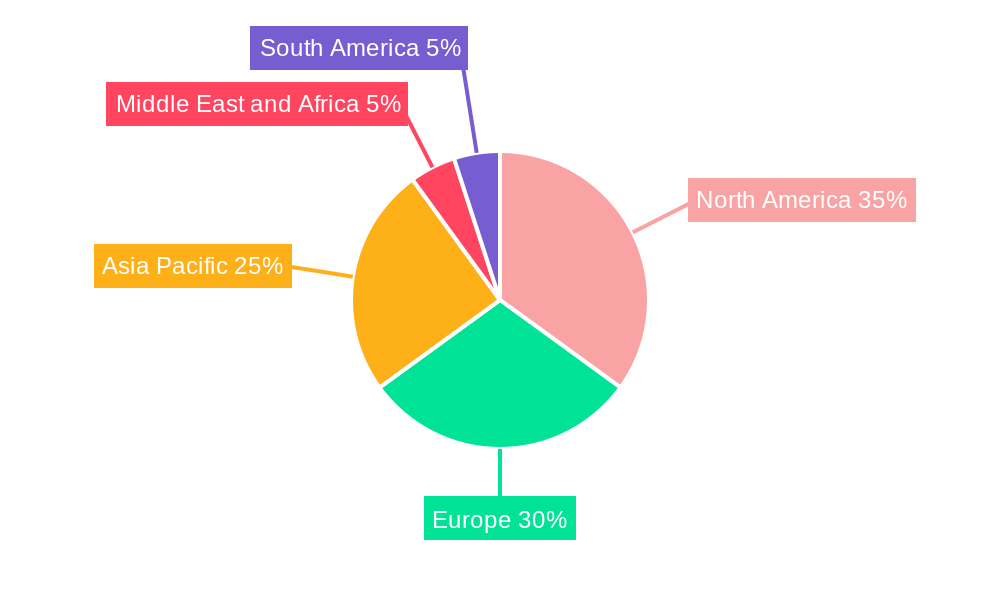
Segment-wise, filtration systems and kits dominate the product landscape due to their widespread applicability across diverse purification processes. The pharmaceutical and biotechnology companies segment leads among end-users due to their heavy reliance on viral filtration for ensuring product safety and efficacy. Geographically, North America and Europe currently hold significant market share, driven by robust research infrastructure and stringent regulatory frameworks. However, the Asia-Pacific region is poised for substantial growth, fueled by expanding pharmaceutical manufacturing capabilities and increasing investment in healthcare infrastructure. Competitive landscape analysis reveals that established players such as Sartorius AG, Merck KgaA, and Danaher Corporation (Pall Corporation), alongside emerging companies, are actively innovating and expanding their product portfolios to cater to the evolving market needs. The market’s sustained growth trajectory underscores the critical role of viral filtration in safeguarding public health and advancing biopharmaceutical innovation.
Viral Filtration Market: A Comprehensive Report (2019-2033)
This comprehensive report provides a detailed analysis of the global Viral Filtration Market, offering invaluable insights for industry professionals, investors, and stakeholders. The study period spans from 2019 to 2033, with 2025 serving as the base and estimated year. The report segments the market by product (Filtration Systems, Kits, Reagents, and Consumables, Services), application (Biological, Medical Devices, Water Purification, Air Purification), and end-user (Pharmaceutical and Biotechnology Companies, Contract Research Organizations (CROs), Others), offering a granular understanding of this dynamic market. The report projects a market value of xx Million by 2033, driven by factors explored within.
Viral Filtration Market Dynamics & Structure
The global viral filtration market is characterized by a moderately concentrated landscape with key players vying for market share. Technological innovation is a major driver, with continuous advancements in filtration technologies leading to enhanced efficiency and performance. Stringent regulatory frameworks, particularly within the pharmaceutical and biotechnology sectors, significantly impact market dynamics. Competitive pressures from substitute technologies and the emergence of new entrants are also shaping the market. Mergers and acquisitions (M&A) activities are relatively frequent, with larger players consolidating their presence and expanding their product portfolios. The pharmaceutical and biotechnology sector accounts for the largest share of the market owing to stringent regulations and the increasing demand for safe and effective biologics.
- Market Concentration: Moderately concentrated, with top 5 players holding approximately xx% market share in 2025.
- Technological Innovation: Focus on single-use systems, automation, and improved virus removal efficiency.
- Regulatory Framework: Stringent regulations in pharmaceutical and biotechnology industries drive demand for high-quality filtration solutions.
- Competitive Substitutes: Emerging technologies like membrane chromatography pose competitive pressure.
- M&A Trends: Increased consolidation among major players through acquisitions and partnerships.
Viral Filtration Market Growth Trends & Insights
The viral filtration market experienced significant growth during the historical period (2019-2024), driven by factors such as the increasing demand for biopharmaceuticals, stringent regulatory requirements, and advancements in filtration technologies. The market is expected to maintain a healthy Compound Annual Growth Rate (CAGR) of xx% during the forecast period (2025-2033), reaching a projected value of xx Million by 2033. This growth will be fueled by the rising prevalence of viral infections, the expanding biopharmaceutical industry, and increased investments in research and development. Technological advancements, such as the introduction of single-use systems and automated filtration platforms, will further contribute to market expansion. The adoption rate of advanced filtration technologies is expected to increase steadily across various end-user segments.
Dominant Regions, Countries, or Segments in Viral Filtration Market
North America currently dominates the viral filtration market, driven by the presence of major pharmaceutical and biotechnology companies, robust research infrastructure, and supportive regulatory frameworks. However, the Asia-Pacific region is projected to exhibit the highest growth rate during the forecast period, fueled by increasing healthcare spending, rising demand for biopharmaceuticals, and the growing presence of contract research organizations (CROs).
- Leading Region: North America (xx% market share in 2025)
- Fastest Growing Region: Asia-Pacific (projected CAGR of xx% during 2025-2033)
- Dominant Segment (Product): Filtration Systems (xx% market share in 2025)
- Dominant Segment (Application): Biological (xx% market share in 2025)
- Dominant Segment (End-User): Pharmaceutical and Biotechnology Companies (xx% market share in 2025)
Viral Filtration Market Product Landscape
The viral filtration market offers a diverse range of products, including filtration systems, kits, reagents, and consumables. Significant advancements are seen in single-use systems, which offer improved efficiency, reduced contamination risks, and cost savings. Technological innovations are focused on enhancing virus removal efficiency, increasing throughput, and simplifying operational processes. The market's unique selling propositions are centered around improved accuracy and reproducibility, as well as compliance with stringent regulatory requirements.
Key Drivers, Barriers & Challenges in Viral Filtration Market
Key Drivers:
- Rising demand for biopharmaceuticals and biologics.
- Increasing prevalence of viral infections.
- Stringent regulatory requirements for drug and vaccine manufacturing.
- Technological advancements leading to enhanced filtration performance.
Challenges:
- High initial investment costs for advanced filtration systems.
- Potential supply chain disruptions affecting the availability of raw materials.
- Competition from alternative technologies and substitute products.
Emerging Opportunities in Viral Filtration Market
Emerging opportunities lie in the development of novel filtration technologies for emerging viral threats, the expansion into untapped markets (e.g., developing countries), and the growing demand for personalized medicine. Further opportunities exist in the application of viral filtration in areas such as water purification and air purification, driven by growing concerns about environmental safety.
Growth Accelerators in the Viral Filtration Market Industry
Long-term growth will be significantly influenced by ongoing technological advancements, strategic partnerships between manufacturers and end-users, and the expansion into new geographic markets. Collaborative efforts to develop standardized protocols and improve regulatory clarity will also stimulate market growth.
Key Players Shaping the Viral Filtration Market Market
- Wuxi Biologics
- Charles River Laboratories International Inc
- Asahi Kasei Medical Co Ltd
- Sartorius AG
- Lonza Group Ltd
- Clean Cell Inc
- Qiagen
- Thermo Fischer Scientific Inc
- Merck KgaA
- PendoTECH
- Danaher Corporation (Pall Corporation)
Notable Milestones in Viral Filtration Market Sector
- October 2022: PathoQuest establishes a new factory in Wayne, Pennsylvania, expanding its capacity for biologics testing.
- July 2022: Agilitech launches a single-use virus filtration system, enhancing bioprocessing capabilities.
In-Depth Viral Filtration Market Market Outlook
The future of the viral filtration market appears bright, with continued growth driven by several factors including the ongoing development of advanced filtration technologies, the increasing demand for biopharmaceuticals, and growing awareness of the importance of viral safety. Strategic partnerships, expansions into emerging markets, and investments in research and development are expected to further propel market expansion. The market is poised for significant growth over the next decade, offering lucrative opportunities for both established players and new entrants.
Viral Filtration Market Segmentation
-
1. Product
- 1.1. Filtration Systems
- 1.2. Kits, Reagents, and Consumables
- 1.3. Services
-
2. Application
-
2.1. Biological
- 2.1.1. Vaccines and Therapeutics
- 2.1.2. Blood and Blood Products
- 2.1.3. Cellular and Gene Therapy Products
- 2.1.4. Tissue and Tissue Products
- 2.1.5. Other Products
- 2.2. Medical Devices
- 2.3. Water Purification
- 2.4. Air Purification
-
2.1. Biological
-
3. End User
- 3.1. Pharmaceutical and Biotechnology Companies
- 3.2. Contract Research Organizations (CROs)
- 3.3. Others
Viral Filtration Market Segmentation By Geography
-
1. North America
- 1.1. United States
- 1.2. Canada
- 1.3. Mexico
-
2. Europe
- 2.1. Germany
- 2.2. United Kingdom
- 2.3. France
- 2.4. Italy
- 2.5. Spain
- 2.6. Rest of Europe
-
3. Asia Pacific
- 3.1. China
- 3.2. Japan
- 3.3. India
- 3.4. Australia
- 3.5. South Korea
- 3.6. Rest of Asia Pacific
-
4. Middle East and Africa
- 4.1. GCC
- 4.2. South Africa
- 4.3. Rest of Middle East and Africa
-
5. South America
- 5.1. Brazil
- 5.2. Argentina
- 5.3. Rest of South America
Viral Filtration Market REPORT HIGHLIGHTS
| Aspects | Details |
|---|---|
| Study Period | 2019-2033 |
| Base Year | 2024 |
| Estimated Year | 2025 |
| Forecast Period | 2025-2033 |
| Historical Period | 2019-2024 |
| Growth Rate | CAGR of 6.89% from 2019-2033 |
| Segmentation |
|
Table of Contents
- 1. Introduction
- 1.1. Research Scope
- 1.2. Market Segmentation
- 1.3. Research Methodology
- 1.4. Definitions and Assumptions
- 2. Executive Summary
- 2.1. Introduction
- 3. Market Dynamics
- 3.1. Introduction
- 3.2. Market Drivers
- 3.2.1. Increasing Pharmaceutical and Biopharmaceutical R&D Spending; Increasing Demand for Biologics; Adoption of Single-use Technologies
- 3.3. Market Restrains
- 3.3.1. Stringent Regulations for Validation of Filtration Products
- 3.4. Market Trends
- 3.4.1. The Vaccines and Therapeutics Segment is Expected to Hold a Majority Share of the Market Over the Forecast Period
- 4. Market Factor Analysis
- 4.1. Porters Five Forces
- 4.2. Supply/Value Chain
- 4.3. PESTEL analysis
- 4.4. Market Entropy
- 4.5. Patent/Trademark Analysis
- 5. Global Viral Filtration Market Analysis, Insights and Forecast, 2019-2031
- 5.1. Market Analysis, Insights and Forecast - by Product
- 5.1.1. Filtration Systems
- 5.1.2. Kits, Reagents, and Consumables
- 5.1.3. Services
- 5.2. Market Analysis, Insights and Forecast - by Application
- 5.2.1. Biological
- 5.2.1.1. Vaccines and Therapeutics
- 5.2.1.2. Blood and Blood Products
- 5.2.1.3. Cellular and Gene Therapy Products
- 5.2.1.4. Tissue and Tissue Products
- 5.2.1.5. Other Products
- 5.2.2. Medical Devices
- 5.2.3. Water Purification
- 5.2.4. Air Purification
- 5.2.1. Biological
- 5.3. Market Analysis, Insights and Forecast - by End User
- 5.3.1. Pharmaceutical and Biotechnology Companies
- 5.3.2. Contract Research Organizations (CROs)
- 5.3.3. Others
- 5.4. Market Analysis, Insights and Forecast - by Region
- 5.4.1. North America
- 5.4.2. Europe
- 5.4.3. Asia Pacific
- 5.4.4. Middle East and Africa
- 5.4.5. South America
- 5.1. Market Analysis, Insights and Forecast - by Product
- 6. North America Viral Filtration Market Analysis, Insights and Forecast, 2019-2031
- 6.1. Market Analysis, Insights and Forecast - by Product
- 6.1.1. Filtration Systems
- 6.1.2. Kits, Reagents, and Consumables
- 6.1.3. Services
- 6.2. Market Analysis, Insights and Forecast - by Application
- 6.2.1. Biological
- 6.2.1.1. Vaccines and Therapeutics
- 6.2.1.2. Blood and Blood Products
- 6.2.1.3. Cellular and Gene Therapy Products
- 6.2.1.4. Tissue and Tissue Products
- 6.2.1.5. Other Products
- 6.2.2. Medical Devices
- 6.2.3. Water Purification
- 6.2.4. Air Purification
- 6.2.1. Biological
- 6.3. Market Analysis, Insights and Forecast - by End User
- 6.3.1. Pharmaceutical and Biotechnology Companies
- 6.3.2. Contract Research Organizations (CROs)
- 6.3.3. Others
- 6.1. Market Analysis, Insights and Forecast - by Product
- 7. Europe Viral Filtration Market Analysis, Insights and Forecast, 2019-2031
- 7.1. Market Analysis, Insights and Forecast - by Product
- 7.1.1. Filtration Systems
- 7.1.2. Kits, Reagents, and Consumables
- 7.1.3. Services
- 7.2. Market Analysis, Insights and Forecast - by Application
- 7.2.1. Biological
- 7.2.1.1. Vaccines and Therapeutics
- 7.2.1.2. Blood and Blood Products
- 7.2.1.3. Cellular and Gene Therapy Products
- 7.2.1.4. Tissue and Tissue Products
- 7.2.1.5. Other Products
- 7.2.2. Medical Devices
- 7.2.3. Water Purification
- 7.2.4. Air Purification
- 7.2.1. Biological
- 7.3. Market Analysis, Insights and Forecast - by End User
- 7.3.1. Pharmaceutical and Biotechnology Companies
- 7.3.2. Contract Research Organizations (CROs)
- 7.3.3. Others
- 7.1. Market Analysis, Insights and Forecast - by Product
- 8. Asia Pacific Viral Filtration Market Analysis, Insights and Forecast, 2019-2031
- 8.1. Market Analysis, Insights and Forecast - by Product
- 8.1.1. Filtration Systems
- 8.1.2. Kits, Reagents, and Consumables
- 8.1.3. Services
- 8.2. Market Analysis, Insights and Forecast - by Application
- 8.2.1. Biological
- 8.2.1.1. Vaccines and Therapeutics
- 8.2.1.2. Blood and Blood Products
- 8.2.1.3. Cellular and Gene Therapy Products
- 8.2.1.4. Tissue and Tissue Products
- 8.2.1.5. Other Products
- 8.2.2. Medical Devices
- 8.2.3. Water Purification
- 8.2.4. Air Purification
- 8.2.1. Biological
- 8.3. Market Analysis, Insights and Forecast - by End User
- 8.3.1. Pharmaceutical and Biotechnology Companies
- 8.3.2. Contract Research Organizations (CROs)
- 8.3.3. Others
- 8.1. Market Analysis, Insights and Forecast - by Product
- 9. Middle East and Africa Viral Filtration Market Analysis, Insights and Forecast, 2019-2031
- 9.1. Market Analysis, Insights and Forecast - by Product
- 9.1.1. Filtration Systems
- 9.1.2. Kits, Reagents, and Consumables
- 9.1.3. Services
- 9.2. Market Analysis, Insights and Forecast - by Application
- 9.2.1. Biological
- 9.2.1.1. Vaccines and Therapeutics
- 9.2.1.2. Blood and Blood Products
- 9.2.1.3. Cellular and Gene Therapy Products
- 9.2.1.4. Tissue and Tissue Products
- 9.2.1.5. Other Products
- 9.2.2. Medical Devices
- 9.2.3. Water Purification
- 9.2.4. Air Purification
- 9.2.1. Biological
- 9.3. Market Analysis, Insights and Forecast - by End User
- 9.3.1. Pharmaceutical and Biotechnology Companies
- 9.3.2. Contract Research Organizations (CROs)
- 9.3.3. Others
- 9.1. Market Analysis, Insights and Forecast - by Product
- 10. South America Viral Filtration Market Analysis, Insights and Forecast, 2019-2031
- 10.1. Market Analysis, Insights and Forecast - by Product
- 10.1.1. Filtration Systems
- 10.1.2. Kits, Reagents, and Consumables
- 10.1.3. Services
- 10.2. Market Analysis, Insights and Forecast - by Application
- 10.2.1. Biological
- 10.2.1.1. Vaccines and Therapeutics
- 10.2.1.2. Blood and Blood Products
- 10.2.1.3. Cellular and Gene Therapy Products
- 10.2.1.4. Tissue and Tissue Products
- 10.2.1.5. Other Products
- 10.2.2. Medical Devices
- 10.2.3. Water Purification
- 10.2.4. Air Purification
- 10.2.1. Biological
- 10.3. Market Analysis, Insights and Forecast - by End User
- 10.3.1. Pharmaceutical and Biotechnology Companies
- 10.3.2. Contract Research Organizations (CROs)
- 10.3.3. Others
- 10.1. Market Analysis, Insights and Forecast - by Product
- 11. North America Viral Filtration Market Analysis, Insights and Forecast, 2019-2031
- 11.1. Market Analysis, Insights and Forecast - By Country/Sub-region
- 11.1.1. undefined
- 12. Europe Viral Filtration Market Analysis, Insights and Forecast, 2019-2031
- 12.1. Market Analysis, Insights and Forecast - By Country/Sub-region
- 12.1.1. undefined
- 13. Asia Pacific Viral Filtration Market Analysis, Insights and Forecast, 2019-2031
- 13.1. Market Analysis, Insights and Forecast - By Country/Sub-region
- 13.1.1. undefined
- 14. Middle East and Africa Viral Filtration Market Analysis, Insights and Forecast, 2019-2031
- 14.1. Market Analysis, Insights and Forecast - By Country/Sub-region
- 14.1.1. undefined
- 15. South America Viral Filtration Market Analysis, Insights and Forecast, 2019-2031
- 15.1. Market Analysis, Insights and Forecast - By Country/Sub-region
- 15.1.1. undefined
- 16. Competitive Analysis
- 16.1. Global Market Share Analysis 2024
- 16.2. Company Profiles
- 16.2.1 Wuxi Biologics
- 16.2.1.1. Overview
- 16.2.1.2. Products
- 16.2.1.3. SWOT Analysis
- 16.2.1.4. Recent Developments
- 16.2.1.5. Financials (Based on Availability)
- 16.2.2 Charles River Laboratories International Inc
- 16.2.2.1. Overview
- 16.2.2.2. Products
- 16.2.2.3. SWOT Analysis
- 16.2.2.4. Recent Developments
- 16.2.2.5. Financials (Based on Availability)
- 16.2.3 Asahi Kasei Medical Co Ltd
- 16.2.3.1. Overview
- 16.2.3.2. Products
- 16.2.3.3. SWOT Analysis
- 16.2.3.4. Recent Developments
- 16.2.3.5. Financials (Based on Availability)
- 16.2.4 Sartorius AG
- 16.2.4.1. Overview
- 16.2.4.2. Products
- 16.2.4.3. SWOT Analysis
- 16.2.4.4. Recent Developments
- 16.2.4.5. Financials (Based on Availability)
- 16.2.5 Lonza Group Ltd
- 16.2.5.1. Overview
- 16.2.5.2. Products
- 16.2.5.3. SWOT Analysis
- 16.2.5.4. Recent Developments
- 16.2.5.5. Financials (Based on Availability)
- 16.2.6 Clean Cell Inc
- 16.2.6.1. Overview
- 16.2.6.2. Products
- 16.2.6.3. SWOT Analysis
- 16.2.6.4. Recent Developments
- 16.2.6.5. Financials (Based on Availability)
- 16.2.7 Qiagen
- 16.2.7.1. Overview
- 16.2.7.2. Products
- 16.2.7.3. SWOT Analysis
- 16.2.7.4. Recent Developments
- 16.2.7.5. Financials (Based on Availability)
- 16.2.8 Thermo Fischer Scientific Inc
- 16.2.8.1. Overview
- 16.2.8.2. Products
- 16.2.8.3. SWOT Analysis
- 16.2.8.4. Recent Developments
- 16.2.8.5. Financials (Based on Availability)
- 16.2.9 Merck KgaA
- 16.2.9.1. Overview
- 16.2.9.2. Products
- 16.2.9.3. SWOT Analysis
- 16.2.9.4. Recent Developments
- 16.2.9.5. Financials (Based on Availability)
- 16.2.10 PendoTECH
- 16.2.10.1. Overview
- 16.2.10.2. Products
- 16.2.10.3. SWOT Analysis
- 16.2.10.4. Recent Developments
- 16.2.10.5. Financials (Based on Availability)
- 16.2.11 Danaher Corporation (Pall Corporation)
- 16.2.11.1. Overview
- 16.2.11.2. Products
- 16.2.11.3. SWOT Analysis
- 16.2.11.4. Recent Developments
- 16.2.11.5. Financials (Based on Availability)
- 16.2.1 Wuxi Biologics
List of Figures
- Figure 1: Global Viral Filtration Market Revenue Breakdown (Million, %) by Region 2024 & 2032
- Figure 2: Global Viral Filtration Market Volume Breakdown (K Unit, %) by Region 2024 & 2032
- Figure 3: North America Viral Filtration Market Revenue (Million), by Country 2024 & 2032
- Figure 4: North America Viral Filtration Market Volume (K Unit), by Country 2024 & 2032
- Figure 5: North America Viral Filtration Market Revenue Share (%), by Country 2024 & 2032
- Figure 6: North America Viral Filtration Market Volume Share (%), by Country 2024 & 2032
- Figure 7: Europe Viral Filtration Market Revenue (Million), by Country 2024 & 2032
- Figure 8: Europe Viral Filtration Market Volume (K Unit), by Country 2024 & 2032
- Figure 9: Europe Viral Filtration Market Revenue Share (%), by Country 2024 & 2032
- Figure 10: Europe Viral Filtration Market Volume Share (%), by Country 2024 & 2032
- Figure 11: Asia Pacific Viral Filtration Market Revenue (Million), by Country 2024 & 2032
- Figure 12: Asia Pacific Viral Filtration Market Volume (K Unit), by Country 2024 & 2032
- Figure 13: Asia Pacific Viral Filtration Market Revenue Share (%), by Country 2024 & 2032
- Figure 14: Asia Pacific Viral Filtration Market Volume Share (%), by Country 2024 & 2032
- Figure 15: Middle East and Africa Viral Filtration Market Revenue (Million), by Country 2024 & 2032
- Figure 16: Middle East and Africa Viral Filtration Market Volume (K Unit), by Country 2024 & 2032
- Figure 17: Middle East and Africa Viral Filtration Market Revenue Share (%), by Country 2024 & 2032
- Figure 18: Middle East and Africa Viral Filtration Market Volume Share (%), by Country 2024 & 2032
- Figure 19: South America Viral Filtration Market Revenue (Million), by Country 2024 & 2032
- Figure 20: South America Viral Filtration Market Volume (K Unit), by Country 2024 & 2032
- Figure 21: South America Viral Filtration Market Revenue Share (%), by Country 2024 & 2032
- Figure 22: South America Viral Filtration Market Volume Share (%), by Country 2024 & 2032
- Figure 23: North America Viral Filtration Market Revenue (Million), by Product 2024 & 2032
- Figure 24: North America Viral Filtration Market Volume (K Unit), by Product 2024 & 2032
- Figure 25: North America Viral Filtration Market Revenue Share (%), by Product 2024 & 2032
- Figure 26: North America Viral Filtration Market Volume Share (%), by Product 2024 & 2032
- Figure 27: North America Viral Filtration Market Revenue (Million), by Application 2024 & 2032
- Figure 28: North America Viral Filtration Market Volume (K Unit), by Application 2024 & 2032
- Figure 29: North America Viral Filtration Market Revenue Share (%), by Application 2024 & 2032
- Figure 30: North America Viral Filtration Market Volume Share (%), by Application 2024 & 2032
- Figure 31: North America Viral Filtration Market Revenue (Million), by End User 2024 & 2032
- Figure 32: North America Viral Filtration Market Volume (K Unit), by End User 2024 & 2032
- Figure 33: North America Viral Filtration Market Revenue Share (%), by End User 2024 & 2032
- Figure 34: North America Viral Filtration Market Volume Share (%), by End User 2024 & 2032
- Figure 35: North America Viral Filtration Market Revenue (Million), by Country 2024 & 2032
- Figure 36: North America Viral Filtration Market Volume (K Unit), by Country 2024 & 2032
- Figure 37: North America Viral Filtration Market Revenue Share (%), by Country 2024 & 2032
- Figure 38: North America Viral Filtration Market Volume Share (%), by Country 2024 & 2032
- Figure 39: Europe Viral Filtration Market Revenue (Million), by Product 2024 & 2032
- Figure 40: Europe Viral Filtration Market Volume (K Unit), by Product 2024 & 2032
- Figure 41: Europe Viral Filtration Market Revenue Share (%), by Product 2024 & 2032
- Figure 42: Europe Viral Filtration Market Volume Share (%), by Product 2024 & 2032
- Figure 43: Europe Viral Filtration Market Revenue (Million), by Application 2024 & 2032
- Figure 44: Europe Viral Filtration Market Volume (K Unit), by Application 2024 & 2032
- Figure 45: Europe Viral Filtration Market Revenue Share (%), by Application 2024 & 2032
- Figure 46: Europe Viral Filtration Market Volume Share (%), by Application 2024 & 2032
- Figure 47: Europe Viral Filtration Market Revenue (Million), by End User 2024 & 2032
- Figure 48: Europe Viral Filtration Market Volume (K Unit), by End User 2024 & 2032
- Figure 49: Europe Viral Filtration Market Revenue Share (%), by End User 2024 & 2032
- Figure 50: Europe Viral Filtration Market Volume Share (%), by End User 2024 & 2032
- Figure 51: Europe Viral Filtration Market Revenue (Million), by Country 2024 & 2032
- Figure 52: Europe Viral Filtration Market Volume (K Unit), by Country 2024 & 2032
- Figure 53: Europe Viral Filtration Market Revenue Share (%), by Country 2024 & 2032
- Figure 54: Europe Viral Filtration Market Volume Share (%), by Country 2024 & 2032
- Figure 55: Asia Pacific Viral Filtration Market Revenue (Million), by Product 2024 & 2032
- Figure 56: Asia Pacific Viral Filtration Market Volume (K Unit), by Product 2024 & 2032
- Figure 57: Asia Pacific Viral Filtration Market Revenue Share (%), by Product 2024 & 2032
- Figure 58: Asia Pacific Viral Filtration Market Volume Share (%), by Product 2024 & 2032
- Figure 59: Asia Pacific Viral Filtration Market Revenue (Million), by Application 2024 & 2032
- Figure 60: Asia Pacific Viral Filtration Market Volume (K Unit), by Application 2024 & 2032
- Figure 61: Asia Pacific Viral Filtration Market Revenue Share (%), by Application 2024 & 2032
- Figure 62: Asia Pacific Viral Filtration Market Volume Share (%), by Application 2024 & 2032
- Figure 63: Asia Pacific Viral Filtration Market Revenue (Million), by End User 2024 & 2032
- Figure 64: Asia Pacific Viral Filtration Market Volume (K Unit), by End User 2024 & 2032
- Figure 65: Asia Pacific Viral Filtration Market Revenue Share (%), by End User 2024 & 2032
- Figure 66: Asia Pacific Viral Filtration Market Volume Share (%), by End User 2024 & 2032
- Figure 67: Asia Pacific Viral Filtration Market Revenue (Million), by Country 2024 & 2032
- Figure 68: Asia Pacific Viral Filtration Market Volume (K Unit), by Country 2024 & 2032
- Figure 69: Asia Pacific Viral Filtration Market Revenue Share (%), by Country 2024 & 2032
- Figure 70: Asia Pacific Viral Filtration Market Volume Share (%), by Country 2024 & 2032
- Figure 71: Middle East and Africa Viral Filtration Market Revenue (Million), by Product 2024 & 2032
- Figure 72: Middle East and Africa Viral Filtration Market Volume (K Unit), by Product 2024 & 2032
- Figure 73: Middle East and Africa Viral Filtration Market Revenue Share (%), by Product 2024 & 2032
- Figure 74: Middle East and Africa Viral Filtration Market Volume Share (%), by Product 2024 & 2032
- Figure 75: Middle East and Africa Viral Filtration Market Revenue (Million), by Application 2024 & 2032
- Figure 76: Middle East and Africa Viral Filtration Market Volume (K Unit), by Application 2024 & 2032
- Figure 77: Middle East and Africa Viral Filtration Market Revenue Share (%), by Application 2024 & 2032
- Figure 78: Middle East and Africa Viral Filtration Market Volume Share (%), by Application 2024 & 2032
- Figure 79: Middle East and Africa Viral Filtration Market Revenue (Million), by End User 2024 & 2032
- Figure 80: Middle East and Africa Viral Filtration Market Volume (K Unit), by End User 2024 & 2032
- Figure 81: Middle East and Africa Viral Filtration Market Revenue Share (%), by End User 2024 & 2032
- Figure 82: Middle East and Africa Viral Filtration Market Volume Share (%), by End User 2024 & 2032
- Figure 83: Middle East and Africa Viral Filtration Market Revenue (Million), by Country 2024 & 2032
- Figure 84: Middle East and Africa Viral Filtration Market Volume (K Unit), by Country 2024 & 2032
- Figure 85: Middle East and Africa Viral Filtration Market Revenue Share (%), by Country 2024 & 2032
- Figure 86: Middle East and Africa Viral Filtration Market Volume Share (%), by Country 2024 & 2032
- Figure 87: South America Viral Filtration Market Revenue (Million), by Product 2024 & 2032
- Figure 88: South America Viral Filtration Market Volume (K Unit), by Product 2024 & 2032
- Figure 89: South America Viral Filtration Market Revenue Share (%), by Product 2024 & 2032
- Figure 90: South America Viral Filtration Market Volume Share (%), by Product 2024 & 2032
- Figure 91: South America Viral Filtration Market Revenue (Million), by Application 2024 & 2032
- Figure 92: South America Viral Filtration Market Volume (K Unit), by Application 2024 & 2032
- Figure 93: South America Viral Filtration Market Revenue Share (%), by Application 2024 & 2032
- Figure 94: South America Viral Filtration Market Volume Share (%), by Application 2024 & 2032
- Figure 95: South America Viral Filtration Market Revenue (Million), by End User 2024 & 2032
- Figure 96: South America Viral Filtration Market Volume (K Unit), by End User 2024 & 2032
- Figure 97: South America Viral Filtration Market Revenue Share (%), by End User 2024 & 2032
- Figure 98: South America Viral Filtration Market Volume Share (%), by End User 2024 & 2032
- Figure 99: South America Viral Filtration Market Revenue (Million), by Country 2024 & 2032
- Figure 100: South America Viral Filtration Market Volume (K Unit), by Country 2024 & 2032
- Figure 101: South America Viral Filtration Market Revenue Share (%), by Country 2024 & 2032
- Figure 102: South America Viral Filtration Market Volume Share (%), by Country 2024 & 2032
List of Tables
- Table 1: Global Viral Filtration Market Revenue Million Forecast, by Region 2019 & 2032
- Table 2: Global Viral Filtration Market Volume K Unit Forecast, by Region 2019 & 2032
- Table 3: Global Viral Filtration Market Revenue Million Forecast, by Product 2019 & 2032
- Table 4: Global Viral Filtration Market Volume K Unit Forecast, by Product 2019 & 2032
- Table 5: Global Viral Filtration Market Revenue Million Forecast, by Application 2019 & 2032
- Table 6: Global Viral Filtration Market Volume K Unit Forecast, by Application 2019 & 2032
- Table 7: Global Viral Filtration Market Revenue Million Forecast, by End User 2019 & 2032
- Table 8: Global Viral Filtration Market Volume K Unit Forecast, by End User 2019 & 2032
- Table 9: Global Viral Filtration Market Revenue Million Forecast, by Region 2019 & 2032
- Table 10: Global Viral Filtration Market Volume K Unit Forecast, by Region 2019 & 2032
- Table 11: Global Viral Filtration Market Revenue Million Forecast, by Country 2019 & 2032
- Table 12: Global Viral Filtration Market Volume K Unit Forecast, by Country 2019 & 2032
- Table 13: Global Viral Filtration Market Revenue Million Forecast, by Country 2019 & 2032
- Table 14: Global Viral Filtration Market Volume K Unit Forecast, by Country 2019 & 2032
- Table 15: Global Viral Filtration Market Revenue Million Forecast, by Country 2019 & 2032
- Table 16: Global Viral Filtration Market Volume K Unit Forecast, by Country 2019 & 2032
- Table 17: Global Viral Filtration Market Revenue Million Forecast, by Country 2019 & 2032
- Table 18: Global Viral Filtration Market Volume K Unit Forecast, by Country 2019 & 2032
- Table 19: Global Viral Filtration Market Revenue Million Forecast, by Country 2019 & 2032
- Table 20: Global Viral Filtration Market Volume K Unit Forecast, by Country 2019 & 2032
- Table 21: Global Viral Filtration Market Revenue Million Forecast, by Product 2019 & 2032
- Table 22: Global Viral Filtration Market Volume K Unit Forecast, by Product 2019 & 2032
- Table 23: Global Viral Filtration Market Revenue Million Forecast, by Application 2019 & 2032
- Table 24: Global Viral Filtration Market Volume K Unit Forecast, by Application 2019 & 2032
- Table 25: Global Viral Filtration Market Revenue Million Forecast, by End User 2019 & 2032
- Table 26: Global Viral Filtration Market Volume K Unit Forecast, by End User 2019 & 2032
- Table 27: Global Viral Filtration Market Revenue Million Forecast, by Country 2019 & 2032
- Table 28: Global Viral Filtration Market Volume K Unit Forecast, by Country 2019 & 2032
- Table 29: United States Viral Filtration Market Revenue (Million) Forecast, by Application 2019 & 2032
- Table 30: United States Viral Filtration Market Volume (K Unit) Forecast, by Application 2019 & 2032
- Table 31: Canada Viral Filtration Market Revenue (Million) Forecast, by Application 2019 & 2032
- Table 32: Canada Viral Filtration Market Volume (K Unit) Forecast, by Application 2019 & 2032
- Table 33: Mexico Viral Filtration Market Revenue (Million) Forecast, by Application 2019 & 2032
- Table 34: Mexico Viral Filtration Market Volume (K Unit) Forecast, by Application 2019 & 2032
- Table 35: Global Viral Filtration Market Revenue Million Forecast, by Product 2019 & 2032
- Table 36: Global Viral Filtration Market Volume K Unit Forecast, by Product 2019 & 2032
- Table 37: Global Viral Filtration Market Revenue Million Forecast, by Application 2019 & 2032
- Table 38: Global Viral Filtration Market Volume K Unit Forecast, by Application 2019 & 2032
- Table 39: Global Viral Filtration Market Revenue Million Forecast, by End User 2019 & 2032
- Table 40: Global Viral Filtration Market Volume K Unit Forecast, by End User 2019 & 2032
- Table 41: Global Viral Filtration Market Revenue Million Forecast, by Country 2019 & 2032
- Table 42: Global Viral Filtration Market Volume K Unit Forecast, by Country 2019 & 2032
- Table 43: Germany Viral Filtration Market Revenue (Million) Forecast, by Application 2019 & 2032
- Table 44: Germany Viral Filtration Market Volume (K Unit) Forecast, by Application 2019 & 2032
- Table 45: United Kingdom Viral Filtration Market Revenue (Million) Forecast, by Application 2019 & 2032
- Table 46: United Kingdom Viral Filtration Market Volume (K Unit) Forecast, by Application 2019 & 2032
- Table 47: France Viral Filtration Market Revenue (Million) Forecast, by Application 2019 & 2032
- Table 48: France Viral Filtration Market Volume (K Unit) Forecast, by Application 2019 & 2032
- Table 49: Italy Viral Filtration Market Revenue (Million) Forecast, by Application 2019 & 2032
- Table 50: Italy Viral Filtration Market Volume (K Unit) Forecast, by Application 2019 & 2032
- Table 51: Spain Viral Filtration Market Revenue (Million) Forecast, by Application 2019 & 2032
- Table 52: Spain Viral Filtration Market Volume (K Unit) Forecast, by Application 2019 & 2032
- Table 53: Rest of Europe Viral Filtration Market Revenue (Million) Forecast, by Application 2019 & 2032
- Table 54: Rest of Europe Viral Filtration Market Volume (K Unit) Forecast, by Application 2019 & 2032
- Table 55: Global Viral Filtration Market Revenue Million Forecast, by Product 2019 & 2032
- Table 56: Global Viral Filtration Market Volume K Unit Forecast, by Product 2019 & 2032
- Table 57: Global Viral Filtration Market Revenue Million Forecast, by Application 2019 & 2032
- Table 58: Global Viral Filtration Market Volume K Unit Forecast, by Application 2019 & 2032
- Table 59: Global Viral Filtration Market Revenue Million Forecast, by End User 2019 & 2032
- Table 60: Global Viral Filtration Market Volume K Unit Forecast, by End User 2019 & 2032
- Table 61: Global Viral Filtration Market Revenue Million Forecast, by Country 2019 & 2032
- Table 62: Global Viral Filtration Market Volume K Unit Forecast, by Country 2019 & 2032
- Table 63: China Viral Filtration Market Revenue (Million) Forecast, by Application 2019 & 2032
- Table 64: China Viral Filtration Market Volume (K Unit) Forecast, by Application 2019 & 2032
- Table 65: Japan Viral Filtration Market Revenue (Million) Forecast, by Application 2019 & 2032
- Table 66: Japan Viral Filtration Market Volume (K Unit) Forecast, by Application 2019 & 2032
- Table 67: India Viral Filtration Market Revenue (Million) Forecast, by Application 2019 & 2032
- Table 68: India Viral Filtration Market Volume (K Unit) Forecast, by Application 2019 & 2032
- Table 69: Australia Viral Filtration Market Revenue (Million) Forecast, by Application 2019 & 2032
- Table 70: Australia Viral Filtration Market Volume (K Unit) Forecast, by Application 2019 & 2032
- Table 71: South Korea Viral Filtration Market Revenue (Million) Forecast, by Application 2019 & 2032
- Table 72: South Korea Viral Filtration Market Volume (K Unit) Forecast, by Application 2019 & 2032
- Table 73: Rest of Asia Pacific Viral Filtration Market Revenue (Million) Forecast, by Application 2019 & 2032
- Table 74: Rest of Asia Pacific Viral Filtration Market Volume (K Unit) Forecast, by Application 2019 & 2032
- Table 75: Global Viral Filtration Market Revenue Million Forecast, by Product 2019 & 2032
- Table 76: Global Viral Filtration Market Volume K Unit Forecast, by Product 2019 & 2032
- Table 77: Global Viral Filtration Market Revenue Million Forecast, by Application 2019 & 2032
- Table 78: Global Viral Filtration Market Volume K Unit Forecast, by Application 2019 & 2032
- Table 79: Global Viral Filtration Market Revenue Million Forecast, by End User 2019 & 2032
- Table 80: Global Viral Filtration Market Volume K Unit Forecast, by End User 2019 & 2032
- Table 81: Global Viral Filtration Market Revenue Million Forecast, by Country 2019 & 2032
- Table 82: Global Viral Filtration Market Volume K Unit Forecast, by Country 2019 & 2032
- Table 83: GCC Viral Filtration Market Revenue (Million) Forecast, by Application 2019 & 2032
- Table 84: GCC Viral Filtration Market Volume (K Unit) Forecast, by Application 2019 & 2032
- Table 85: South Africa Viral Filtration Market Revenue (Million) Forecast, by Application 2019 & 2032
- Table 86: South Africa Viral Filtration Market Volume (K Unit) Forecast, by Application 2019 & 2032
- Table 87: Rest of Middle East and Africa Viral Filtration Market Revenue (Million) Forecast, by Application 2019 & 2032
- Table 88: Rest of Middle East and Africa Viral Filtration Market Volume (K Unit) Forecast, by Application 2019 & 2032
- Table 89: Global Viral Filtration Market Revenue Million Forecast, by Product 2019 & 2032
- Table 90: Global Viral Filtration Market Volume K Unit Forecast, by Product 2019 & 2032
- Table 91: Global Viral Filtration Market Revenue Million Forecast, by Application 2019 & 2032
- Table 92: Global Viral Filtration Market Volume K Unit Forecast, by Application 2019 & 2032
- Table 93: Global Viral Filtration Market Revenue Million Forecast, by End User 2019 & 2032
- Table 94: Global Viral Filtration Market Volume K Unit Forecast, by End User 2019 & 2032
- Table 95: Global Viral Filtration Market Revenue Million Forecast, by Country 2019 & 2032
- Table 96: Global Viral Filtration Market Volume K Unit Forecast, by Country 2019 & 2032
- Table 97: Brazil Viral Filtration Market Revenue (Million) Forecast, by Application 2019 & 2032
- Table 98: Brazil Viral Filtration Market Volume (K Unit) Forecast, by Application 2019 & 2032
- Table 99: Argentina Viral Filtration Market Revenue (Million) Forecast, by Application 2019 & 2032
- Table 100: Argentina Viral Filtration Market Volume (K Unit) Forecast, by Application 2019 & 2032
- Table 101: Rest of South America Viral Filtration Market Revenue (Million) Forecast, by Application 2019 & 2032
- Table 102: Rest of South America Viral Filtration Market Volume (K Unit) Forecast, by Application 2019 & 2032
Frequently Asked Questions
1. What is the projected Compound Annual Growth Rate (CAGR) of the Viral Filtration Market?
The projected CAGR is approximately 6.89%.
2. Which companies are prominent players in the Viral Filtration Market?
Key companies in the market include Wuxi Biologics, Charles River Laboratories International Inc, Asahi Kasei Medical Co Ltd, Sartorius AG, Lonza Group Ltd, Clean Cell Inc, Qiagen, Thermo Fischer Scientific Inc, Merck KgaA, PendoTECH, Danaher Corporation (Pall Corporation).
3. What are the main segments of the Viral Filtration Market?
The market segments include Product, Application, End User.
4. Can you provide details about the market size?
The market size is estimated to be USD 4.87 Million as of 2022.
5. What are some drivers contributing to market growth?
Increasing Pharmaceutical and Biopharmaceutical R&D Spending; Increasing Demand for Biologics; Adoption of Single-use Technologies.
6. What are the notable trends driving market growth?
The Vaccines and Therapeutics Segment is Expected to Hold a Majority Share of the Market Over the Forecast Period.
7. Are there any restraints impacting market growth?
Stringent Regulations for Validation of Filtration Products.
8. Can you provide examples of recent developments in the market?
In October 2022, PathoQuest established a new factory in Wayne, Pennsylvania. The 7000 square foot (650 square meters) facility has already started to accept new customers from all around North America and the world, enabling the testing of game-changing biologics in this crucial industry.
9. What pricing options are available for accessing the report?
Pricing options include single-user, multi-user, and enterprise licenses priced at USD 4750, USD 5250, and USD 8750 respectively.
10. Is the market size provided in terms of value or volume?
The market size is provided in terms of value, measured in Million and volume, measured in K Unit.
11. Are there any specific market keywords associated with the report?
Yes, the market keyword associated with the report is "Viral Filtration Market," which aids in identifying and referencing the specific market segment covered.
12. How do I determine which pricing option suits my needs best?
The pricing options vary based on user requirements and access needs. Individual users may opt for single-user licenses, while businesses requiring broader access may choose multi-user or enterprise licenses for cost-effective access to the report.
13. Are there any additional resources or data provided in the Viral Filtration Market report?
While the report offers comprehensive insights, it's advisable to review the specific contents or supplementary materials provided to ascertain if additional resources or data are available.
14. How can I stay updated on further developments or reports in the Viral Filtration Market?
To stay informed about further developments, trends, and reports in the Viral Filtration Market, consider subscribing to industry newsletters, following relevant companies and organizations, or regularly checking reputable industry news sources and publications.
Methodology
Step 1 - Identification of Relevant Samples Size from Population Database


Step 2 - Approaches for Defining Global Market Size (Value, Volume* & Price*)

Note*: In applicable scenarios
Step 3 - Data Sources
Primary Research
- Web Analytics
- Survey Reports
- Research Institute
- Latest Research Reports
- Opinion Leaders
Secondary Research
- Annual Reports
- White Paper
- Latest Press Release
- Industry Association
- Paid Database
- Investor Presentations

Step 4 - Data Triangulation
Involves using different sources of information in order to increase the validity of a study
These sources are likely to be stakeholders in a program - participants, other researchers, program staff, other community members, and so on.
Then we put all data in single framework & apply various statistical tools to find out the dynamic on the market.
During the analysis stage, feedback from the stakeholder groups would be compared to determine areas of agreement as well as areas of divergence


