
Key Insights
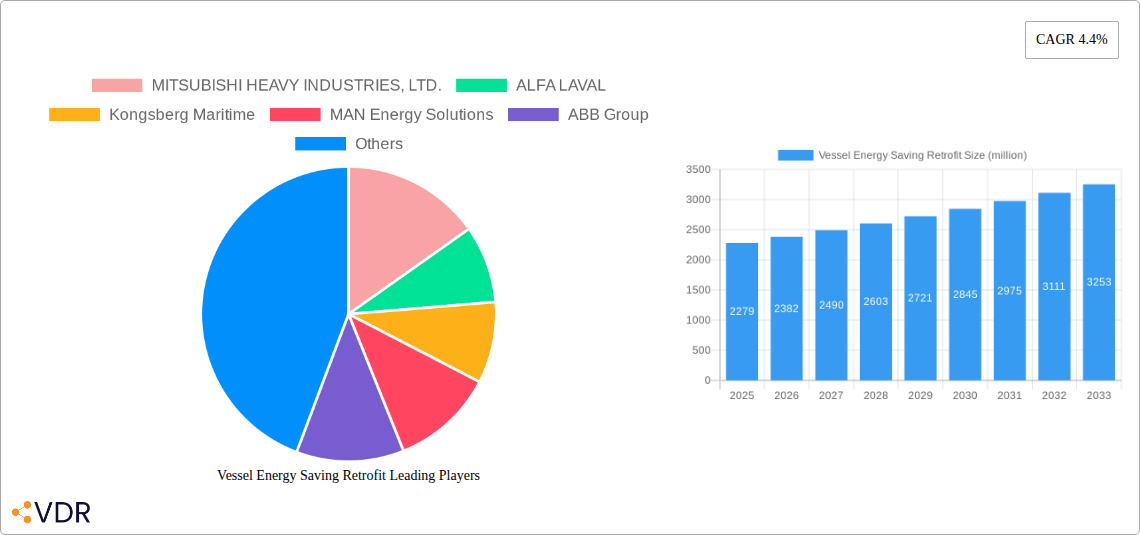
The Vessel Energy Saving Retrofit market, valued at $2279 million in 2025, is projected to experience robust growth, driven by stringent environmental regulations aimed at reducing greenhouse gas emissions from maritime activities and the increasing fuel costs. The International Maritime Organization's (IMO) 2020 sulfur cap and the ongoing push for decarbonization are key catalysts, compelling shipping companies to invest in energy-efficient technologies. This market is further propelled by advancements in retrofitting solutions, offering improved fuel efficiency and reduced operational expenses. Major players like Mitsubishi Heavy Industries, Alfa Laval, and Wärtsilä are at the forefront of innovation, developing and deploying advanced technologies such as optimized propeller designs, energy-efficient engines, and waste heat recovery systems. The market segmentation likely includes various retrofitting solutions (e.g., hull cleaning, engine optimization, renewable energy integration), vessel types (e.g., container ships, tankers, bulk carriers), and geographical regions, each presenting distinct growth opportunities. The historical period (2019-2024) likely showed moderate growth, setting the stage for the accelerated expansion predicted for the forecast period (2025-2033).
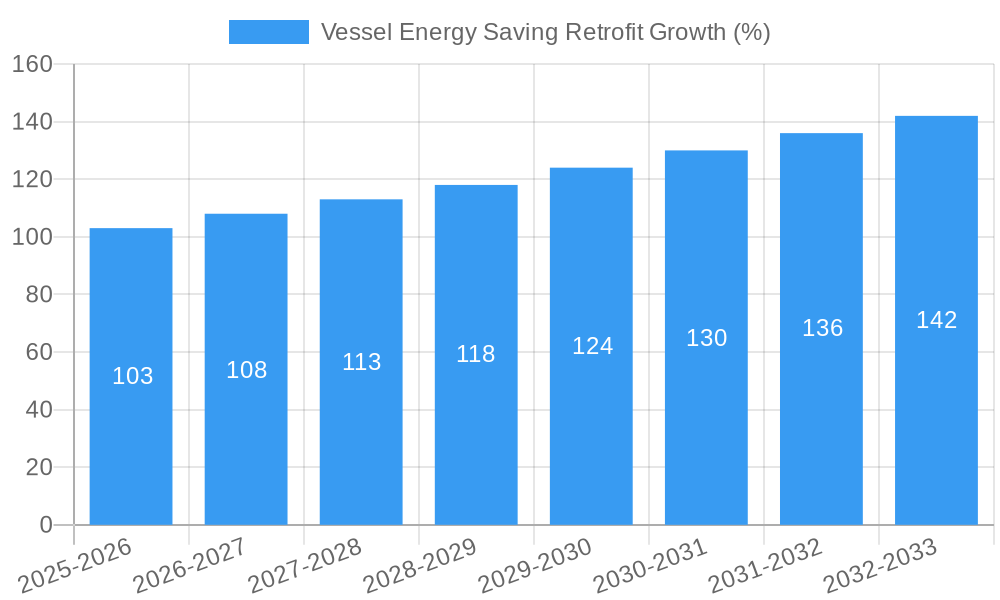
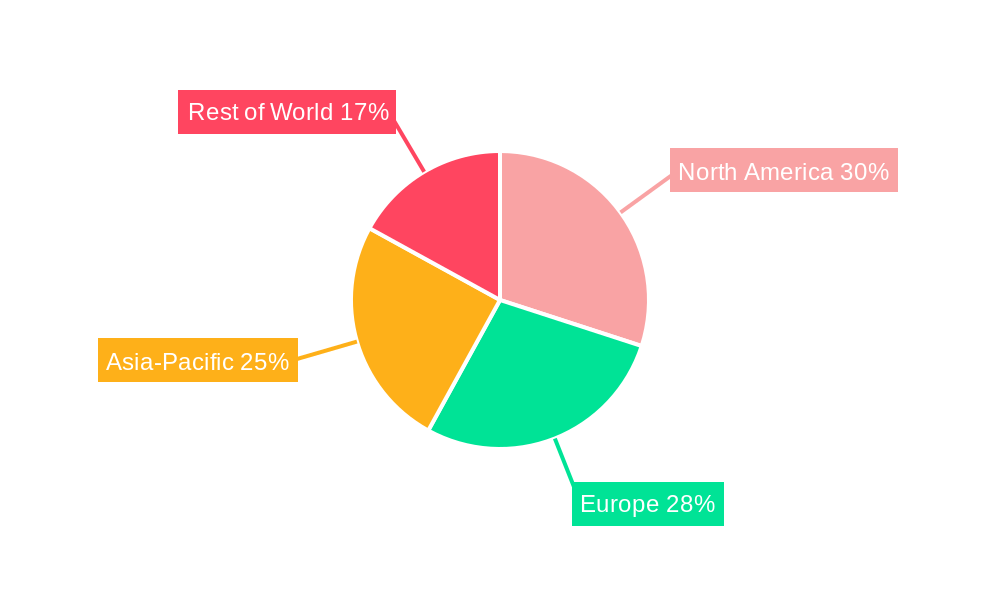
Given the 4.4% CAGR, the market is anticipated to witness substantial growth over the forecast period. While specific regional breakdowns are unavailable, it's reasonable to assume that regions with significant shipping activity, such as North America, Europe, and Asia-Pacific, will contribute the most to market growth. Potential restraints could include the high initial investment costs associated with retrofits, technological complexities, and the availability of skilled labor for installation and maintenance. However, the long-term cost savings achieved through reduced fuel consumption and compliance with environmental regulations are expected to outweigh these initial barriers, fostering continued market expansion. The competitive landscape is characterized by both established industry giants and emerging technology providers, leading to ongoing innovation and improved cost-effectiveness of retrofit solutions.
Vessel Energy Saving Retrofit Market Report: 2019-2033
This comprehensive report provides a detailed analysis of the Vessel Energy Saving Retrofit market, offering invaluable insights for industry professionals, investors, and strategic decision-makers. The study period spans from 2019 to 2033, with a base year of 2025 and a forecast period of 2025-2033. The report leverages extensive primary and secondary research, providing a granular understanding of market dynamics, growth trends, and key players. The market is segmented by vessel type (e.g., tankers, bulk carriers, containerships) and retrofit technology (e.g., propeller optimization, hull cleaning, waste heat recovery). The total market value is predicted to reach xx million by 2033.
Vessel Energy Saving Retrofit Market Dynamics & Structure
The Vessel Energy Saving Retrofit market is characterized by moderate concentration, with key players like MITSUBISHI HEAVY INDUSTRIES, LTD., ALFA LAVAL, Kongsberg Maritime, MAN Energy Solutions, ABB Group, Wärtsilä, HD Hyundai Marine Solutions Co., Ltd., YANMAR HOLDINGS Co., Ltd, DNV, and Seatrium holding significant market share. The market is driven by stringent environmental regulations (IMO 2020, etc.), rising fuel costs, and increasing awareness of operational efficiency.
- Market Concentration: Moderately concentrated, with the top 5 players holding approximately 45% market share in 2025.
- Technological Innovation: Focus on AI-powered solutions, advanced materials, and digital twin technologies for optimized retrofit designs and performance monitoring.
- Regulatory Framework: Stringent IMO regulations, including those related to greenhouse gas emissions, are major drivers. Regional variations in regulations impact market growth.
- Competitive Product Substitutes: Limited direct substitutes, but alternative fuel technologies and vessel designs pose indirect competition.
- End-User Demographics: Primarily large shipping companies and fleet operators, with increasing adoption among smaller operators due to cost-effectiveness.
- M&A Trends: A moderate number of M&A activities (approximately xx deals annually in the historical period) aimed at expanding technological capabilities and market reach are observed.
Vessel Energy Saving Retrofit Growth Trends & Insights
The Vessel Energy Saving Retrofit market witnessed significant growth during the historical period (2019-2024), with a CAGR of xx%. This growth was driven primarily by increasing fuel prices, stricter environmental regulations, and the growing adoption of energy-efficient technologies. The market size reached approximately $xx million in 2024. The estimated market size in 2025 is $xx million, reflecting a continued growth trajectory. Technological advancements, such as the integration of IoT and AI for predictive maintenance and performance optimization, are further accelerating market adoption. The forecast period (2025-2033) projects a CAGR of xx%, reaching a projected market size of $xx million by 2033. Market penetration is expected to increase significantly, driven by the increasing awareness of environmental concerns and the need for operational cost reduction amongst shipping companies.
Dominant Regions, Countries, or Segments in Vessel Energy Saving Retrofit
The Asia-Pacific region is currently the dominant market for vessel energy saving retrofits, driven by a large shipping fleet, increasing trade activity, and government initiatives to improve fuel efficiency. Europe and North America follow, influenced by stricter environmental regulations and a higher concentration of technologically advanced companies.
Key Drivers:
- Stringent environmental regulations in Europe and North America.
- Increasing trade volumes and fleet size in Asia-Pacific.
- Government incentives and subsidies for retrofitting.
- Growing awareness of fuel cost savings among shipping companies.
Dominance Factors:
- High concentration of shipping companies and fleet operators.
- Favorable government policies and support for sustainable shipping.
- Robust infrastructure and skilled workforce.
The market share distribution across regions is expected to remain relatively stable during the forecast period, with Asia-Pacific maintaining its leading position. However, growth rates in other regions might surpass Asia-Pacific's in the later years of the forecast, driven by regulatory pressures and technological advancements.
Vessel Energy Saving Retrofit Product Landscape
The Vessel Energy Saving Retrofit market encompasses a diverse range of products, including propeller optimization systems, hull cleaning technologies, waste heat recovery systems, and air lubrication systems. These products are designed to improve fuel efficiency, reduce emissions, and enhance operational performance. Recent innovations include the integration of AI and machine learning for predictive maintenance, and the development of more durable and efficient materials. The focus is increasingly shifting toward comprehensive solutions that combine multiple technologies for maximized impact. This integration approach offers unique selling propositions based on enhanced cost-effectiveness and superior performance compared to standalone solutions.
Key Drivers, Barriers & Challenges in Vessel Energy Saving Retrofit
Key Drivers:
Stringent environmental regulations (IMO 2020 and beyond), rising fuel costs, and increasing focus on operational efficiency are the primary drivers. Technological advancements, including AI-powered optimization and predictive maintenance, are also fueling market growth. Government incentives and subsidies further stimulate adoption.
Key Challenges:
High upfront investment costs remain a significant barrier to adoption, particularly for smaller shipping companies. The complexity of retrofitting operations and potential operational downtime pose challenges. Supply chain disruptions and skilled labor shortages can also impact project timelines and costs. Competition from alternative technologies such as alternative fuels might influence market trajectory.
Emerging Opportunities in Vessel Energy Saving Retrofit
Emerging opportunities include the integration of renewable energy sources, such as wind and solar power, into vessel designs, further reducing reliance on fossil fuels. The development of advanced materials and technologies, particularly in hull design and propeller optimization, presents significant potential for improved fuel efficiency. Growing demand for data-driven solutions offers scope for innovative services, such as performance monitoring and predictive maintenance. Untapped markets in developing economies, particularly in Africa and South America, represent significant growth potential.
Growth Accelerators in the Vessel Energy Saving Retrofit Industry
Technological breakthroughs, including AI-powered optimization and the development of more efficient materials, are key accelerators. Strategic partnerships between technology providers and shipping companies are essential for streamlining retrofitting processes and enhancing adoption rates. Expansion into new markets, particularly in developing economies, can significantly broaden the market's reach. Government support, through subsidies and incentives, can further accelerate market growth.
Key Players Shaping the Vessel Energy Saving Retrofit Market
- MITSUBISHI HEAVY INDUSTRIES, LTD.
- ALFA LAVAL
- Kongsberg Maritime
- MAN Energy Solutions
- ABB Group
- Wärtsilä
- HD Hyundai Marine Solutions Co., Ltd.
- YANMAR HOLDINGS Co., Ltd
- DNV
- Seatrium
Notable Milestones in Vessel Energy Saving Retrofit Sector
- 2020: IMO 2020 sulfur cap implemented, accelerating demand for retrofit solutions.
- 2021: Several major shipping companies announce significant investments in retrofitting projects.
- 2022: Launch of new AI-powered optimization platforms by leading technology providers.
- 2023: Introduction of advanced hull cleaning technologies with improved efficiency and longevity.
- 2024: Increased collaboration between shipping companies and technology providers for integrated solutions.
In-Depth Vessel Energy Saving Retrofit Market Outlook
The Vessel Energy Saving Retrofit market is poised for significant growth in the coming years, driven by sustained pressure for environmental compliance, continuous advancements in technology, and the increasing focus on operational cost optimization. Strategic partnerships and technological innovations will play a critical role in shaping the market's future. The market's growth will be further accelerated by the continuous exploration of alternative fuels and the integration of renewable energy sources in marine transport. The focus on data-driven solutions and predictive maintenance will offer further opportunities for market expansion.
Vessel Energy Saving Retrofit Segmentation
-
1. Application
- 1.1. Commercial Cargo Ships
- 1.2. Passenger Ships
- 1.3. Specialized Vessels
-
2. Type
- 2.1. Alternative Fuel Retrofits
- 2.2. Energy Efficiency Retrofits
- 2.3. Emission Control Retrofits
- 2.4. Other
Vessel Energy Saving Retrofit Segmentation By Geography
-
1. North America
- 1.1. United States
- 1.2. Canada
- 1.3. Mexico
-
2. South America
- 2.1. Brazil
- 2.2. Argentina
- 2.3. Rest of South America
-
3. Europe
- 3.1. United Kingdom
- 3.2. Germany
- 3.3. France
- 3.4. Italy
- 3.5. Spain
- 3.6. Russia
- 3.7. Benelux
- 3.8. Nordics
- 3.9. Rest of Europe
-
4. Middle East & Africa
- 4.1. Turkey
- 4.2. Israel
- 4.3. GCC
- 4.4. North Africa
- 4.5. South Africa
- 4.6. Rest of Middle East & Africa
-
5. Asia Pacific
- 5.1. China
- 5.2. India
- 5.3. Japan
- 5.4. South Korea
- 5.5. ASEAN
- 5.6. Oceania
- 5.7. Rest of Asia Pacific
Vessel Energy Saving Retrofit REPORT HIGHLIGHTS
| Aspects | Details |
|---|---|
| Study Period | 2019-2033 |
| Base Year | 2024 |
| Estimated Year | 2025 |
| Forecast Period | 2025-2033 |
| Historical Period | 2019-2024 |
| Growth Rate | CAGR of 4.4% from 2019-2033 |
| Segmentation |
|
Table of Contents
- 1. Introduction
- 1.1. Research Scope
- 1.2. Market Segmentation
- 1.3. Research Methodology
- 1.4. Definitions and Assumptions
- 2. Executive Summary
- 2.1. Introduction
- 3. Market Dynamics
- 3.1. Introduction
- 3.2. Market Drivers
- 3.3. Market Restrains
- 3.4. Market Trends
- 4. Market Factor Analysis
- 4.1. Porters Five Forces
- 4.2. Supply/Value Chain
- 4.3. PESTEL analysis
- 4.4. Market Entropy
- 4.5. Patent/Trademark Analysis
- 5. Global Vessel Energy Saving Retrofit Analysis, Insights and Forecast, 2019-2031
- 5.1. Market Analysis, Insights and Forecast - by Application
- 5.1.1. Commercial Cargo Ships
- 5.1.2. Passenger Ships
- 5.1.3. Specialized Vessels
- 5.2. Market Analysis, Insights and Forecast - by Type
- 5.2.1. Alternative Fuel Retrofits
- 5.2.2. Energy Efficiency Retrofits
- 5.2.3. Emission Control Retrofits
- 5.2.4. Other
- 5.3. Market Analysis, Insights and Forecast - by Region
- 5.3.1. North America
- 5.3.2. South America
- 5.3.3. Europe
- 5.3.4. Middle East & Africa
- 5.3.5. Asia Pacific
- 5.1. Market Analysis, Insights and Forecast - by Application
- 6. North America Vessel Energy Saving Retrofit Analysis, Insights and Forecast, 2019-2031
- 6.1. Market Analysis, Insights and Forecast - by Application
- 6.1.1. Commercial Cargo Ships
- 6.1.2. Passenger Ships
- 6.1.3. Specialized Vessels
- 6.2. Market Analysis, Insights and Forecast - by Type
- 6.2.1. Alternative Fuel Retrofits
- 6.2.2. Energy Efficiency Retrofits
- 6.2.3. Emission Control Retrofits
- 6.2.4. Other
- 6.1. Market Analysis, Insights and Forecast - by Application
- 7. South America Vessel Energy Saving Retrofit Analysis, Insights and Forecast, 2019-2031
- 7.1. Market Analysis, Insights and Forecast - by Application
- 7.1.1. Commercial Cargo Ships
- 7.1.2. Passenger Ships
- 7.1.3. Specialized Vessels
- 7.2. Market Analysis, Insights and Forecast - by Type
- 7.2.1. Alternative Fuel Retrofits
- 7.2.2. Energy Efficiency Retrofits
- 7.2.3. Emission Control Retrofits
- 7.2.4. Other
- 7.1. Market Analysis, Insights and Forecast - by Application
- 8. Europe Vessel Energy Saving Retrofit Analysis, Insights and Forecast, 2019-2031
- 8.1. Market Analysis, Insights and Forecast - by Application
- 8.1.1. Commercial Cargo Ships
- 8.1.2. Passenger Ships
- 8.1.3. Specialized Vessels
- 8.2. Market Analysis, Insights and Forecast - by Type
- 8.2.1. Alternative Fuel Retrofits
- 8.2.2. Energy Efficiency Retrofits
- 8.2.3. Emission Control Retrofits
- 8.2.4. Other
- 8.1. Market Analysis, Insights and Forecast - by Application
- 9. Middle East & Africa Vessel Energy Saving Retrofit Analysis, Insights and Forecast, 2019-2031
- 9.1. Market Analysis, Insights and Forecast - by Application
- 9.1.1. Commercial Cargo Ships
- 9.1.2. Passenger Ships
- 9.1.3. Specialized Vessels
- 9.2. Market Analysis, Insights and Forecast - by Type
- 9.2.1. Alternative Fuel Retrofits
- 9.2.2. Energy Efficiency Retrofits
- 9.2.3. Emission Control Retrofits
- 9.2.4. Other
- 9.1. Market Analysis, Insights and Forecast - by Application
- 10. Asia Pacific Vessel Energy Saving Retrofit Analysis, Insights and Forecast, 2019-2031
- 10.1. Market Analysis, Insights and Forecast - by Application
- 10.1.1. Commercial Cargo Ships
- 10.1.2. Passenger Ships
- 10.1.3. Specialized Vessels
- 10.2. Market Analysis, Insights and Forecast - by Type
- 10.2.1. Alternative Fuel Retrofits
- 10.2.2. Energy Efficiency Retrofits
- 10.2.3. Emission Control Retrofits
- 10.2.4. Other
- 10.1. Market Analysis, Insights and Forecast - by Application
- 11. Competitive Analysis
- 11.1. Global Market Share Analysis 2024
- 11.2. Company Profiles
- 11.2.1 MITSUBISHI HEAVY INDUSTRIES LTD.
- 11.2.1.1. Overview
- 11.2.1.2. Products
- 11.2.1.3. SWOT Analysis
- 11.2.1.4. Recent Developments
- 11.2.1.5. Financials (Based on Availability)
- 11.2.2 ALFA LAVAL
- 11.2.2.1. Overview
- 11.2.2.2. Products
- 11.2.2.3. SWOT Analysis
- 11.2.2.4. Recent Developments
- 11.2.2.5. Financials (Based on Availability)
- 11.2.3 Kongsberg Maritime
- 11.2.3.1. Overview
- 11.2.3.2. Products
- 11.2.3.3. SWOT Analysis
- 11.2.3.4. Recent Developments
- 11.2.3.5. Financials (Based on Availability)
- 11.2.4 MAN Energy Solutions
- 11.2.4.1. Overview
- 11.2.4.2. Products
- 11.2.4.3. SWOT Analysis
- 11.2.4.4. Recent Developments
- 11.2.4.5. Financials (Based on Availability)
- 11.2.5 ABB Group
- 11.2.5.1. Overview
- 11.2.5.2. Products
- 11.2.5.3. SWOT Analysis
- 11.2.5.4. Recent Developments
- 11.2.5.5. Financials (Based on Availability)
- 11.2.6 Wärtsilä
- 11.2.6.1. Overview
- 11.2.6.2. Products
- 11.2.6.3. SWOT Analysis
- 11.2.6.4. Recent Developments
- 11.2.6.5. Financials (Based on Availability)
- 11.2.7 HD Hyundai Marine Solutions Co. Ltd.
- 11.2.7.1. Overview
- 11.2.7.2. Products
- 11.2.7.3. SWOT Analysis
- 11.2.7.4. Recent Developments
- 11.2.7.5. Financials (Based on Availability)
- 11.2.8 YANMAR HOLDINGS Co. Ltd
- 11.2.8.1. Overview
- 11.2.8.2. Products
- 11.2.8.3. SWOT Analysis
- 11.2.8.4. Recent Developments
- 11.2.8.5. Financials (Based on Availability)
- 11.2.9 DNV
- 11.2.9.1. Overview
- 11.2.9.2. Products
- 11.2.9.3. SWOT Analysis
- 11.2.9.4. Recent Developments
- 11.2.9.5. Financials (Based on Availability)
- 11.2.10 Seatrium
- 11.2.10.1. Overview
- 11.2.10.2. Products
- 11.2.10.3. SWOT Analysis
- 11.2.10.4. Recent Developments
- 11.2.10.5. Financials (Based on Availability)
- 11.2.1 MITSUBISHI HEAVY INDUSTRIES LTD.
List of Figures
- Figure 1: Global Vessel Energy Saving Retrofit Revenue Breakdown (million, %) by Region 2024 & 2032
- Figure 2: North America Vessel Energy Saving Retrofit Revenue (million), by Application 2024 & 2032
- Figure 3: North America Vessel Energy Saving Retrofit Revenue Share (%), by Application 2024 & 2032
- Figure 4: North America Vessel Energy Saving Retrofit Revenue (million), by Type 2024 & 2032
- Figure 5: North America Vessel Energy Saving Retrofit Revenue Share (%), by Type 2024 & 2032
- Figure 6: North America Vessel Energy Saving Retrofit Revenue (million), by Country 2024 & 2032
- Figure 7: North America Vessel Energy Saving Retrofit Revenue Share (%), by Country 2024 & 2032
- Figure 8: South America Vessel Energy Saving Retrofit Revenue (million), by Application 2024 & 2032
- Figure 9: South America Vessel Energy Saving Retrofit Revenue Share (%), by Application 2024 & 2032
- Figure 10: South America Vessel Energy Saving Retrofit Revenue (million), by Type 2024 & 2032
- Figure 11: South America Vessel Energy Saving Retrofit Revenue Share (%), by Type 2024 & 2032
- Figure 12: South America Vessel Energy Saving Retrofit Revenue (million), by Country 2024 & 2032
- Figure 13: South America Vessel Energy Saving Retrofit Revenue Share (%), by Country 2024 & 2032
- Figure 14: Europe Vessel Energy Saving Retrofit Revenue (million), by Application 2024 & 2032
- Figure 15: Europe Vessel Energy Saving Retrofit Revenue Share (%), by Application 2024 & 2032
- Figure 16: Europe Vessel Energy Saving Retrofit Revenue (million), by Type 2024 & 2032
- Figure 17: Europe Vessel Energy Saving Retrofit Revenue Share (%), by Type 2024 & 2032
- Figure 18: Europe Vessel Energy Saving Retrofit Revenue (million), by Country 2024 & 2032
- Figure 19: Europe Vessel Energy Saving Retrofit Revenue Share (%), by Country 2024 & 2032
- Figure 20: Middle East & Africa Vessel Energy Saving Retrofit Revenue (million), by Application 2024 & 2032
- Figure 21: Middle East & Africa Vessel Energy Saving Retrofit Revenue Share (%), by Application 2024 & 2032
- Figure 22: Middle East & Africa Vessel Energy Saving Retrofit Revenue (million), by Type 2024 & 2032
- Figure 23: Middle East & Africa Vessel Energy Saving Retrofit Revenue Share (%), by Type 2024 & 2032
- Figure 24: Middle East & Africa Vessel Energy Saving Retrofit Revenue (million), by Country 2024 & 2032
- Figure 25: Middle East & Africa Vessel Energy Saving Retrofit Revenue Share (%), by Country 2024 & 2032
- Figure 26: Asia Pacific Vessel Energy Saving Retrofit Revenue (million), by Application 2024 & 2032
- Figure 27: Asia Pacific Vessel Energy Saving Retrofit Revenue Share (%), by Application 2024 & 2032
- Figure 28: Asia Pacific Vessel Energy Saving Retrofit Revenue (million), by Type 2024 & 2032
- Figure 29: Asia Pacific Vessel Energy Saving Retrofit Revenue Share (%), by Type 2024 & 2032
- Figure 30: Asia Pacific Vessel Energy Saving Retrofit Revenue (million), by Country 2024 & 2032
- Figure 31: Asia Pacific Vessel Energy Saving Retrofit Revenue Share (%), by Country 2024 & 2032
List of Tables
- Table 1: Global Vessel Energy Saving Retrofit Revenue million Forecast, by Region 2019 & 2032
- Table 2: Global Vessel Energy Saving Retrofit Revenue million Forecast, by Application 2019 & 2032
- Table 3: Global Vessel Energy Saving Retrofit Revenue million Forecast, by Type 2019 & 2032
- Table 4: Global Vessel Energy Saving Retrofit Revenue million Forecast, by Region 2019 & 2032
- Table 5: Global Vessel Energy Saving Retrofit Revenue million Forecast, by Application 2019 & 2032
- Table 6: Global Vessel Energy Saving Retrofit Revenue million Forecast, by Type 2019 & 2032
- Table 7: Global Vessel Energy Saving Retrofit Revenue million Forecast, by Country 2019 & 2032
- Table 8: United States Vessel Energy Saving Retrofit Revenue (million) Forecast, by Application 2019 & 2032
- Table 9: Canada Vessel Energy Saving Retrofit Revenue (million) Forecast, by Application 2019 & 2032
- Table 10: Mexico Vessel Energy Saving Retrofit Revenue (million) Forecast, by Application 2019 & 2032
- Table 11: Global Vessel Energy Saving Retrofit Revenue million Forecast, by Application 2019 & 2032
- Table 12: Global Vessel Energy Saving Retrofit Revenue million Forecast, by Type 2019 & 2032
- Table 13: Global Vessel Energy Saving Retrofit Revenue million Forecast, by Country 2019 & 2032
- Table 14: Brazil Vessel Energy Saving Retrofit Revenue (million) Forecast, by Application 2019 & 2032
- Table 15: Argentina Vessel Energy Saving Retrofit Revenue (million) Forecast, by Application 2019 & 2032
- Table 16: Rest of South America Vessel Energy Saving Retrofit Revenue (million) Forecast, by Application 2019 & 2032
- Table 17: Global Vessel Energy Saving Retrofit Revenue million Forecast, by Application 2019 & 2032
- Table 18: Global Vessel Energy Saving Retrofit Revenue million Forecast, by Type 2019 & 2032
- Table 19: Global Vessel Energy Saving Retrofit Revenue million Forecast, by Country 2019 & 2032
- Table 20: United Kingdom Vessel Energy Saving Retrofit Revenue (million) Forecast, by Application 2019 & 2032
- Table 21: Germany Vessel Energy Saving Retrofit Revenue (million) Forecast, by Application 2019 & 2032
- Table 22: France Vessel Energy Saving Retrofit Revenue (million) Forecast, by Application 2019 & 2032
- Table 23: Italy Vessel Energy Saving Retrofit Revenue (million) Forecast, by Application 2019 & 2032
- Table 24: Spain Vessel Energy Saving Retrofit Revenue (million) Forecast, by Application 2019 & 2032
- Table 25: Russia Vessel Energy Saving Retrofit Revenue (million) Forecast, by Application 2019 & 2032
- Table 26: Benelux Vessel Energy Saving Retrofit Revenue (million) Forecast, by Application 2019 & 2032
- Table 27: Nordics Vessel Energy Saving Retrofit Revenue (million) Forecast, by Application 2019 & 2032
- Table 28: Rest of Europe Vessel Energy Saving Retrofit Revenue (million) Forecast, by Application 2019 & 2032
- Table 29: Global Vessel Energy Saving Retrofit Revenue million Forecast, by Application 2019 & 2032
- Table 30: Global Vessel Energy Saving Retrofit Revenue million Forecast, by Type 2019 & 2032
- Table 31: Global Vessel Energy Saving Retrofit Revenue million Forecast, by Country 2019 & 2032
- Table 32: Turkey Vessel Energy Saving Retrofit Revenue (million) Forecast, by Application 2019 & 2032
- Table 33: Israel Vessel Energy Saving Retrofit Revenue (million) Forecast, by Application 2019 & 2032
- Table 34: GCC Vessel Energy Saving Retrofit Revenue (million) Forecast, by Application 2019 & 2032
- Table 35: North Africa Vessel Energy Saving Retrofit Revenue (million) Forecast, by Application 2019 & 2032
- Table 36: South Africa Vessel Energy Saving Retrofit Revenue (million) Forecast, by Application 2019 & 2032
- Table 37: Rest of Middle East & Africa Vessel Energy Saving Retrofit Revenue (million) Forecast, by Application 2019 & 2032
- Table 38: Global Vessel Energy Saving Retrofit Revenue million Forecast, by Application 2019 & 2032
- Table 39: Global Vessel Energy Saving Retrofit Revenue million Forecast, by Type 2019 & 2032
- Table 40: Global Vessel Energy Saving Retrofit Revenue million Forecast, by Country 2019 & 2032
- Table 41: China Vessel Energy Saving Retrofit Revenue (million) Forecast, by Application 2019 & 2032
- Table 42: India Vessel Energy Saving Retrofit Revenue (million) Forecast, by Application 2019 & 2032
- Table 43: Japan Vessel Energy Saving Retrofit Revenue (million) Forecast, by Application 2019 & 2032
- Table 44: South Korea Vessel Energy Saving Retrofit Revenue (million) Forecast, by Application 2019 & 2032
- Table 45: ASEAN Vessel Energy Saving Retrofit Revenue (million) Forecast, by Application 2019 & 2032
- Table 46: Oceania Vessel Energy Saving Retrofit Revenue (million) Forecast, by Application 2019 & 2032
- Table 47: Rest of Asia Pacific Vessel Energy Saving Retrofit Revenue (million) Forecast, by Application 2019 & 2032
Frequently Asked Questions
1. What is the projected Compound Annual Growth Rate (CAGR) of the Vessel Energy Saving Retrofit?
The projected CAGR is approximately 4.4%.
2. Which companies are prominent players in the Vessel Energy Saving Retrofit?
Key companies in the market include MITSUBISHI HEAVY INDUSTRIES, LTD., ALFA LAVAL, Kongsberg Maritime, MAN Energy Solutions, ABB Group, Wärtsilä, HD Hyundai Marine Solutions Co., Ltd., YANMAR HOLDINGS Co., Ltd, DNV, Seatrium.
3. What are the main segments of the Vessel Energy Saving Retrofit?
The market segments include Application, Type.
4. Can you provide details about the market size?
The market size is estimated to be USD 2279 million as of 2022.
5. What are some drivers contributing to market growth?
N/A
6. What are the notable trends driving market growth?
N/A
7. Are there any restraints impacting market growth?
N/A
8. Can you provide examples of recent developments in the market?
N/A
9. What pricing options are available for accessing the report?
Pricing options include single-user, multi-user, and enterprise licenses priced at USD 4250.00, USD 6375.00, and USD 8500.00 respectively.
10. Is the market size provided in terms of value or volume?
The market size is provided in terms of value, measured in million.
11. Are there any specific market keywords associated with the report?
Yes, the market keyword associated with the report is "Vessel Energy Saving Retrofit," which aids in identifying and referencing the specific market segment covered.
12. How do I determine which pricing option suits my needs best?
The pricing options vary based on user requirements and access needs. Individual users may opt for single-user licenses, while businesses requiring broader access may choose multi-user or enterprise licenses for cost-effective access to the report.
13. Are there any additional resources or data provided in the Vessel Energy Saving Retrofit report?
While the report offers comprehensive insights, it's advisable to review the specific contents or supplementary materials provided to ascertain if additional resources or data are available.
14. How can I stay updated on further developments or reports in the Vessel Energy Saving Retrofit?
To stay informed about further developments, trends, and reports in the Vessel Energy Saving Retrofit, consider subscribing to industry newsletters, following relevant companies and organizations, or regularly checking reputable industry news sources and publications.
Methodology
Step 1 - Identification of Relevant Samples Size from Population Database


Step 2 - Approaches for Defining Global Market Size (Value, Volume* & Price*)

Note*: In applicable scenarios
Step 3 - Data Sources
Primary Research
- Web Analytics
- Survey Reports
- Research Institute
- Latest Research Reports
- Opinion Leaders
Secondary Research
- Annual Reports
- White Paper
- Latest Press Release
- Industry Association
- Paid Database
- Investor Presentations

Step 4 - Data Triangulation
Involves using different sources of information in order to increase the validity of a study
These sources are likely to be stakeholders in a program - participants, other researchers, program staff, other community members, and so on.
Then we put all data in single framework & apply various statistical tools to find out the dynamic on the market.
During the analysis stage, feedback from the stakeholder groups would be compared to determine areas of agreement as well as areas of divergence


