
Key Insights
The vehicle simulation software market is experiencing robust growth, driven by the increasing demand for autonomous vehicles, advanced driver-assistance systems (ADAS), and the need for efficient vehicle development processes. The market's expansion is fueled by several key factors: the rising complexity of modern vehicles necessitates sophisticated simulation tools for testing and validation; stringent safety regulations are pushing for more comprehensive virtual testing; and the cost-effectiveness of virtual prototyping compared to physical testing is significantly impacting industry adoption. Furthermore, advancements in computing power and the availability of high-fidelity simulation models are further accelerating market growth. Major players like ANSYS, Dassault Systèmes, and Siemens are investing heavily in research and development, leading to continuous innovation in simulation capabilities. The market is segmented by software type (e.g., system simulation, 3D CAD, and others), application (e.g., autonomous driving, ADAS, and vehicle dynamics), and deployment mode (cloud-based and on-premise). Competitive dynamics are characterized by both established players and emerging companies offering specialized solutions. Challenges remain in terms of the high cost of advanced simulation software and the need for specialized expertise to effectively utilize these tools.
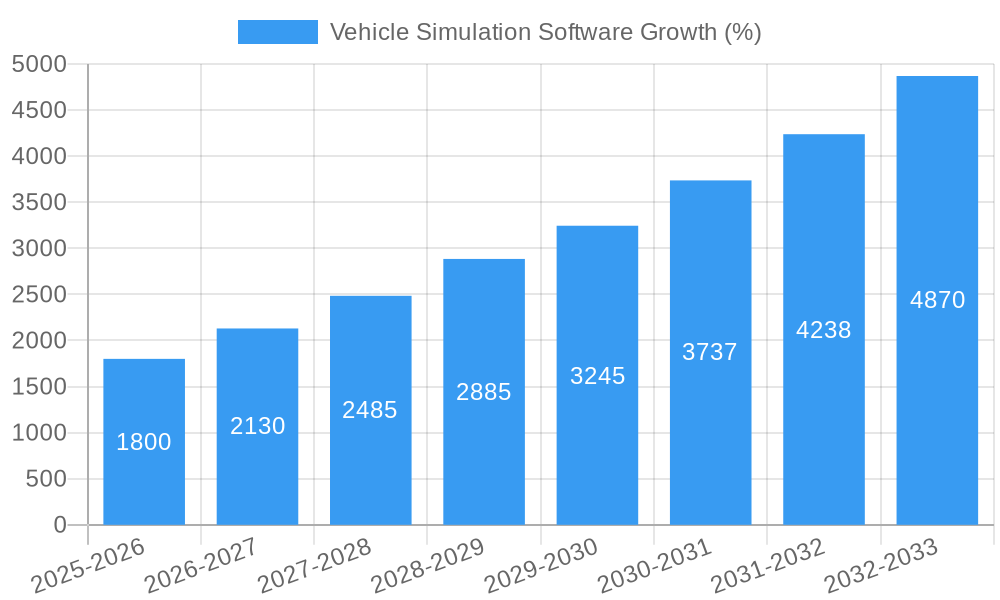
The forecast period (2025-2033) anticipates continued expansion, potentially at a Compound Annual Growth Rate (CAGR) of 15-20%, although the precise CAGR will depend on factors such as the rate of technological advancements, government regulations and overall economic conditions. The market is expected to see increased consolidation through mergers and acquisitions, as larger companies seek to expand their portfolios and market share. Growth will be geographically diverse, with North America and Europe maintaining significant market shares while regions like Asia-Pacific witness substantial growth driven by increasing automotive production and the adoption of advanced technologies in developing countries. Future growth will likely depend on the development of more accurate and efficient simulation models, integration of AI and machine learning into simulation platforms, and the emergence of new applications for vehicle simulation such as virtual twin technology.
Vehicle Simulation Software Market Report: 2019-2033
This comprehensive report provides an in-depth analysis of the Vehicle Simulation Software market, encompassing market dynamics, growth trends, regional dominance, product landscape, key players, and future outlook. The study period covers 2019-2033, with 2025 as the base and estimated year. The forecast period is 2025-2033, and the historical period is 2019-2024. This report is crucial for industry professionals, investors, and stakeholders seeking a clear understanding of this rapidly evolving market valued at xx million units in 2025 and projected to reach xx million units by 2033. The parent market is the automotive industry, while the child market includes autonomous vehicle development, ADAS testing, and vehicle dynamics simulation.
Vehicle Simulation Software Market Dynamics & Structure
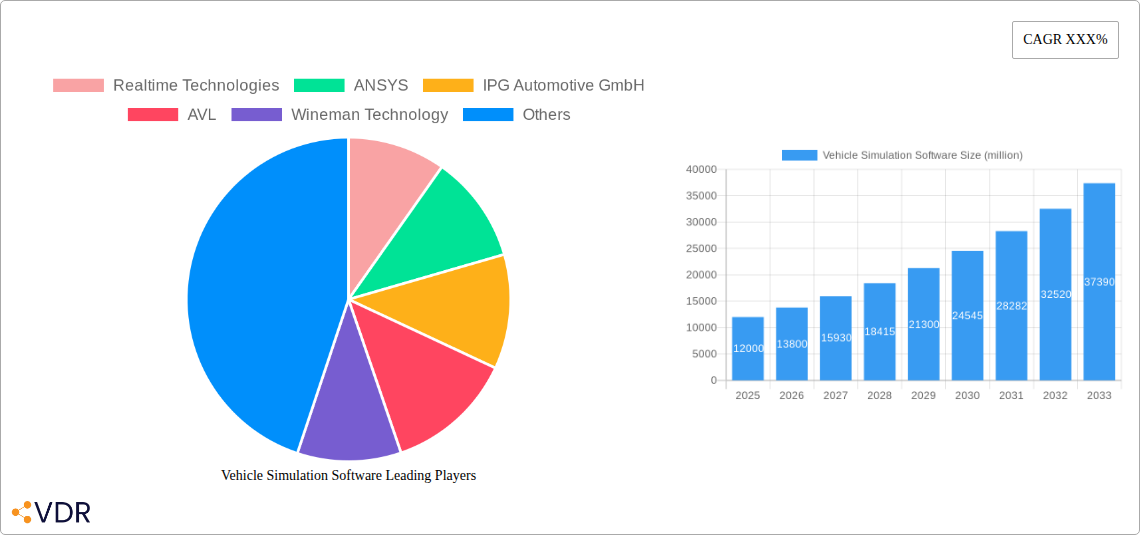
The Vehicle Simulation Software market is characterized by a moderately concentrated landscape, with key players like ANSYS, AVL, and IPG Automotive holding significant market share (estimated at xx% combined in 2025). Technological innovation, particularly in areas like AI, machine learning, and high-fidelity physics engines, is a key driver. Stringent safety regulations and emission standards across various geographies further fuel market demand. Competitive substitutes include physical prototyping and testing, but the cost-effectiveness and speed of simulation are increasingly favoring software solutions. The end-user demographics are primarily automotive OEMs, Tier-1 suppliers, and research institutions. M&A activity has been moderate in recent years, with approximately xx deals recorded between 2019 and 2024.
- Market Concentration: Moderately concentrated, with top players holding xx% market share in 2025.
- Technological Innovation: AI, machine learning, and advanced physics engines driving growth.
- Regulatory Framework: Stringent safety and emission standards boosting demand for accurate simulations.
- Competitive Substitutes: Physical prototyping and testing; however, simulation offers cost and time advantages.
- End-User Demographics: Automotive OEMs, Tier-1 suppliers, and research institutions.
- M&A Activity: Approximately xx deals between 2019 and 2024.
- Innovation Barriers: High R&D costs, complexity of integrating diverse simulation tools.
Vehicle Simulation Software Growth Trends & Insights
The Vehicle Simulation Software market has witnessed substantial growth throughout the historical period (2019-2024), driven by increased adoption across the automotive industry. The market size experienced a CAGR of xx% from 2019 to 2024, reaching xx million units in 2024. Technological advancements, such as the integration of virtual reality (VR) and augmented reality (AR) technologies, are significantly impacting market adoption rates, increasing the market penetration rate to xx% by 2025. Consumer demand for safer and more fuel-efficient vehicles is also a primary growth catalyst. The forecast period (2025-2033) is expected to witness continued robust growth, with a projected CAGR of xx%, leading to a market size of xx million units by 2033. The shift towards autonomous driving is a major factor contributing to this projected growth.
Dominant Regions, Countries, or Segments in Vehicle Simulation Software
North America and Europe currently dominate the Vehicle Simulation Software market, holding a combined market share of approximately xx% in 2025. This dominance is attributable to a strong presence of automotive manufacturers, well-established research infrastructure, and early adoption of advanced simulation technologies. However, the Asia-Pacific region is experiencing rapid growth, driven by increasing investments in automotive R&D and the expansion of electric vehicle (EV) manufacturing.
- North America: Strong presence of automotive OEMs and advanced technologies.
- Europe: Established automotive industry and focus on regulatory compliance.
- Asia-Pacific: Rapid growth due to increasing investments in automotive R&D and EV manufacturing.
- Key Drivers: Government support for automotive innovation, investments in infrastructure, growing R&D spending.
Vehicle Simulation Software Product Landscape
The Vehicle Simulation Software market offers a diverse range of products, ranging from basic vehicle dynamics simulators to highly sophisticated solutions capable of simulating complex systems like autonomous driving functionalities. Innovations include cloud-based solutions, enhanced visualization capabilities, and improved integration with other engineering tools. Unique selling propositions include accuracy, efficiency, and ease of use. Continuous improvements in computational power and algorithm sophistication are leading to more realistic and accurate simulations, resulting in faster development cycles and reduced physical prototyping costs.
Key Drivers, Barriers & Challenges in Vehicle Simulation Software
Key Drivers:
- Increasing demand for safer and more fuel-efficient vehicles.
- Growing adoption of autonomous driving technologies.
- Stringent government regulations and emission standards.
- Need for cost-effective and efficient vehicle development processes.
Challenges:
- High initial investment costs for software and hardware.
- Complexity of integrating diverse simulation tools and data sources.
- Lack of skilled professionals capable of utilizing advanced simulation software.
- Potential for inaccurate or unreliable simulation results if not properly validated. This translates into an estimated xx% project failure rate due to inaccurate simulations (2025).
Emerging Opportunities in Vehicle Simulation Software
- Growth in the autonomous driving market: The development of self-driving cars presents significant opportunities for the expansion of vehicle simulation software.
- Increased demand for digital twins: Creating digital representations of vehicles and systems offers substantial cost savings in the long run.
- Expanding use in the electrification of vehicles: Accurate simulation of electric vehicle battery systems and performance is critical for the EV industry.
Growth Accelerators in the Vehicle Simulation Software Industry
Strategic partnerships between software vendors and automotive manufacturers are accelerating market growth. The development of more user-friendly interfaces and the integration of simulation software into cloud-based platforms are also significant drivers. Technological breakthroughs in AI and high-performance computing are enhancing the speed and accuracy of simulations.
Key Players Shaping the Vehicle Simulation Software Market
- ANSYS
- AVL
- IPG Automotive GmbH
- Realtime Technologies
- Wineman Technology
- ESI Group
- MSC Software
- rFpro
- SIMUL8
- Mechanical Simulation Corporation
- PTV Group
- Cognata
- AVSimulation
- Dassault Systemes
- Hexagon
- Siemens
Notable Milestones in Vehicle Simulation Software Sector
- 2020: ANSYS released its latest version of its vehicle dynamics simulation software with enhanced capabilities.
- 2021: AVL launched a cloud-based simulation platform.
- 2022: IPG Automotive acquired a smaller simulation software company specializing in autonomous driving.
- 2023: Significant investments in AI-powered simulation technology across multiple companies.
In-Depth Vehicle Simulation Software Market Outlook
The future of the Vehicle Simulation Software market is extremely promising, driven by ongoing technological advancements, stricter safety standards, and the rise of autonomous vehicles. The continued integration of AI and machine learning in simulation tools will lead to more accurate, efficient, and sophisticated solutions. Strategic partnerships and collaborations between software vendors and automotive companies will further fuel market growth, creating significant opportunities for innovation and market expansion. The market is poised for substantial growth, exceeding xx million units by 2033.
Vehicle Simulation Software Segmentation
-
1. Application
- 1.1. Autonomous Driving Systems
- 1.2. Safety Critical Control
- 1.3. Rapid Vehicle Modeling
- 1.4. Others
-
2. Type
- 2.1. Cloud-Based Vehicle Simulation Software
- 2.2. On-Premise Vehicle Simulation Software
Vehicle Simulation Software Segmentation By Geography
-
1. North America
- 1.1. United States
- 1.2. Canada
- 1.3. Mexico
-
2. South America
- 2.1. Brazil
- 2.2. Argentina
- 2.3. Rest of South America
-
3. Europe
- 3.1. United Kingdom
- 3.2. Germany
- 3.3. France
- 3.4. Italy
- 3.5. Spain
- 3.6. Russia
- 3.7. Benelux
- 3.8. Nordics
- 3.9. Rest of Europe
-
4. Middle East & Africa
- 4.1. Turkey
- 4.2. Israel
- 4.3. GCC
- 4.4. North Africa
- 4.5. South Africa
- 4.6. Rest of Middle East & Africa
-
5. Asia Pacific
- 5.1. China
- 5.2. India
- 5.3. Japan
- 5.4. South Korea
- 5.5. ASEAN
- 5.6. Oceania
- 5.7. Rest of Asia Pacific

Vehicle Simulation Software REPORT HIGHLIGHTS
| Aspects | Details |
|---|---|
| Study Period | 2019-2033 |
| Base Year | 2024 |
| Estimated Year | 2025 |
| Forecast Period | 2025-2033 |
| Historical Period | 2019-2024 |
| Growth Rate | CAGR of XXX% from 2019-2033 |
| Segmentation |
|
Table of Contents
- 1. Introduction
- 1.1. Research Scope
- 1.2. Market Segmentation
- 1.3. Research Methodology
- 1.4. Definitions and Assumptions
- 2. Executive Summary
- 2.1. Introduction
- 3. Market Dynamics
- 3.1. Introduction
- 3.2. Market Drivers
- 3.3. Market Restrains
- 3.4. Market Trends
- 4. Market Factor Analysis
- 4.1. Porters Five Forces
- 4.2. Supply/Value Chain
- 4.3. PESTEL analysis
- 4.4. Market Entropy
- 4.5. Patent/Trademark Analysis
- 5. Global Vehicle Simulation Software Analysis, Insights and Forecast, 2019-2031
- 5.1. Market Analysis, Insights and Forecast - by Application
- 5.1.1. Autonomous Driving Systems
- 5.1.2. Safety Critical Control
- 5.1.3. Rapid Vehicle Modeling
- 5.1.4. Others
- 5.2. Market Analysis, Insights and Forecast - by Type
- 5.2.1. Cloud-Based Vehicle Simulation Software
- 5.2.2. On-Premise Vehicle Simulation Software
- 5.3. Market Analysis, Insights and Forecast - by Region
- 5.3.1. North America
- 5.3.2. South America
- 5.3.3. Europe
- 5.3.4. Middle East & Africa
- 5.3.5. Asia Pacific
- 5.1. Market Analysis, Insights and Forecast - by Application
- 6. North America Vehicle Simulation Software Analysis, Insights and Forecast, 2019-2031
- 6.1. Market Analysis, Insights and Forecast - by Application
- 6.1.1. Autonomous Driving Systems
- 6.1.2. Safety Critical Control
- 6.1.3. Rapid Vehicle Modeling
- 6.1.4. Others
- 6.2. Market Analysis, Insights and Forecast - by Type
- 6.2.1. Cloud-Based Vehicle Simulation Software
- 6.2.2. On-Premise Vehicle Simulation Software
- 6.1. Market Analysis, Insights and Forecast - by Application
- 7. South America Vehicle Simulation Software Analysis, Insights and Forecast, 2019-2031
- 7.1. Market Analysis, Insights and Forecast - by Application
- 7.1.1. Autonomous Driving Systems
- 7.1.2. Safety Critical Control
- 7.1.3. Rapid Vehicle Modeling
- 7.1.4. Others
- 7.2. Market Analysis, Insights and Forecast - by Type
- 7.2.1. Cloud-Based Vehicle Simulation Software
- 7.2.2. On-Premise Vehicle Simulation Software
- 7.1. Market Analysis, Insights and Forecast - by Application
- 8. Europe Vehicle Simulation Software Analysis, Insights and Forecast, 2019-2031
- 8.1. Market Analysis, Insights and Forecast - by Application
- 8.1.1. Autonomous Driving Systems
- 8.1.2. Safety Critical Control
- 8.1.3. Rapid Vehicle Modeling
- 8.1.4. Others
- 8.2. Market Analysis, Insights and Forecast - by Type
- 8.2.1. Cloud-Based Vehicle Simulation Software
- 8.2.2. On-Premise Vehicle Simulation Software
- 8.1. Market Analysis, Insights and Forecast - by Application
- 9. Middle East & Africa Vehicle Simulation Software Analysis, Insights and Forecast, 2019-2031
- 9.1. Market Analysis, Insights and Forecast - by Application
- 9.1.1. Autonomous Driving Systems
- 9.1.2. Safety Critical Control
- 9.1.3. Rapid Vehicle Modeling
- 9.1.4. Others
- 9.2. Market Analysis, Insights and Forecast - by Type
- 9.2.1. Cloud-Based Vehicle Simulation Software
- 9.2.2. On-Premise Vehicle Simulation Software
- 9.1. Market Analysis, Insights and Forecast - by Application
- 10. Asia Pacific Vehicle Simulation Software Analysis, Insights and Forecast, 2019-2031
- 10.1. Market Analysis, Insights and Forecast - by Application
- 10.1.1. Autonomous Driving Systems
- 10.1.2. Safety Critical Control
- 10.1.3. Rapid Vehicle Modeling
- 10.1.4. Others
- 10.2. Market Analysis, Insights and Forecast - by Type
- 10.2.1. Cloud-Based Vehicle Simulation Software
- 10.2.2. On-Premise Vehicle Simulation Software
- 10.1. Market Analysis, Insights and Forecast - by Application
- 11. Competitive Analysis
- 11.1. Global Market Share Analysis 2024
- 11.2. Company Profiles
- 11.2.1 Realtime Technologies
- 11.2.1.1. Overview
- 11.2.1.2. Products
- 11.2.1.3. SWOT Analysis
- 11.2.1.4. Recent Developments
- 11.2.1.5. Financials (Based on Availability)
- 11.2.2 ANSYS
- 11.2.2.1. Overview
- 11.2.2.2. Products
- 11.2.2.3. SWOT Analysis
- 11.2.2.4. Recent Developments
- 11.2.2.5. Financials (Based on Availability)
- 11.2.3 IPG Automotive GmbH
- 11.2.3.1. Overview
- 11.2.3.2. Products
- 11.2.3.3. SWOT Analysis
- 11.2.3.4. Recent Developments
- 11.2.3.5. Financials (Based on Availability)
- 11.2.4 AVL
- 11.2.4.1. Overview
- 11.2.4.2. Products
- 11.2.4.3. SWOT Analysis
- 11.2.4.4. Recent Developments
- 11.2.4.5. Financials (Based on Availability)
- 11.2.5 Wineman Technology
- 11.2.5.1. Overview
- 11.2.5.2. Products
- 11.2.5.3. SWOT Analysis
- 11.2.5.4. Recent Developments
- 11.2.5.5. Financials (Based on Availability)
- 11.2.6 ESI Group
- 11.2.6.1. Overview
- 11.2.6.2. Products
- 11.2.6.3. SWOT Analysis
- 11.2.6.4. Recent Developments
- 11.2.6.5. Financials (Based on Availability)
- 11.2.7 MSC Software
- 11.2.7.1. Overview
- 11.2.7.2. Products
- 11.2.7.3. SWOT Analysis
- 11.2.7.4. Recent Developments
- 11.2.7.5. Financials (Based on Availability)
- 11.2.8 rFpro
- 11.2.8.1. Overview
- 11.2.8.2. Products
- 11.2.8.3. SWOT Analysis
- 11.2.8.4. Recent Developments
- 11.2.8.5. Financials (Based on Availability)
- 11.2.9 SIMUL8
- 11.2.9.1. Overview
- 11.2.9.2. Products
- 11.2.9.3. SWOT Analysis
- 11.2.9.4. Recent Developments
- 11.2.9.5. Financials (Based on Availability)
- 11.2.10 Mechanical Simulation Corporation
- 11.2.10.1. Overview
- 11.2.10.2. Products
- 11.2.10.3. SWOT Analysis
- 11.2.10.4. Recent Developments
- 11.2.10.5. Financials (Based on Availability)
- 11.2.11 PTV Group
- 11.2.11.1. Overview
- 11.2.11.2. Products
- 11.2.11.3. SWOT Analysis
- 11.2.11.4. Recent Developments
- 11.2.11.5. Financials (Based on Availability)
- 11.2.12 Cognata
- 11.2.12.1. Overview
- 11.2.12.2. Products
- 11.2.12.3. SWOT Analysis
- 11.2.12.4. Recent Developments
- 11.2.12.5. Financials (Based on Availability)
- 11.2.13 AVSimulation
- 11.2.13.1. Overview
- 11.2.13.2. Products
- 11.2.13.3. SWOT Analysis
- 11.2.13.4. Recent Developments
- 11.2.13.5. Financials (Based on Availability)
- 11.2.14 Dassault Systemes
- 11.2.14.1. Overview
- 11.2.14.2. Products
- 11.2.14.3. SWOT Analysis
- 11.2.14.4. Recent Developments
- 11.2.14.5. Financials (Based on Availability)
- 11.2.15 Hexagon
- 11.2.15.1. Overview
- 11.2.15.2. Products
- 11.2.15.3. SWOT Analysis
- 11.2.15.4. Recent Developments
- 11.2.15.5. Financials (Based on Availability)
- 11.2.16 Siemens
- 11.2.16.1. Overview
- 11.2.16.2. Products
- 11.2.16.3. SWOT Analysis
- 11.2.16.4. Recent Developments
- 11.2.16.5. Financials (Based on Availability)
- 11.2.1 Realtime Technologies
List of Figures
- Figure 1: Global Vehicle Simulation Software Revenue Breakdown (million, %) by Region 2024 & 2032
- Figure 2: North America Vehicle Simulation Software Revenue (million), by Application 2024 & 2032
- Figure 3: North America Vehicle Simulation Software Revenue Share (%), by Application 2024 & 2032
- Figure 4: North America Vehicle Simulation Software Revenue (million), by Type 2024 & 2032
- Figure 5: North America Vehicle Simulation Software Revenue Share (%), by Type 2024 & 2032
- Figure 6: North America Vehicle Simulation Software Revenue (million), by Country 2024 & 2032
- Figure 7: North America Vehicle Simulation Software Revenue Share (%), by Country 2024 & 2032
- Figure 8: South America Vehicle Simulation Software Revenue (million), by Application 2024 & 2032
- Figure 9: South America Vehicle Simulation Software Revenue Share (%), by Application 2024 & 2032
- Figure 10: South America Vehicle Simulation Software Revenue (million), by Type 2024 & 2032
- Figure 11: South America Vehicle Simulation Software Revenue Share (%), by Type 2024 & 2032
- Figure 12: South America Vehicle Simulation Software Revenue (million), by Country 2024 & 2032
- Figure 13: South America Vehicle Simulation Software Revenue Share (%), by Country 2024 & 2032
- Figure 14: Europe Vehicle Simulation Software Revenue (million), by Application 2024 & 2032
- Figure 15: Europe Vehicle Simulation Software Revenue Share (%), by Application 2024 & 2032
- Figure 16: Europe Vehicle Simulation Software Revenue (million), by Type 2024 & 2032
- Figure 17: Europe Vehicle Simulation Software Revenue Share (%), by Type 2024 & 2032
- Figure 18: Europe Vehicle Simulation Software Revenue (million), by Country 2024 & 2032
- Figure 19: Europe Vehicle Simulation Software Revenue Share (%), by Country 2024 & 2032
- Figure 20: Middle East & Africa Vehicle Simulation Software Revenue (million), by Application 2024 & 2032
- Figure 21: Middle East & Africa Vehicle Simulation Software Revenue Share (%), by Application 2024 & 2032
- Figure 22: Middle East & Africa Vehicle Simulation Software Revenue (million), by Type 2024 & 2032
- Figure 23: Middle East & Africa Vehicle Simulation Software Revenue Share (%), by Type 2024 & 2032
- Figure 24: Middle East & Africa Vehicle Simulation Software Revenue (million), by Country 2024 & 2032
- Figure 25: Middle East & Africa Vehicle Simulation Software Revenue Share (%), by Country 2024 & 2032
- Figure 26: Asia Pacific Vehicle Simulation Software Revenue (million), by Application 2024 & 2032
- Figure 27: Asia Pacific Vehicle Simulation Software Revenue Share (%), by Application 2024 & 2032
- Figure 28: Asia Pacific Vehicle Simulation Software Revenue (million), by Type 2024 & 2032
- Figure 29: Asia Pacific Vehicle Simulation Software Revenue Share (%), by Type 2024 & 2032
- Figure 30: Asia Pacific Vehicle Simulation Software Revenue (million), by Country 2024 & 2032
- Figure 31: Asia Pacific Vehicle Simulation Software Revenue Share (%), by Country 2024 & 2032
List of Tables
- Table 1: Global Vehicle Simulation Software Revenue million Forecast, by Region 2019 & 2032
- Table 2: Global Vehicle Simulation Software Revenue million Forecast, by Application 2019 & 2032
- Table 3: Global Vehicle Simulation Software Revenue million Forecast, by Type 2019 & 2032
- Table 4: Global Vehicle Simulation Software Revenue million Forecast, by Region 2019 & 2032
- Table 5: Global Vehicle Simulation Software Revenue million Forecast, by Application 2019 & 2032
- Table 6: Global Vehicle Simulation Software Revenue million Forecast, by Type 2019 & 2032
- Table 7: Global Vehicle Simulation Software Revenue million Forecast, by Country 2019 & 2032
- Table 8: United States Vehicle Simulation Software Revenue (million) Forecast, by Application 2019 & 2032
- Table 9: Canada Vehicle Simulation Software Revenue (million) Forecast, by Application 2019 & 2032
- Table 10: Mexico Vehicle Simulation Software Revenue (million) Forecast, by Application 2019 & 2032
- Table 11: Global Vehicle Simulation Software Revenue million Forecast, by Application 2019 & 2032
- Table 12: Global Vehicle Simulation Software Revenue million Forecast, by Type 2019 & 2032
- Table 13: Global Vehicle Simulation Software Revenue million Forecast, by Country 2019 & 2032
- Table 14: Brazil Vehicle Simulation Software Revenue (million) Forecast, by Application 2019 & 2032
- Table 15: Argentina Vehicle Simulation Software Revenue (million) Forecast, by Application 2019 & 2032
- Table 16: Rest of South America Vehicle Simulation Software Revenue (million) Forecast, by Application 2019 & 2032
- Table 17: Global Vehicle Simulation Software Revenue million Forecast, by Application 2019 & 2032
- Table 18: Global Vehicle Simulation Software Revenue million Forecast, by Type 2019 & 2032
- Table 19: Global Vehicle Simulation Software Revenue million Forecast, by Country 2019 & 2032
- Table 20: United Kingdom Vehicle Simulation Software Revenue (million) Forecast, by Application 2019 & 2032
- Table 21: Germany Vehicle Simulation Software Revenue (million) Forecast, by Application 2019 & 2032
- Table 22: France Vehicle Simulation Software Revenue (million) Forecast, by Application 2019 & 2032
- Table 23: Italy Vehicle Simulation Software Revenue (million) Forecast, by Application 2019 & 2032
- Table 24: Spain Vehicle Simulation Software Revenue (million) Forecast, by Application 2019 & 2032
- Table 25: Russia Vehicle Simulation Software Revenue (million) Forecast, by Application 2019 & 2032
- Table 26: Benelux Vehicle Simulation Software Revenue (million) Forecast, by Application 2019 & 2032
- Table 27: Nordics Vehicle Simulation Software Revenue (million) Forecast, by Application 2019 & 2032
- Table 28: Rest of Europe Vehicle Simulation Software Revenue (million) Forecast, by Application 2019 & 2032
- Table 29: Global Vehicle Simulation Software Revenue million Forecast, by Application 2019 & 2032
- Table 30: Global Vehicle Simulation Software Revenue million Forecast, by Type 2019 & 2032
- Table 31: Global Vehicle Simulation Software Revenue million Forecast, by Country 2019 & 2032
- Table 32: Turkey Vehicle Simulation Software Revenue (million) Forecast, by Application 2019 & 2032
- Table 33: Israel Vehicle Simulation Software Revenue (million) Forecast, by Application 2019 & 2032
- Table 34: GCC Vehicle Simulation Software Revenue (million) Forecast, by Application 2019 & 2032
- Table 35: North Africa Vehicle Simulation Software Revenue (million) Forecast, by Application 2019 & 2032
- Table 36: South Africa Vehicle Simulation Software Revenue (million) Forecast, by Application 2019 & 2032
- Table 37: Rest of Middle East & Africa Vehicle Simulation Software Revenue (million) Forecast, by Application 2019 & 2032
- Table 38: Global Vehicle Simulation Software Revenue million Forecast, by Application 2019 & 2032
- Table 39: Global Vehicle Simulation Software Revenue million Forecast, by Type 2019 & 2032
- Table 40: Global Vehicle Simulation Software Revenue million Forecast, by Country 2019 & 2032
- Table 41: China Vehicle Simulation Software Revenue (million) Forecast, by Application 2019 & 2032
- Table 42: India Vehicle Simulation Software Revenue (million) Forecast, by Application 2019 & 2032
- Table 43: Japan Vehicle Simulation Software Revenue (million) Forecast, by Application 2019 & 2032
- Table 44: South Korea Vehicle Simulation Software Revenue (million) Forecast, by Application 2019 & 2032
- Table 45: ASEAN Vehicle Simulation Software Revenue (million) Forecast, by Application 2019 & 2032
- Table 46: Oceania Vehicle Simulation Software Revenue (million) Forecast, by Application 2019 & 2032
- Table 47: Rest of Asia Pacific Vehicle Simulation Software Revenue (million) Forecast, by Application 2019 & 2032
Frequently Asked Questions
1. What is the projected Compound Annual Growth Rate (CAGR) of the Vehicle Simulation Software?
The projected CAGR is approximately XXX%.
2. Which companies are prominent players in the Vehicle Simulation Software?
Key companies in the market include Realtime Technologies, ANSYS, IPG Automotive GmbH, AVL, Wineman Technology, ESI Group, MSC Software, rFpro, SIMUL8, Mechanical Simulation Corporation, PTV Group, Cognata, AVSimulation, Dassault Systemes, Hexagon, Siemens.
3. What are the main segments of the Vehicle Simulation Software?
The market segments include Application, Type.
4. Can you provide details about the market size?
The market size is estimated to be USD XXX million as of 2022.
5. What are some drivers contributing to market growth?
N/A
6. What are the notable trends driving market growth?
N/A
7. Are there any restraints impacting market growth?
N/A
8. Can you provide examples of recent developments in the market?
N/A
9. What pricing options are available for accessing the report?
Pricing options include single-user, multi-user, and enterprise licenses priced at USD 2900.00, USD 4350.00, and USD 5800.00 respectively.
10. Is the market size provided in terms of value or volume?
The market size is provided in terms of value, measured in million.
11. Are there any specific market keywords associated with the report?
Yes, the market keyword associated with the report is "Vehicle Simulation Software," which aids in identifying and referencing the specific market segment covered.
12. How do I determine which pricing option suits my needs best?
The pricing options vary based on user requirements and access needs. Individual users may opt for single-user licenses, while businesses requiring broader access may choose multi-user or enterprise licenses for cost-effective access to the report.
13. Are there any additional resources or data provided in the Vehicle Simulation Software report?
While the report offers comprehensive insights, it's advisable to review the specific contents or supplementary materials provided to ascertain if additional resources or data are available.
14. How can I stay updated on further developments or reports in the Vehicle Simulation Software?
To stay informed about further developments, trends, and reports in the Vehicle Simulation Software, consider subscribing to industry newsletters, following relevant companies and organizations, or regularly checking reputable industry news sources and publications.
Methodology
Step 1 - Identification of Relevant Samples Size from Population Database


Step 2 - Approaches for Defining Global Market Size (Value, Volume* & Price*)

Note*: In applicable scenarios
Step 3 - Data Sources
Primary Research
- Web Analytics
- Survey Reports
- Research Institute
- Latest Research Reports
- Opinion Leaders
Secondary Research
- Annual Reports
- White Paper
- Latest Press Release
- Industry Association
- Paid Database
- Investor Presentations

Step 4 - Data Triangulation
Involves using different sources of information in order to increase the validity of a study
These sources are likely to be stakeholders in a program - participants, other researchers, program staff, other community members, and so on.
Then we put all data in single framework & apply various statistical tools to find out the dynamic on the market.
During the analysis stage, feedback from the stakeholder groups would be compared to determine areas of agreement as well as areas of divergence


