
Key Insights
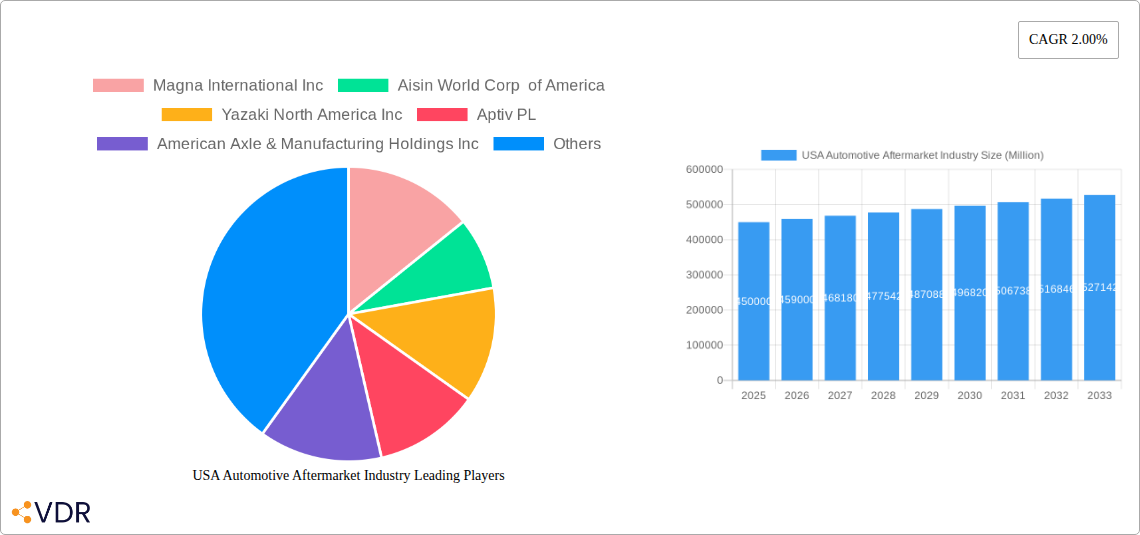
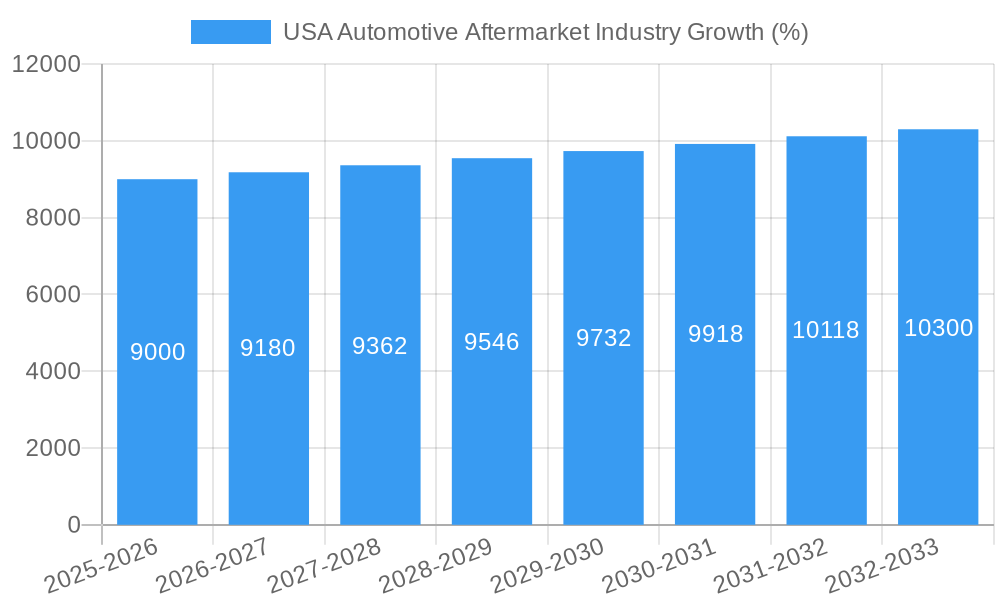
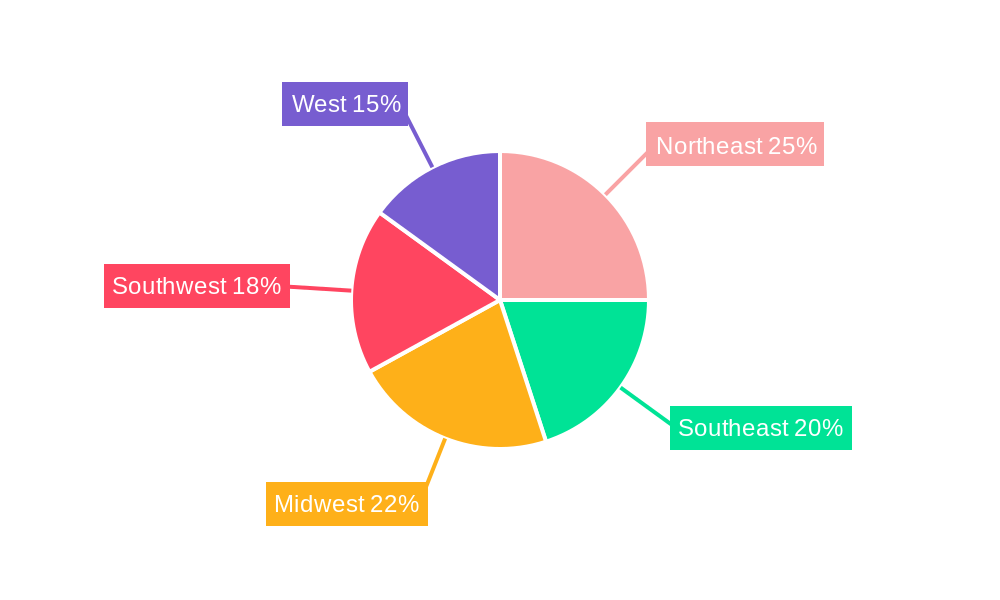
The US automotive aftermarket industry, valued at approximately $450 billion in 2025, is projected to experience steady growth, with a Compound Annual Growth Rate (CAGR) of 2.00% from 2025 to 2033. This growth is fueled by several key factors. The increasing age of vehicles on the road leads to higher repair and maintenance needs, driving demand for replacement parts and services. Furthermore, technological advancements in vehicle systems are creating opportunities for advanced aftermarket components, particularly in areas like advanced driver-assistance systems (ADAS) and connected car technologies. Growing consumer preference for vehicle customization and personalization further contributes to market expansion. The industry is segmented by vehicle type (passenger cars dominating), application (engine components, transmission, interior, exterior, other), and sales channels (online and offline, with online witnessing faster growth). Major players like Magna International, Aisin, Yazaki, and Bosch compete fiercely, leveraging technological innovation and strategic partnerships to maintain market share. Regional variations exist, with the Northeast and West potentially exhibiting higher growth due to factors like higher vehicle density and disposable income. However, economic downturns and fluctuations in fuel prices could act as restraints, impacting consumer spending on non-essential automotive repairs and upgrades.
The competitive landscape is characterized by both large multinational corporations and smaller specialized suppliers. The increasing adoption of electric and hybrid vehicles presents both challenges and opportunities. While it may initially reduce the demand for certain traditional components, it also creates new markets for specialized electric vehicle parts and service solutions. The industry is also witnessing a shift toward data-driven services and predictive maintenance, utilizing connected car technology to anticipate maintenance needs and optimize repair schedules. This trend fosters customer loyalty and improves operational efficiency for aftermarket businesses. To effectively compete, companies need to focus on providing high-quality products, superior customer service, and leveraging digital technologies to streamline operations and reach a wider customer base. Successfully navigating these market dynamics requires strategic investments in R&D, supply chain optimization, and innovative business models.
USA Automotive Aftermarket Industry: A Comprehensive Market Report (2019-2033)
This in-depth report provides a comprehensive analysis of the USA Automotive Aftermarket Industry, covering market dynamics, growth trends, key players, and future outlook. With a focus on both passenger car and commercial vehicle segments, this report is essential for industry professionals, investors, and strategic decision-makers seeking to understand and capitalize on opportunities within this dynamic market. The study period spans 2019-2033, with a base year of 2025 and a forecast period of 2025-2033. The market size is presented in Million units.
USA Automotive Aftermarket Industry Market Dynamics & Structure
The USA automotive aftermarket industry is characterized by a moderately concentrated market structure, with key players like Magna International Inc, Aisin World Corp of America, and Robert Bosch GmbH holding significant market share. Technological innovation, particularly in areas like electrification and advanced driver-assistance systems (ADAS), is a major driver of growth, alongside evolving consumer preferences for enhanced vehicle performance and personalization. Stringent regulatory frameworks concerning emissions and safety standards also influence market dynamics. The industry witnesses continuous mergers and acquisitions (M&A) activity, with deal volumes averaging xx in the historical period (2019-2024). The increasing demand for electric vehicles is driving innovation in battery technology and charging infrastructure, significantly impacting the aftermarket sector. Substitute products, such as repair kits and DIY solutions, exist, however the demand for professionally installed aftermarket parts remains robust.
- Market Concentration: Moderately concentrated, with top 10 players holding xx% market share in 2024.
- Technological Innovation: Focus on electrification, ADAS, and connected car technologies.
- Regulatory Framework: Stringent emission and safety standards influence product development.
- Competitive Landscape: Intense competition among established players and emerging entrants.
- M&A Activity: Average xx deals per year (2019-2024), driven by market consolidation and technology acquisition.
- End-User Demographics: Shifting consumer preferences towards personalized vehicle modifications and performance enhancements.
USA Automotive Aftermarket Industry Growth Trends & Insights
The USA automotive aftermarket industry experienced robust growth during the historical period (2019-2024), driven by a rising vehicle parc, increasing vehicle age, and growing consumer spending on vehicle maintenance and upgrades. The market size reached xx million units in 2024 and is projected to reach xx million units by 2025 and xx million units by 2033, exhibiting a Compound Annual Growth Rate (CAGR) of xx% during the forecast period (2025-2033). This growth is further fueled by technological advancements, resulting in increased adoption rates of advanced aftermarket parts. Changing consumer behavior, including a preference for customized vehicles and DIY solutions, are additional factors contributing to the market expansion. The penetration rate of aftermarket parts is expected to increase from xx% in 2024 to xx% in 2033.
Dominant Regions, Countries, or Segments in USA Automotive Aftermarket Industry
The passenger car segment dominates the USA automotive aftermarket, accounting for xx% of the total market in 2024. However, the commercial vehicle segment is exhibiting faster growth, driven by increased demand for heavy-duty vehicle maintenance and repair. Within applications, the engine components segment holds a large share, followed by the interior and exterior segments. The online sales channel is witnessing rapid growth due to improved e-commerce infrastructure and consumer convenience. Key drivers for regional growth include favorable economic conditions, robust infrastructure development, and supportive government policies. The Western region of the USA leads in market share, attributed to high vehicle ownership and consumer spending.
- Vehicle Type: Passenger Cars (xx million units in 2024), Commercial Vehicles (xx million units in 2024).
- Application: Engine Components (xx million units in 2024), Interior (xx million units in 2024), Exterior (xx million units in 2024), Transmission (xx million units in 2024), Other Applications (xx million units in 2024).
- Sales Channel: Offline (xx million units in 2024), Online (xx million units in 2024).
- Regional Dominance: Western region holds the largest market share driven by xx.
USA Automotive Aftermarket Industry Product Landscape
The USA automotive aftermarket showcases a diverse product landscape, including performance parts, customization accessories, maintenance items, and repair components. Recent innovations focus on enhancing vehicle efficiency, safety, and connectivity. Key product advancements involve integrating advanced materials, leveraging IoT technologies, and developing user-friendly installation solutions. Unique selling propositions emphasize performance improvements, enhanced aesthetics, and extended vehicle lifespan.
Key Drivers, Barriers & Challenges in USA Automotive Aftermarket Industry
Key Drivers: Rising vehicle parc, increasing vehicle age, growing consumer spending on vehicle maintenance and modifications, technological advancements (ADAS, electrification), and supportive government policies stimulating the industry.
Challenges: Supply chain disruptions due to global events impacting part availability and increasing costs. Stringent regulatory compliance requirements and intense competition from established and emerging players. The fluctuating price of raw materials causes unpredictable cost impacts.
Emerging Opportunities in USA Automotive Aftermarket Industry
Untapped market segments, such as electric vehicle aftermarket parts and connected car accessories, present significant growth opportunities. The increasing demand for personalized vehicle customizations, particularly amongst younger consumers, presents another lucrative avenue. Furthermore, leveraging advanced technologies, like AI-powered diagnostic tools and predictive maintenance solutions, can create new revenue streams.
Growth Accelerators in the USA Automotive Aftermarket Industry Industry
Technological advancements, particularly in electric vehicle (EV) technology and ADAS, are crucial growth catalysts. Strategic partnerships between aftermarket suppliers and vehicle manufacturers will foster product development and market penetration. Market expansion strategies targeting untapped customer segments and geographic regions can further propel growth. Furthermore, investments in research and development will be crucial for staying ahead of the curve and introducing innovative products.
Key Players Shaping the USA Automotive Aftermarket Industry Market
- Magna International Inc. (Magna International Inc.)
- Aisin World Corp of America
- Yazaki North America Inc.
- Aptiv PL (Aptiv PL)
- American Axle & Manufacturing Holdings Inc.
- Panasonic Automotive Systems Company of America
- Continental AG (Continental AG)
- Flex-N-Gate Corporation
- Robert Bosch GmbH (Robert Bosch GmbH)
- Lear Corporation (Lear Corporation)
- Faurecia (Faurecia)
- DENSO Corporation (DENSO Corporation)
- Adient PLC (Adient PLC)
- ZF Friedrichshafen AG (ZF Friedrichshafen AG)
Notable Milestones in USA Automotive Aftermarket Industry Sector
- December 2022: BorgWarner Inc. announced plans to spin off its Fuel Systems and Aftermarket businesses, focusing on EV technologies. This signals a significant shift towards meeting the growing demand for electric vehicle components within the aftermarket sector.
- August 2022: Cummins Inc.'s acquisition of Meritor, Inc. strengthened its position in integrated powertrain solutions, including electric power applications, enhancing its presence within the commercial vehicle aftermarket.
- June 2022: Meritor, Inc. launched the ProTec Independent Front Suspension (IFS) for motorcoaches, showcasing innovation in heavy-duty vehicle components. This product launch caters to a specific niche within the commercial vehicle aftermarket.
In-Depth USA Automotive Aftermarket Industry Market Outlook
The future of the USA automotive aftermarket industry is bright, driven by continuous technological innovation, evolving consumer preferences, and a growing vehicle parc. Strategic partnerships and investments in research and development will be key to capturing the emerging opportunities presented by electrification, ADAS, and connected car technologies. Companies that adapt quickly to changing market dynamics and offer innovative, high-quality products will be best positioned to thrive in this dynamic industry. The market is expected to continue to grow at a healthy pace, offering substantial opportunities for both established players and new entrants.
USA Automotive Aftermarket Industry Segmentation
-
1. Vehicle Type
- 1.1. Passenger Cars
- 1.2. Commercial Vehicles
-
2. Application
- 2.1. Engine Components
- 2.2. Transmission
- 2.3. Interior
- 2.4. Exterior
- 2.5. Other Applications
-
3. Sales Channel
- 3.1. Online
- 3.2. Offline
USA Automotive Aftermarket Industry Segmentation By Geography
-
1. North America
- 1.1. United States
- 1.2. Canada
- 1.3. Mexico
-
2. South America
- 2.1. Brazil
- 2.2. Argentina
- 2.3. Rest of South America
-
3. Europe
- 3.1. United Kingdom
- 3.2. Germany
- 3.3. France
- 3.4. Italy
- 3.5. Spain
- 3.6. Russia
- 3.7. Benelux
- 3.8. Nordics
- 3.9. Rest of Europe
-
4. Middle East & Africa
- 4.1. Turkey
- 4.2. Israel
- 4.3. GCC
- 4.4. North Africa
- 4.5. South Africa
- 4.6. Rest of Middle East & Africa
-
5. Asia Pacific
- 5.1. China
- 5.2. India
- 5.3. Japan
- 5.4. South Korea
- 5.5. ASEAN
- 5.6. Oceania
- 5.7. Rest of Asia Pacific
USA Automotive Aftermarket Industry REPORT HIGHLIGHTS
| Aspects | Details |
|---|---|
| Study Period | 2019-2033 |
| Base Year | 2024 |
| Estimated Year | 2025 |
| Forecast Period | 2025-2033 |
| Historical Period | 2019-2024 |
| Growth Rate | CAGR of 2.00% from 2019-2033 |
| Segmentation |
|
Table of Contents
- 1. Introduction
- 1.1. Research Scope
- 1.2. Market Segmentation
- 1.3. Research Methodology
- 1.4. Definitions and Assumptions
- 2. Executive Summary
- 2.1. Introduction
- 3. Market Dynamics
- 3.1. Introduction
- 3.2. Market Drivers
- 3.2.1. Rising Recreational and Motorsports Activities is Expected to Drive the Market; Others
- 3.3. Market Restrains
- 3.3.1. High Value and Maintenance Cost Offered to Restrain the Market Growth; Others
- 3.4. Market Trends
- 3.4.1. Rising Online Aftermarket Automotive Parts and Components Sales
- 4. Market Factor Analysis
- 4.1. Porters Five Forces
- 4.2. Supply/Value Chain
- 4.3. PESTEL analysis
- 4.4. Market Entropy
- 4.5. Patent/Trademark Analysis
- 5. Global USA Automotive Aftermarket Industry Analysis, Insights and Forecast, 2019-2031
- 5.1. Market Analysis, Insights and Forecast - by Vehicle Type
- 5.1.1. Passenger Cars
- 5.1.2. Commercial Vehicles
- 5.2. Market Analysis, Insights and Forecast - by Application
- 5.2.1. Engine Components
- 5.2.2. Transmission
- 5.2.3. Interior
- 5.2.4. Exterior
- 5.2.5. Other Applications
- 5.3. Market Analysis, Insights and Forecast - by Sales Channel
- 5.3.1. Online
- 5.3.2. Offline
- 5.4. Market Analysis, Insights and Forecast - by Region
- 5.4.1. North America
- 5.4.2. South America
- 5.4.3. Europe
- 5.4.4. Middle East & Africa
- 5.4.5. Asia Pacific
- 5.1. Market Analysis, Insights and Forecast - by Vehicle Type
- 6. North America USA Automotive Aftermarket Industry Analysis, Insights and Forecast, 2019-2031
- 6.1. Market Analysis, Insights and Forecast - by Vehicle Type
- 6.1.1. Passenger Cars
- 6.1.2. Commercial Vehicles
- 6.2. Market Analysis, Insights and Forecast - by Application
- 6.2.1. Engine Components
- 6.2.2. Transmission
- 6.2.3. Interior
- 6.2.4. Exterior
- 6.2.5. Other Applications
- 6.3. Market Analysis, Insights and Forecast - by Sales Channel
- 6.3.1. Online
- 6.3.2. Offline
- 6.1. Market Analysis, Insights and Forecast - by Vehicle Type
- 7. South America USA Automotive Aftermarket Industry Analysis, Insights and Forecast, 2019-2031
- 7.1. Market Analysis, Insights and Forecast - by Vehicle Type
- 7.1.1. Passenger Cars
- 7.1.2. Commercial Vehicles
- 7.2. Market Analysis, Insights and Forecast - by Application
- 7.2.1. Engine Components
- 7.2.2. Transmission
- 7.2.3. Interior
- 7.2.4. Exterior
- 7.2.5. Other Applications
- 7.3. Market Analysis, Insights and Forecast - by Sales Channel
- 7.3.1. Online
- 7.3.2. Offline
- 7.1. Market Analysis, Insights and Forecast - by Vehicle Type
- 8. Europe USA Automotive Aftermarket Industry Analysis, Insights and Forecast, 2019-2031
- 8.1. Market Analysis, Insights and Forecast - by Vehicle Type
- 8.1.1. Passenger Cars
- 8.1.2. Commercial Vehicles
- 8.2. Market Analysis, Insights and Forecast - by Application
- 8.2.1. Engine Components
- 8.2.2. Transmission
- 8.2.3. Interior
- 8.2.4. Exterior
- 8.2.5. Other Applications
- 8.3. Market Analysis, Insights and Forecast - by Sales Channel
- 8.3.1. Online
- 8.3.2. Offline
- 8.1. Market Analysis, Insights and Forecast - by Vehicle Type
- 9. Middle East & Africa USA Automotive Aftermarket Industry Analysis, Insights and Forecast, 2019-2031
- 9.1. Market Analysis, Insights and Forecast - by Vehicle Type
- 9.1.1. Passenger Cars
- 9.1.2. Commercial Vehicles
- 9.2. Market Analysis, Insights and Forecast - by Application
- 9.2.1. Engine Components
- 9.2.2. Transmission
- 9.2.3. Interior
- 9.2.4. Exterior
- 9.2.5. Other Applications
- 9.3. Market Analysis, Insights and Forecast - by Sales Channel
- 9.3.1. Online
- 9.3.2. Offline
- 9.1. Market Analysis, Insights and Forecast - by Vehicle Type
- 10. Asia Pacific USA Automotive Aftermarket Industry Analysis, Insights and Forecast, 2019-2031
- 10.1. Market Analysis, Insights and Forecast - by Vehicle Type
- 10.1.1. Passenger Cars
- 10.1.2. Commercial Vehicles
- 10.2. Market Analysis, Insights and Forecast - by Application
- 10.2.1. Engine Components
- 10.2.2. Transmission
- 10.2.3. Interior
- 10.2.4. Exterior
- 10.2.5. Other Applications
- 10.3. Market Analysis, Insights and Forecast - by Sales Channel
- 10.3.1. Online
- 10.3.2. Offline
- 10.1. Market Analysis, Insights and Forecast - by Vehicle Type
- 11. Northeast USA Automotive Aftermarket Industry Analysis, Insights and Forecast, 2019-2031
- 12. Southeast USA Automotive Aftermarket Industry Analysis, Insights and Forecast, 2019-2031
- 13. Midwest USA Automotive Aftermarket Industry Analysis, Insights and Forecast, 2019-2031
- 14. Southwest USA Automotive Aftermarket Industry Analysis, Insights and Forecast, 2019-2031
- 15. West USA Automotive Aftermarket Industry Analysis, Insights and Forecast, 2019-2031
- 16. Competitive Analysis
- 16.1. Global Market Share Analysis 2024
- 16.2. Company Profiles
- 16.2.1 Magna International Inc
- 16.2.1.1. Overview
- 16.2.1.2. Products
- 16.2.1.3. SWOT Analysis
- 16.2.1.4. Recent Developments
- 16.2.1.5. Financials (Based on Availability)
- 16.2.2 Aisin World Corp of America
- 16.2.2.1. Overview
- 16.2.2.2. Products
- 16.2.2.3. SWOT Analysis
- 16.2.2.4. Recent Developments
- 16.2.2.5. Financials (Based on Availability)
- 16.2.3 Yazaki North America Inc
- 16.2.3.1. Overview
- 16.2.3.2. Products
- 16.2.3.3. SWOT Analysis
- 16.2.3.4. Recent Developments
- 16.2.3.5. Financials (Based on Availability)
- 16.2.4 Aptiv PL
- 16.2.4.1. Overview
- 16.2.4.2. Products
- 16.2.4.3. SWOT Analysis
- 16.2.4.4. Recent Developments
- 16.2.4.5. Financials (Based on Availability)
- 16.2.5 American Axle & Manufacturing Holdings Inc
- 16.2.5.1. Overview
- 16.2.5.2. Products
- 16.2.5.3. SWOT Analysis
- 16.2.5.4. Recent Developments
- 16.2.5.5. Financials (Based on Availability)
- 16.2.6 Panasonic Automotive Systems Company of America
- 16.2.6.1. Overview
- 16.2.6.2. Products
- 16.2.6.3. SWOT Analysis
- 16.2.6.4. Recent Developments
- 16.2.6.5. Financials (Based on Availability)
- 16.2.7 Continental AG
- 16.2.7.1. Overview
- 16.2.7.2. Products
- 16.2.7.3. SWOT Analysis
- 16.2.7.4. Recent Developments
- 16.2.7.5. Financials (Based on Availability)
- 16.2.8 Flex-N-Gate Corporation
- 16.2.8.1. Overview
- 16.2.8.2. Products
- 16.2.8.3. SWOT Analysis
- 16.2.8.4. Recent Developments
- 16.2.8.5. Financials (Based on Availability)
- 16.2.9 Robert Bosch GmbH
- 16.2.9.1. Overview
- 16.2.9.2. Products
- 16.2.9.3. SWOT Analysis
- 16.2.9.4. Recent Developments
- 16.2.9.5. Financials (Based on Availability)
- 16.2.10 Lear Corporation
- 16.2.10.1. Overview
- 16.2.10.2. Products
- 16.2.10.3. SWOT Analysis
- 16.2.10.4. Recent Developments
- 16.2.10.5. Financials (Based on Availability)
- 16.2.11 Faurecia
- 16.2.11.1. Overview
- 16.2.11.2. Products
- 16.2.11.3. SWOT Analysis
- 16.2.11.4. Recent Developments
- 16.2.11.5. Financials (Based on Availability)
- 16.2.12 DENSO Corporation
- 16.2.12.1. Overview
- 16.2.12.2. Products
- 16.2.12.3. SWOT Analysis
- 16.2.12.4. Recent Developments
- 16.2.12.5. Financials (Based on Availability)
- 16.2.13 Adient PLC
- 16.2.13.1. Overview
- 16.2.13.2. Products
- 16.2.13.3. SWOT Analysis
- 16.2.13.4. Recent Developments
- 16.2.13.5. Financials (Based on Availability)
- 16.2.14 ZF Friedrichshafen AG
- 16.2.14.1. Overview
- 16.2.14.2. Products
- 16.2.14.3. SWOT Analysis
- 16.2.14.4. Recent Developments
- 16.2.14.5. Financials (Based on Availability)
- 16.2.1 Magna International Inc
List of Figures
- Figure 1: Global USA Automotive Aftermarket Industry Revenue Breakdown (Million, %) by Region 2024 & 2032
- Figure 2: United states USA Automotive Aftermarket Industry Revenue (Million), by Country 2024 & 2032
- Figure 3: United states USA Automotive Aftermarket Industry Revenue Share (%), by Country 2024 & 2032
- Figure 4: North America USA Automotive Aftermarket Industry Revenue (Million), by Vehicle Type 2024 & 2032
- Figure 5: North America USA Automotive Aftermarket Industry Revenue Share (%), by Vehicle Type 2024 & 2032
- Figure 6: North America USA Automotive Aftermarket Industry Revenue (Million), by Application 2024 & 2032
- Figure 7: North America USA Automotive Aftermarket Industry Revenue Share (%), by Application 2024 & 2032
- Figure 8: North America USA Automotive Aftermarket Industry Revenue (Million), by Sales Channel 2024 & 2032
- Figure 9: North America USA Automotive Aftermarket Industry Revenue Share (%), by Sales Channel 2024 & 2032
- Figure 10: North America USA Automotive Aftermarket Industry Revenue (Million), by Country 2024 & 2032
- Figure 11: North America USA Automotive Aftermarket Industry Revenue Share (%), by Country 2024 & 2032
- Figure 12: South America USA Automotive Aftermarket Industry Revenue (Million), by Vehicle Type 2024 & 2032
- Figure 13: South America USA Automotive Aftermarket Industry Revenue Share (%), by Vehicle Type 2024 & 2032
- Figure 14: South America USA Automotive Aftermarket Industry Revenue (Million), by Application 2024 & 2032
- Figure 15: South America USA Automotive Aftermarket Industry Revenue Share (%), by Application 2024 & 2032
- Figure 16: South America USA Automotive Aftermarket Industry Revenue (Million), by Sales Channel 2024 & 2032
- Figure 17: South America USA Automotive Aftermarket Industry Revenue Share (%), by Sales Channel 2024 & 2032
- Figure 18: South America USA Automotive Aftermarket Industry Revenue (Million), by Country 2024 & 2032
- Figure 19: South America USA Automotive Aftermarket Industry Revenue Share (%), by Country 2024 & 2032
- Figure 20: Europe USA Automotive Aftermarket Industry Revenue (Million), by Vehicle Type 2024 & 2032
- Figure 21: Europe USA Automotive Aftermarket Industry Revenue Share (%), by Vehicle Type 2024 & 2032
- Figure 22: Europe USA Automotive Aftermarket Industry Revenue (Million), by Application 2024 & 2032
- Figure 23: Europe USA Automotive Aftermarket Industry Revenue Share (%), by Application 2024 & 2032
- Figure 24: Europe USA Automotive Aftermarket Industry Revenue (Million), by Sales Channel 2024 & 2032
- Figure 25: Europe USA Automotive Aftermarket Industry Revenue Share (%), by Sales Channel 2024 & 2032
- Figure 26: Europe USA Automotive Aftermarket Industry Revenue (Million), by Country 2024 & 2032
- Figure 27: Europe USA Automotive Aftermarket Industry Revenue Share (%), by Country 2024 & 2032
- Figure 28: Middle East & Africa USA Automotive Aftermarket Industry Revenue (Million), by Vehicle Type 2024 & 2032
- Figure 29: Middle East & Africa USA Automotive Aftermarket Industry Revenue Share (%), by Vehicle Type 2024 & 2032
- Figure 30: Middle East & Africa USA Automotive Aftermarket Industry Revenue (Million), by Application 2024 & 2032
- Figure 31: Middle East & Africa USA Automotive Aftermarket Industry Revenue Share (%), by Application 2024 & 2032
- Figure 32: Middle East & Africa USA Automotive Aftermarket Industry Revenue (Million), by Sales Channel 2024 & 2032
- Figure 33: Middle East & Africa USA Automotive Aftermarket Industry Revenue Share (%), by Sales Channel 2024 & 2032
- Figure 34: Middle East & Africa USA Automotive Aftermarket Industry Revenue (Million), by Country 2024 & 2032
- Figure 35: Middle East & Africa USA Automotive Aftermarket Industry Revenue Share (%), by Country 2024 & 2032
- Figure 36: Asia Pacific USA Automotive Aftermarket Industry Revenue (Million), by Vehicle Type 2024 & 2032
- Figure 37: Asia Pacific USA Automotive Aftermarket Industry Revenue Share (%), by Vehicle Type 2024 & 2032
- Figure 38: Asia Pacific USA Automotive Aftermarket Industry Revenue (Million), by Application 2024 & 2032
- Figure 39: Asia Pacific USA Automotive Aftermarket Industry Revenue Share (%), by Application 2024 & 2032
- Figure 40: Asia Pacific USA Automotive Aftermarket Industry Revenue (Million), by Sales Channel 2024 & 2032
- Figure 41: Asia Pacific USA Automotive Aftermarket Industry Revenue Share (%), by Sales Channel 2024 & 2032
- Figure 42: Asia Pacific USA Automotive Aftermarket Industry Revenue (Million), by Country 2024 & 2032
- Figure 43: Asia Pacific USA Automotive Aftermarket Industry Revenue Share (%), by Country 2024 & 2032
List of Tables
- Table 1: Global USA Automotive Aftermarket Industry Revenue Million Forecast, by Region 2019 & 2032
- Table 2: Global USA Automotive Aftermarket Industry Revenue Million Forecast, by Vehicle Type 2019 & 2032
- Table 3: Global USA Automotive Aftermarket Industry Revenue Million Forecast, by Application 2019 & 2032
- Table 4: Global USA Automotive Aftermarket Industry Revenue Million Forecast, by Sales Channel 2019 & 2032
- Table 5: Global USA Automotive Aftermarket Industry Revenue Million Forecast, by Region 2019 & 2032
- Table 6: Global USA Automotive Aftermarket Industry Revenue Million Forecast, by Country 2019 & 2032
- Table 7: Northeast USA Automotive Aftermarket Industry Revenue (Million) Forecast, by Application 2019 & 2032
- Table 8: Southeast USA Automotive Aftermarket Industry Revenue (Million) Forecast, by Application 2019 & 2032
- Table 9: Midwest USA Automotive Aftermarket Industry Revenue (Million) Forecast, by Application 2019 & 2032
- Table 10: Southwest USA Automotive Aftermarket Industry Revenue (Million) Forecast, by Application 2019 & 2032
- Table 11: West USA Automotive Aftermarket Industry Revenue (Million) Forecast, by Application 2019 & 2032
- Table 12: Global USA Automotive Aftermarket Industry Revenue Million Forecast, by Vehicle Type 2019 & 2032
- Table 13: Global USA Automotive Aftermarket Industry Revenue Million Forecast, by Application 2019 & 2032
- Table 14: Global USA Automotive Aftermarket Industry Revenue Million Forecast, by Sales Channel 2019 & 2032
- Table 15: Global USA Automotive Aftermarket Industry Revenue Million Forecast, by Country 2019 & 2032
- Table 16: United States USA Automotive Aftermarket Industry Revenue (Million) Forecast, by Application 2019 & 2032
- Table 17: Canada USA Automotive Aftermarket Industry Revenue (Million) Forecast, by Application 2019 & 2032
- Table 18: Mexico USA Automotive Aftermarket Industry Revenue (Million) Forecast, by Application 2019 & 2032
- Table 19: Global USA Automotive Aftermarket Industry Revenue Million Forecast, by Vehicle Type 2019 & 2032
- Table 20: Global USA Automotive Aftermarket Industry Revenue Million Forecast, by Application 2019 & 2032
- Table 21: Global USA Automotive Aftermarket Industry Revenue Million Forecast, by Sales Channel 2019 & 2032
- Table 22: Global USA Automotive Aftermarket Industry Revenue Million Forecast, by Country 2019 & 2032
- Table 23: Brazil USA Automotive Aftermarket Industry Revenue (Million) Forecast, by Application 2019 & 2032
- Table 24: Argentina USA Automotive Aftermarket Industry Revenue (Million) Forecast, by Application 2019 & 2032
- Table 25: Rest of South America USA Automotive Aftermarket Industry Revenue (Million) Forecast, by Application 2019 & 2032
- Table 26: Global USA Automotive Aftermarket Industry Revenue Million Forecast, by Vehicle Type 2019 & 2032
- Table 27: Global USA Automotive Aftermarket Industry Revenue Million Forecast, by Application 2019 & 2032
- Table 28: Global USA Automotive Aftermarket Industry Revenue Million Forecast, by Sales Channel 2019 & 2032
- Table 29: Global USA Automotive Aftermarket Industry Revenue Million Forecast, by Country 2019 & 2032
- Table 30: United Kingdom USA Automotive Aftermarket Industry Revenue (Million) Forecast, by Application 2019 & 2032
- Table 31: Germany USA Automotive Aftermarket Industry Revenue (Million) Forecast, by Application 2019 & 2032
- Table 32: France USA Automotive Aftermarket Industry Revenue (Million) Forecast, by Application 2019 & 2032
- Table 33: Italy USA Automotive Aftermarket Industry Revenue (Million) Forecast, by Application 2019 & 2032
- Table 34: Spain USA Automotive Aftermarket Industry Revenue (Million) Forecast, by Application 2019 & 2032
- Table 35: Russia USA Automotive Aftermarket Industry Revenue (Million) Forecast, by Application 2019 & 2032
- Table 36: Benelux USA Automotive Aftermarket Industry Revenue (Million) Forecast, by Application 2019 & 2032
- Table 37: Nordics USA Automotive Aftermarket Industry Revenue (Million) Forecast, by Application 2019 & 2032
- Table 38: Rest of Europe USA Automotive Aftermarket Industry Revenue (Million) Forecast, by Application 2019 & 2032
- Table 39: Global USA Automotive Aftermarket Industry Revenue Million Forecast, by Vehicle Type 2019 & 2032
- Table 40: Global USA Automotive Aftermarket Industry Revenue Million Forecast, by Application 2019 & 2032
- Table 41: Global USA Automotive Aftermarket Industry Revenue Million Forecast, by Sales Channel 2019 & 2032
- Table 42: Global USA Automotive Aftermarket Industry Revenue Million Forecast, by Country 2019 & 2032
- Table 43: Turkey USA Automotive Aftermarket Industry Revenue (Million) Forecast, by Application 2019 & 2032
- Table 44: Israel USA Automotive Aftermarket Industry Revenue (Million) Forecast, by Application 2019 & 2032
- Table 45: GCC USA Automotive Aftermarket Industry Revenue (Million) Forecast, by Application 2019 & 2032
- Table 46: North Africa USA Automotive Aftermarket Industry Revenue (Million) Forecast, by Application 2019 & 2032
- Table 47: South Africa USA Automotive Aftermarket Industry Revenue (Million) Forecast, by Application 2019 & 2032
- Table 48: Rest of Middle East & Africa USA Automotive Aftermarket Industry Revenue (Million) Forecast, by Application 2019 & 2032
- Table 49: Global USA Automotive Aftermarket Industry Revenue Million Forecast, by Vehicle Type 2019 & 2032
- Table 50: Global USA Automotive Aftermarket Industry Revenue Million Forecast, by Application 2019 & 2032
- Table 51: Global USA Automotive Aftermarket Industry Revenue Million Forecast, by Sales Channel 2019 & 2032
- Table 52: Global USA Automotive Aftermarket Industry Revenue Million Forecast, by Country 2019 & 2032
- Table 53: China USA Automotive Aftermarket Industry Revenue (Million) Forecast, by Application 2019 & 2032
- Table 54: India USA Automotive Aftermarket Industry Revenue (Million) Forecast, by Application 2019 & 2032
- Table 55: Japan USA Automotive Aftermarket Industry Revenue (Million) Forecast, by Application 2019 & 2032
- Table 56: South Korea USA Automotive Aftermarket Industry Revenue (Million) Forecast, by Application 2019 & 2032
- Table 57: ASEAN USA Automotive Aftermarket Industry Revenue (Million) Forecast, by Application 2019 & 2032
- Table 58: Oceania USA Automotive Aftermarket Industry Revenue (Million) Forecast, by Application 2019 & 2032
- Table 59: Rest of Asia Pacific USA Automotive Aftermarket Industry Revenue (Million) Forecast, by Application 2019 & 2032
Frequently Asked Questions
1. What is the projected Compound Annual Growth Rate (CAGR) of the USA Automotive Aftermarket Industry?
The projected CAGR is approximately 2.00%.
2. Which companies are prominent players in the USA Automotive Aftermarket Industry?
Key companies in the market include Magna International Inc, Aisin World Corp of America, Yazaki North America Inc, Aptiv PL, American Axle & Manufacturing Holdings Inc, Panasonic Automotive Systems Company of America, Continental AG, Flex-N-Gate Corporation, Robert Bosch GmbH, Lear Corporation, Faurecia, DENSO Corporation, Adient PLC, ZF Friedrichshafen AG.
3. What are the main segments of the USA Automotive Aftermarket Industry?
The market segments include Vehicle Type, Application, Sales Channel.
4. Can you provide details about the market size?
The market size is estimated to be USD XX Million as of 2022.
5. What are some drivers contributing to market growth?
Rising Recreational and Motorsports Activities is Expected to Drive the Market; Others.
6. What are the notable trends driving market growth?
Rising Online Aftermarket Automotive Parts and Components Sales.
7. Are there any restraints impacting market growth?
High Value and Maintenance Cost Offered to Restrain the Market Growth; Others.
8. Can you provide examples of recent developments in the market?
December 2022: BorgWarner Inc announced plans to spin off their Fuel Systems and Aftermarket businesses into a separate, publicly traded company, which they are currently calling "NewCo." NewCo also intends to capitalize on growth trends in gasoline direct injection (GDI) and hydrogen injection systems. With this announcement, BorgWarner believes it will eventually meet or exceed its stated target of 25% revenue from EVs by 2025.
9. What pricing options are available for accessing the report?
Pricing options include single-user, multi-user, and enterprise licenses priced at USD 3800, USD 4500, and USD 5800 respectively.
10. Is the market size provided in terms of value or volume?
The market size is provided in terms of value, measured in Million.
11. Are there any specific market keywords associated with the report?
Yes, the market keyword associated with the report is "USA Automotive Aftermarket Industry," which aids in identifying and referencing the specific market segment covered.
12. How do I determine which pricing option suits my needs best?
The pricing options vary based on user requirements and access needs. Individual users may opt for single-user licenses, while businesses requiring broader access may choose multi-user or enterprise licenses for cost-effective access to the report.
13. Are there any additional resources or data provided in the USA Automotive Aftermarket Industry report?
While the report offers comprehensive insights, it's advisable to review the specific contents or supplementary materials provided to ascertain if additional resources or data are available.
14. How can I stay updated on further developments or reports in the USA Automotive Aftermarket Industry?
To stay informed about further developments, trends, and reports in the USA Automotive Aftermarket Industry, consider subscribing to industry newsletters, following relevant companies and organizations, or regularly checking reputable industry news sources and publications.
Methodology
Step 1 - Identification of Relevant Samples Size from Population Database


Step 2 - Approaches for Defining Global Market Size (Value, Volume* & Price*)

Note*: In applicable scenarios
Step 3 - Data Sources
Primary Research
- Web Analytics
- Survey Reports
- Research Institute
- Latest Research Reports
- Opinion Leaders
Secondary Research
- Annual Reports
- White Paper
- Latest Press Release
- Industry Association
- Paid Database
- Investor Presentations

Step 4 - Data Triangulation
Involves using different sources of information in order to increase the validity of a study
These sources are likely to be stakeholders in a program - participants, other researchers, program staff, other community members, and so on.
Then we put all data in single framework & apply various statistical tools to find out the dynamic on the market.
During the analysis stage, feedback from the stakeholder groups would be compared to determine areas of agreement as well as areas of divergence


