

Key Insights
The global commercial vehicle market is projected to reach $839.97 billion by 2033, driven by a compound annual growth rate (CAGR) of 5.74% from a base year of 2024. Key growth drivers include increasing demand for efficient logistics, particularly within e-commerce, construction, and manufacturing sectors. The transition to sustainable transportation, marked by the adoption of hybrid and electric commercial vehicles, is a significant opportunity, further accelerated by government initiatives promoting cleaner emissions. Technological advancements in telematics, automation, and driver-assistance systems are enhancing operational efficiency and safety, boosting the appeal of modern commercial vehicles. While initial high costs for electric vehicles and infrastructure requirements present challenges, these are being mitigated through incentives, technological improvements, and innovative financing. Market segmentation highlights strong growth in LPG-powered vehicles in regions with accessible fuel sources, while hybrid and electric segments are expected to see exponential expansion, eventually surpassing traditional fuel vehicles.
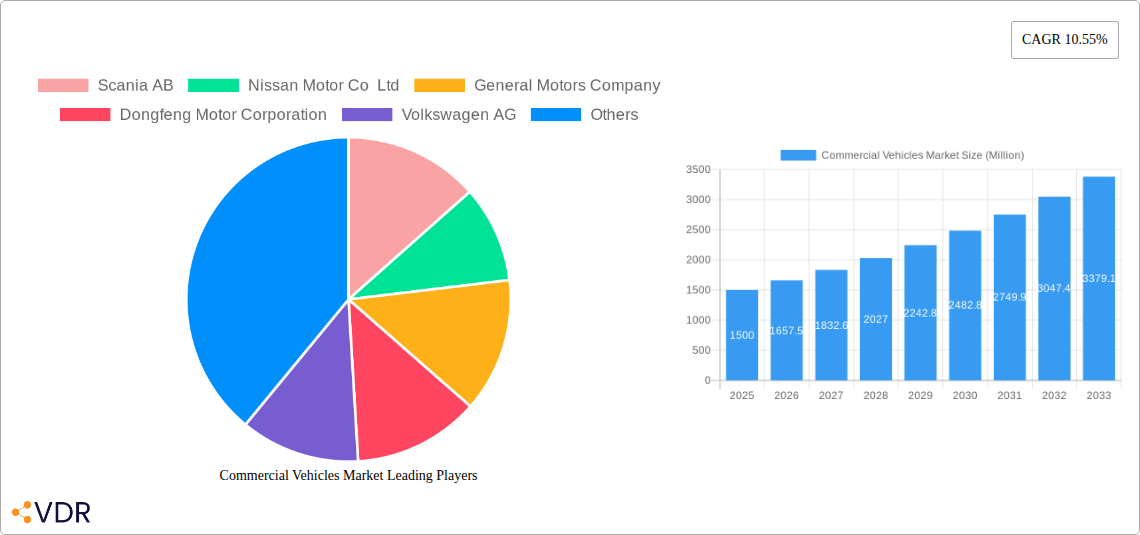
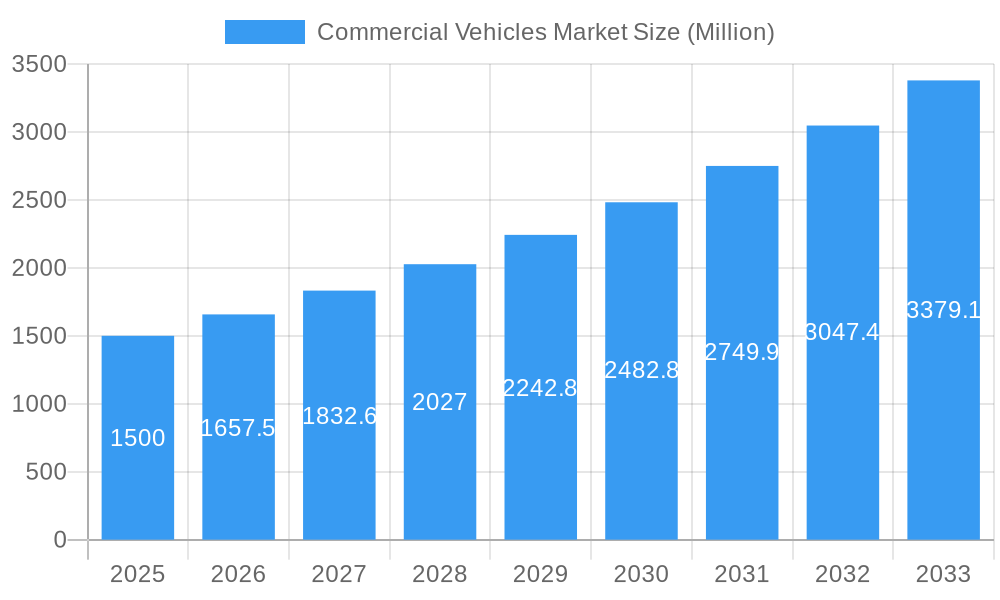
Commercial Vehicles Market Market Size (In Billion)
Leading manufacturers, including Scania, Nissan, and General Motors, are strategically investing in R&D, partnerships, and global expansion to leverage this expanding market. The competitive landscape is characterized by intense innovation and differentiation. Growth rates vary regionally, with developing economies experiencing accelerated expansion due to infrastructure development and rising incomes, while advanced economies see steady growth from fleet upgrades and sustainable solutions. The integration of advanced driver-assistance systems (ADAS) and autonomous driving technologies is set to revolutionize market dynamics by further enhancing safety and efficiency. This evolving market, shaped by technological innovation, regulatory shifts, and economic factors, presents a complex yet promising growth trajectory. Detailed regional analysis and individual company performance insights will offer deeper understanding of this dynamic sector.
Commercial Vehicles Market Company Market Share
Commercial Vehicles Market: A Comprehensive Market Report (2019-2033)
This comprehensive report provides an in-depth analysis of the Commercial Vehicles Market, encompassing historical data (2019-2024), current estimates (2025), and future forecasts (2025-2033). We delve into market dynamics, growth trends, key players, and emerging opportunities across various segments, including LPG vehicles, Hybrid and Electric Vehicles (HEVs), and diverse vehicle types within the commercial vehicle sector. The report utilizes rigorous methodologies and leverages extensive data to offer actionable insights for industry professionals, investors, and strategic decision-makers.
Commercial Vehicles Market Dynamics & Structure
This section analyzes the competitive landscape of the commercial vehicles market, examining market concentration, technological advancements, regulatory influences, and prevalent substitution effects. We explore end-user demographics, mergers and acquisitions (M&A) activities, and their collective impact on market evolution. The study period covers 2019-2033, with 2025 serving as the base year.
- Market Concentration: The global commercial vehicle market exhibits a moderately concentrated structure, with a handful of major players commanding significant market share. The top five players account for approximately xx% of the global market in 2025. This concentration is expected to xx% by 2033.
- Technological Innovation: Significant technological advancements, particularly in alternative fuel technologies (LPG, Hybrid, Electric), are reshaping the market. However, high R&D costs and the need for extensive infrastructure development present key barriers to wider adoption.
- Regulatory Frameworks: Stringent emission norms and fuel efficiency standards implemented globally are driving the shift towards cleaner and more sustainable commercial vehicles. These regulations vary across regions, creating both opportunities and challenges for manufacturers.
- Competitive Product Substitutes: The emergence of alternative transportation solutions, such as autonomous delivery systems and advanced logistics networks, poses a moderate threat to traditional commercial vehicles. The impact of these alternatives is expected to xx% of the market by 2033.
- M&A Activity: The commercial vehicle sector has witnessed a significant amount of M&A activity in recent years, driven by the need for technological advancements, geographic expansion, and economies of scale. The volume of M&A deals is projected to increase by xx% during the forecast period (2025-2033).
Commercial Vehicles Market Growth Trends & Insights
This section offers a detailed examination of the commercial vehicle market's growth trajectory, leveraging extensive data analysis to reveal key trends. The analysis encompasses market size evolution, adoption rates across different vehicle types and propulsion systems, and shifts in consumer preferences. We also explore the impact of technological disruptions and macroeconomic factors on market growth. The Compound Annual Growth Rate (CAGR) for the market during 2019-2024 was xx%, and it is projected to be xx% from 2025-2033. Market penetration of electric commercial vehicles is expected to reach xx% by 2033. Detailed analysis of consumer behavior shifts, driven by factors such as sustainability concerns and economic considerations, further illuminate the market landscape.
Dominant Regions, Countries, or Segments in Commercial Vehicles Market
This section identifies the leading geographical regions, countries, and product segments that are driving the growth of the commercial vehicle market. The analysis highlights key factors contributing to the dominance of these regions and segments, such as supportive government policies, robust infrastructure, and strong economic growth.
- Leading Region/Country: [Insert leading region/country based on data analysis, e.g., China or North America]. This region's dominance is attributed to factors such as [Elaborate on key drivers. For instance: robust infrastructure development, rapidly expanding e-commerce sector, increasing demand for logistics services].
- Leading Segment (Vehicle Type): [Insert leading vehicle type based on analysis, e.g., Heavy-duty trucks]. Key drivers include [Elaborate on reasons for dominance. For instance: growth in construction and infrastructure development, increasing freight transportation needs].
- Leading Segment (Propulsion Type): [Insert leading propulsion type based on data analysis, e.g., Diesel]. The dominance of diesel propulsion is largely due to [Elaborate on reasons for dominance. For instance: established infrastructure, cost-effectiveness compared to alternative fuels].
- Leading Segment (Fuel Type): [Insert leading fuel type, e.g. Diesel]. [Elaborate on reasons for dominance]. LPG vehicles may also represent a strong emerging market segment due to [mention specific factors].
Commercial Vehicles Market Product Landscape
The commercial vehicle market showcases a diverse range of products catering to various applications and end-user needs. Recent innovations focus on enhancing fuel efficiency, reducing emissions, and improving safety features. Technological advancements, such as advanced driver-assistance systems (ADAS) and telematics integration, are becoming increasingly prevalent, offering enhanced operational efficiency and cost savings. The unique selling propositions of many vehicles now center on sustainability, connectivity, and optimized performance. Advancements in electric and hybrid powertrains are transforming the landscape and influencing future product development.
Key Drivers, Barriers & Challenges in Commercial Vehicles Market
Key Drivers:
- Increasing urbanization and globalization are driving demand for efficient freight transportation.
- Growing e-commerce necessitates robust delivery networks and specialized commercial vehicles.
- Government regulations promoting cleaner transportation options fuel the adoption of electric and hybrid vehicles.
Challenges and Restraints:
- Supply chain disruptions, particularly concerning semiconductor components, impact production capabilities and lead times. These disruptions negatively affect overall market growth and availability.
- Stringent emission standards increase manufacturing costs and might hinder market penetration in some regions.
- Intense competition among established and emerging players creates pressure on profit margins.
Emerging Opportunities in Commercial Vehicles Market
The commercial vehicle market presents exciting growth opportunities. Untapped markets in developing economies, particularly in Asia and Africa, offer significant potential for expansion. The integration of autonomous driving technologies is poised to revolutionize logistics and transportation. Further innovation in alternative fuels and sustainable manufacturing processes provides opportunities for environmentally conscious businesses to gain a competitive edge. Customized vehicle solutions tailored to specific industries (e.g., construction, delivery, etc.) offer lucrative niches.
Growth Accelerators in the Commercial Vehicles Market Industry
The long-term growth trajectory of the commercial vehicle market is propelled by several key accelerators. Continuous technological innovation in areas such as alternative fuel technologies and autonomous driving systems is driving efficiency and sustainability. Strategic partnerships between manufacturers and technology providers are fostering collaboration and accelerating the pace of innovation. Government initiatives supporting the adoption of cleaner vehicles further enhance market growth. Market expansion into new regions and emerging economies presents significant opportunities for growth and diversification.
Key Players Shaping the Commercial Vehicles Market Market
- Scania AB
- Nissan Motor Co Ltd
- General Motors Company
- Dongfeng Motor Corporation
- Volkswagen AG
- Daimler AG (Mercedes-Benz AG)
- Tata Motors Limited
- BAIC Motor Corporation Ltd
- Volvo Group
- Mahindra & Mahindra Limited
- BYD Auto Co Ltd
- Saic General Motors Corporation Limited
- Groupe Renault
- Toyota Motor Corporation
- Rivian Automotive Inc
- Ford Motor Company
Notable Milestones in Commercial Vehicles Market Sector
- August 2023: General Motors announces plans to launch an all-electric Cadillac Escalade in late 2024. This signifies a major commitment to the electric vehicle market within the luxury SUV segment.
- August 2023: General Motors reinforces its commitment to an electric future in the Middle East, indicating expansion plans in a key growth market.
- August 2023: Toyota Kirloskar Motor launches the all-new MPV Vellfire strong hybrid electric vehicle (SHEV), expanding its presence in the hybrid vehicle segment and demonstrating innovation within the MPV category.
In-Depth Commercial Vehicles Market Market Outlook
The future of the commercial vehicle market is bright, driven by ongoing technological advancements, supportive government policies, and increasing demand from various sectors. The market is poised for sustained growth, with significant potential in emerging markets and the adoption of innovative technologies. Strategic partnerships and investments in research and development will further shape the market landscape. Companies that adapt to changing consumer preferences and effectively manage supply chain challenges will thrive in this dynamic and evolving market.
Commercial Vehicles Market Segmentation
-
1. Vehicle Type
-
1.1. Commercial Vehicles
- 1.1.1. Heavy-duty Commercial Trucks
- 1.1.2. Light Commercial Pick-up Trucks
- 1.1.3. Light Commercial Vans
- 1.1.4. Medium-duty Commercial Trucks
-
1.1. Commercial Vehicles
-
2. Propulsion Type
-
2.1. Hybrid and Electric Vehicles
-
2.1.1. By Fuel Category
- 2.1.1.1. BEV
- 2.1.1.2. FCEV
- 2.1.1.3. HEV
- 2.1.1.4. PHEV
-
2.1.1. By Fuel Category
-
2.2. ICE
- 2.2.1. CNG
- 2.2.2. Diesel
- 2.2.3. Gasoline
- 2.2.4. LPG
-
2.1. Hybrid and Electric Vehicles
Commercial Vehicles Market Segmentation By Geography
-
1. North America
- 1.1. United States
- 1.2. Canada
- 1.3. Mexico
-
2. South America
- 2.1. Brazil
- 2.2. Argentina
- 2.3. Rest of South America
-
3. Europe
- 3.1. United Kingdom
- 3.2. Germany
- 3.3. France
- 3.4. Italy
- 3.5. Spain
- 3.6. Russia
- 3.7. Benelux
- 3.8. Nordics
- 3.9. Rest of Europe
-
4. Middle East & Africa
- 4.1. Turkey
- 4.2. Israel
- 4.3. GCC
- 4.4. North Africa
- 4.5. South Africa
- 4.6. Rest of Middle East & Africa
-
5. Asia Pacific
- 5.1. China
- 5.2. India
- 5.3. Japan
- 5.4. South Korea
- 5.5. ASEAN
- 5.6. Oceania
- 5.7. Rest of Asia Pacific
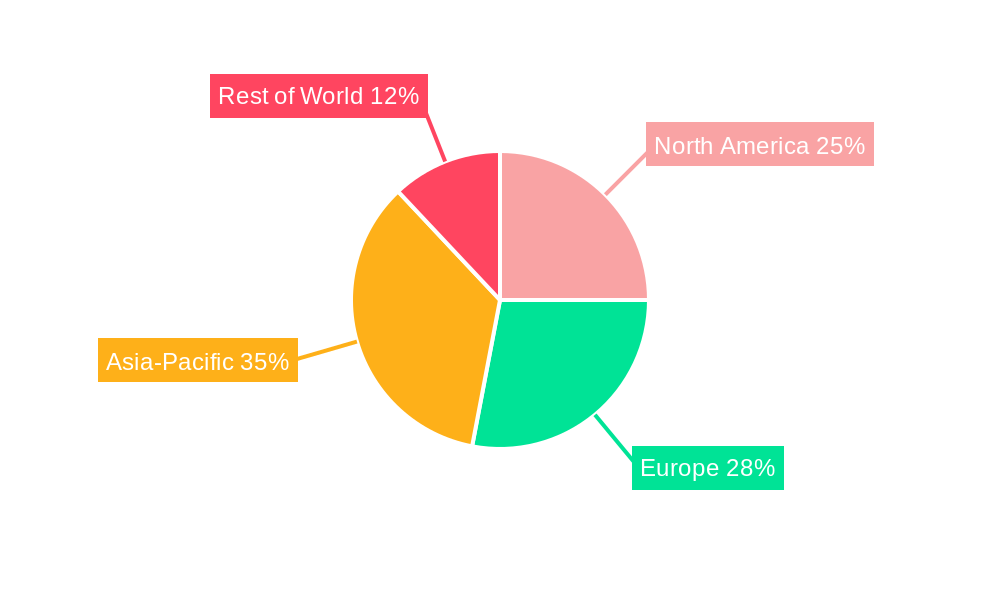
Commercial Vehicles Market Regional Market Share
Geographic Coverage of Commercial Vehicles Market
Commercial Vehicles Market REPORT HIGHLIGHTS
| Aspects | Details |
|---|---|
| Study Period | 2020-2034 |
| Base Year | 2025 |
| Estimated Year | 2026 |
| Forecast Period | 2026-2034 |
| Historical Period | 2020-2025 |
| Growth Rate | CAGR of 5.74% from 2020-2034 |
| Segmentation |
|
Table of Contents
- 1. Introduction
- 1.1. Research Scope
- 1.2. Market Segmentation
- 1.3. Research Objective
- 1.4. Definitions and Assumptions
- 2. Executive Summary
- 2.1. Market Snapshot
- 3. Market Dynamics
- 3.1. Market Drivers
- 3.2. Market Restrains
- 3.3. Market Trends
- 3.4. Market Opportunities
- 4. Market Factor Analysis
- 4.1. Porters Five Forces
- 4.1.1. Bargaining Power of Suppliers
- 4.1.2. Bargaining Power of Buyers
- 4.1.3. Threat of New Entrants
- 4.1.4. Threat of Substitutes
- 4.1.5. Competitive Rivalry
- 4.2. PESTEL analysis
- 4.3. BCG Analysis
- 4.3.1. Stars (High Growth, High Market Share)
- 4.3.2. Cash Cows (Low Growth, High Market Share)
- 4.3.3. Question Mark (High Growth, Low Market Share)
- 4.3.4. Dogs (Low Growth, Low Market Share)
- 4.4. Ansoff Matrix Analysis
- 4.5. Supply Chain Analysis
- 4.6. Regulatory Landscape
- 4.7. Current Market Potential and Opportunity Assessment (TAM–SAM–SOM Framework)
- 4.8. VDR Analyst Note
- 4.1. Porters Five Forces
- 5. Market Analysis, Insights and Forecast 2021-2033
- 5.1. Market Analysis, Insights and Forecast - by Vehicle Type
- 5.1.1. Commercial Vehicles
- 5.1.1.1. Heavy-duty Commercial Trucks
- 5.1.1.2. Light Commercial Pick-up Trucks
- 5.1.1.3. Light Commercial Vans
- 5.1.1.4. Medium-duty Commercial Trucks
- 5.1.1. Commercial Vehicles
- 5.2. Market Analysis, Insights and Forecast - by Propulsion Type
- 5.2.1. Hybrid and Electric Vehicles
- 5.2.1.1. By Fuel Category
- 5.2.1.1.1. BEV
- 5.2.1.1.2. FCEV
- 5.2.1.1.3. HEV
- 5.2.1.1.4. PHEV
- 5.2.1.1. By Fuel Category
- 5.2.2. ICE
- 5.2.2.1. CNG
- 5.2.2.2. Diesel
- 5.2.2.3. Gasoline
- 5.2.2.4. LPG
- 5.2.1. Hybrid and Electric Vehicles
- 5.3. Market Analysis, Insights and Forecast - by Region
- 5.3.1. North America
- 5.3.2. South America
- 5.3.3. Europe
- 5.3.4. Middle East & Africa
- 5.3.5. Asia Pacific
- 5.1. Market Analysis, Insights and Forecast - by Vehicle Type
- 6. Global Commercial Vehicles Market Analysis, Insights and Forecast, 2021-2033
- 6.1. Market Analysis, Insights and Forecast - by Vehicle Type
- 6.1.1. Commercial Vehicles
- 6.1.1.1. Heavy-duty Commercial Trucks
- 6.1.1.2. Light Commercial Pick-up Trucks
- 6.1.1.3. Light Commercial Vans
- 6.1.1.4. Medium-duty Commercial Trucks
- 6.1.1. Commercial Vehicles
- 6.2. Market Analysis, Insights and Forecast - by Propulsion Type
- 6.2.1. Hybrid and Electric Vehicles
- 6.2.1.1. By Fuel Category
- 6.2.1.1.1. BEV
- 6.2.1.1.2. FCEV
- 6.2.1.1.3. HEV
- 6.2.1.1.4. PHEV
- 6.2.1.1. By Fuel Category
- 6.2.2. ICE
- 6.2.2.1. CNG
- 6.2.2.2. Diesel
- 6.2.2.3. Gasoline
- 6.2.2.4. LPG
- 6.2.1. Hybrid and Electric Vehicles
- 6.1. Market Analysis, Insights and Forecast - by Vehicle Type
- 7. North America Commercial Vehicles Market Analysis, Insights and Forecast, 2021-2033
- 7.1. Market Analysis, Insights and Forecast - by Vehicle Type
- 7.1.1. Commercial Vehicles
- 7.1.1.1. Heavy-duty Commercial Trucks
- 7.1.1.2. Light Commercial Pick-up Trucks
- 7.1.1.3. Light Commercial Vans
- 7.1.1.4. Medium-duty Commercial Trucks
- 7.1.1. Commercial Vehicles
- 7.2. Market Analysis, Insights and Forecast - by Propulsion Type
- 7.2.1. Hybrid and Electric Vehicles
- 7.2.1.1. By Fuel Category
- 7.2.1.1.1. BEV
- 7.2.1.1.2. FCEV
- 7.2.1.1.3. HEV
- 7.2.1.1.4. PHEV
- 7.2.1.1. By Fuel Category
- 7.2.2. ICE
- 7.2.2.1. CNG
- 7.2.2.2. Diesel
- 7.2.2.3. Gasoline
- 7.2.2.4. LPG
- 7.2.1. Hybrid and Electric Vehicles
- 7.1. Market Analysis, Insights and Forecast - by Vehicle Type
- 8. South America Commercial Vehicles Market Analysis, Insights and Forecast, 2021-2033
- 8.1. Market Analysis, Insights and Forecast - by Vehicle Type
- 8.1.1. Commercial Vehicles
- 8.1.1.1. Heavy-duty Commercial Trucks
- 8.1.1.2. Light Commercial Pick-up Trucks
- 8.1.1.3. Light Commercial Vans
- 8.1.1.4. Medium-duty Commercial Trucks
- 8.1.1. Commercial Vehicles
- 8.2. Market Analysis, Insights and Forecast - by Propulsion Type
- 8.2.1. Hybrid and Electric Vehicles
- 8.2.1.1. By Fuel Category
- 8.2.1.1.1. BEV
- 8.2.1.1.2. FCEV
- 8.2.1.1.3. HEV
- 8.2.1.1.4. PHEV
- 8.2.1.1. By Fuel Category
- 8.2.2. ICE
- 8.2.2.1. CNG
- 8.2.2.2. Diesel
- 8.2.2.3. Gasoline
- 8.2.2.4. LPG
- 8.2.1. Hybrid and Electric Vehicles
- 8.1. Market Analysis, Insights and Forecast - by Vehicle Type
- 9. Europe Commercial Vehicles Market Analysis, Insights and Forecast, 2021-2033
- 9.1. Market Analysis, Insights and Forecast - by Vehicle Type
- 9.1.1. Commercial Vehicles
- 9.1.1.1. Heavy-duty Commercial Trucks
- 9.1.1.2. Light Commercial Pick-up Trucks
- 9.1.1.3. Light Commercial Vans
- 9.1.1.4. Medium-duty Commercial Trucks
- 9.1.1. Commercial Vehicles
- 9.2. Market Analysis, Insights and Forecast - by Propulsion Type
- 9.2.1. Hybrid and Electric Vehicles
- 9.2.1.1. By Fuel Category
- 9.2.1.1.1. BEV
- 9.2.1.1.2. FCEV
- 9.2.1.1.3. HEV
- 9.2.1.1.4. PHEV
- 9.2.1.1. By Fuel Category
- 9.2.2. ICE
- 9.2.2.1. CNG
- 9.2.2.2. Diesel
- 9.2.2.3. Gasoline
- 9.2.2.4. LPG
- 9.2.1. Hybrid and Electric Vehicles
- 9.1. Market Analysis, Insights and Forecast - by Vehicle Type
- 10. Middle East & Africa Commercial Vehicles Market Analysis, Insights and Forecast, 2021-2033
- 10.1. Market Analysis, Insights and Forecast - by Vehicle Type
- 10.1.1. Commercial Vehicles
- 10.1.1.1. Heavy-duty Commercial Trucks
- 10.1.1.2. Light Commercial Pick-up Trucks
- 10.1.1.3. Light Commercial Vans
- 10.1.1.4. Medium-duty Commercial Trucks
- 10.1.1. Commercial Vehicles
- 10.2. Market Analysis, Insights and Forecast - by Propulsion Type
- 10.2.1. Hybrid and Electric Vehicles
- 10.2.1.1. By Fuel Category
- 10.2.1.1.1. BEV
- 10.2.1.1.2. FCEV
- 10.2.1.1.3. HEV
- 10.2.1.1.4. PHEV
- 10.2.1.1. By Fuel Category
- 10.2.2. ICE
- 10.2.2.1. CNG
- 10.2.2.2. Diesel
- 10.2.2.3. Gasoline
- 10.2.2.4. LPG
- 10.2.1. Hybrid and Electric Vehicles
- 10.1. Market Analysis, Insights and Forecast - by Vehicle Type
- 11. Asia Pacific Commercial Vehicles Market Analysis, Insights and Forecast, 2021-2033
- 11.1. Market Analysis, Insights and Forecast - by Vehicle Type
- 11.1.1. Commercial Vehicles
- 11.1.1.1. Heavy-duty Commercial Trucks
- 11.1.1.2. Light Commercial Pick-up Trucks
- 11.1.1.3. Light Commercial Vans
- 11.1.1.4. Medium-duty Commercial Trucks
- 11.1.1. Commercial Vehicles
- 11.2. Market Analysis, Insights and Forecast - by Propulsion Type
- 11.2.1. Hybrid and Electric Vehicles
- 11.2.1.1. By Fuel Category
- 11.2.1.1.1. BEV
- 11.2.1.1.2. FCEV
- 11.2.1.1.3. HEV
- 11.2.1.1.4. PHEV
- 11.2.1.1. By Fuel Category
- 11.2.2. ICE
- 11.2.2.1. CNG
- 11.2.2.2. Diesel
- 11.2.2.3. Gasoline
- 11.2.2.4. LPG
- 11.2.1. Hybrid and Electric Vehicles
- 11.1. Market Analysis, Insights and Forecast - by Vehicle Type
- 12. Competitive Analysis
- 12.1. Company Profiles
- 12.1.1 Scania AB
- 12.1.1.1. Company Overview
- 12.1.1.2. Products
- 12.1.1.3. Company Financials
- 12.1.1.4. SWOT Analysis
- 12.1.2 Nissan Motor Co Ltd
- 12.1.2.1. Company Overview
- 12.1.2.2. Products
- 12.1.2.3. Company Financials
- 12.1.2.4. SWOT Analysis
- 12.1.3 General Motors Company
- 12.1.3.1. Company Overview
- 12.1.3.2. Products
- 12.1.3.3. Company Financials
- 12.1.3.4. SWOT Analysis
- 12.1.4 Dongfeng Motor Corporation
- 12.1.4.1. Company Overview
- 12.1.4.2. Products
- 12.1.4.3. Company Financials
- 12.1.4.4. SWOT Analysis
- 12.1.5 Volkswagen AG
- 12.1.5.1. Company Overview
- 12.1.5.2. Products
- 12.1.5.3. Company Financials
- 12.1.5.4. SWOT Analysis
- 12.1.6 Daimler AG (Mercedes-Benz AG)
- 12.1.6.1. Company Overview
- 12.1.6.2. Products
- 12.1.6.3. Company Financials
- 12.1.6.4. SWOT Analysis
- 12.1.7 Tata Motors Limited
- 12.1.7.1. Company Overview
- 12.1.7.2. Products
- 12.1.7.3. Company Financials
- 12.1.7.4. SWOT Analysis
- 12.1.8 BAIC Motor Corporation Ltd
- 12.1.8.1. Company Overview
- 12.1.8.2. Products
- 12.1.8.3. Company Financials
- 12.1.8.4. SWOT Analysis
- 12.1.9 Volvo Grou
- 12.1.9.1. Company Overview
- 12.1.9.2. Products
- 12.1.9.3. Company Financials
- 12.1.9.4. SWOT Analysis
- 12.1.10 Mahindra & Mahindra Limited
- 12.1.10.1. Company Overview
- 12.1.10.2. Products
- 12.1.10.3. Company Financials
- 12.1.10.4. SWOT Analysis
- 12.1.11 BYD Auto Co Ltd
- 12.1.11.1. Company Overview
- 12.1.11.2. Products
- 12.1.11.3. Company Financials
- 12.1.11.4. SWOT Analysis
- 12.1.12 Saic General Motors Corporation Limited
- 12.1.12.1. Company Overview
- 12.1.12.2. Products
- 12.1.12.3. Company Financials
- 12.1.12.4. SWOT Analysis
- 12.1.13 Groupe Renault
- 12.1.13.1. Company Overview
- 12.1.13.2. Products
- 12.1.13.3. Company Financials
- 12.1.13.4. SWOT Analysis
- 12.1.14 Toyota Motor Corporation
- 12.1.14.1. Company Overview
- 12.1.14.2. Products
- 12.1.14.3. Company Financials
- 12.1.14.4. SWOT Analysis
- 12.1.15 Rivian Automotive Inc
- 12.1.15.1. Company Overview
- 12.1.15.2. Products
- 12.1.15.3. Company Financials
- 12.1.15.4. SWOT Analysis
- 12.1.16 Ford Motor Company
- 12.1.16.1. Company Overview
- 12.1.16.2. Products
- 12.1.16.3. Company Financials
- 12.1.16.4. SWOT Analysis
- 12.1.1 Scania AB
- 12.2. Market Entropy
- 12.2.1 Company's Key Areas Served
- 12.2.2 Recent Developments
- 12.3. Company Market Share Analysis 2025
- 12.3.1 Top 5 Companies Market Share Analysis
- 12.3.2 Top 3 Companies Market Share Analysis
- 12.4. List of Potential Customers
- 13. Research Methodology
List of Figures
- Figure 1: Global Commercial Vehicles Market Revenue Breakdown (billion, %) by Region 2025 & 2033
- Figure 2: North America Commercial Vehicles Market Revenue (billion), by Vehicle Type 2025 & 2033
- Figure 3: North America Commercial Vehicles Market Revenue Share (%), by Vehicle Type 2025 & 2033
- Figure 4: North America Commercial Vehicles Market Revenue (billion), by Propulsion Type 2025 & 2033
- Figure 5: North America Commercial Vehicles Market Revenue Share (%), by Propulsion Type 2025 & 2033
- Figure 6: North America Commercial Vehicles Market Revenue (billion), by Country 2025 & 2033
- Figure 7: North America Commercial Vehicles Market Revenue Share (%), by Country 2025 & 2033
- Figure 8: South America Commercial Vehicles Market Revenue (billion), by Vehicle Type 2025 & 2033
- Figure 9: South America Commercial Vehicles Market Revenue Share (%), by Vehicle Type 2025 & 2033
- Figure 10: South America Commercial Vehicles Market Revenue (billion), by Propulsion Type 2025 & 2033
- Figure 11: South America Commercial Vehicles Market Revenue Share (%), by Propulsion Type 2025 & 2033
- Figure 12: South America Commercial Vehicles Market Revenue (billion), by Country 2025 & 2033
- Figure 13: South America Commercial Vehicles Market Revenue Share (%), by Country 2025 & 2033
- Figure 14: Europe Commercial Vehicles Market Revenue (billion), by Vehicle Type 2025 & 2033
- Figure 15: Europe Commercial Vehicles Market Revenue Share (%), by Vehicle Type 2025 & 2033
- Figure 16: Europe Commercial Vehicles Market Revenue (billion), by Propulsion Type 2025 & 2033
- Figure 17: Europe Commercial Vehicles Market Revenue Share (%), by Propulsion Type 2025 & 2033
- Figure 18: Europe Commercial Vehicles Market Revenue (billion), by Country 2025 & 2033
- Figure 19: Europe Commercial Vehicles Market Revenue Share (%), by Country 2025 & 2033
- Figure 20: Middle East & Africa Commercial Vehicles Market Revenue (billion), by Vehicle Type 2025 & 2033
- Figure 21: Middle East & Africa Commercial Vehicles Market Revenue Share (%), by Vehicle Type 2025 & 2033
- Figure 22: Middle East & Africa Commercial Vehicles Market Revenue (billion), by Propulsion Type 2025 & 2033
- Figure 23: Middle East & Africa Commercial Vehicles Market Revenue Share (%), by Propulsion Type 2025 & 2033
- Figure 24: Middle East & Africa Commercial Vehicles Market Revenue (billion), by Country 2025 & 2033
- Figure 25: Middle East & Africa Commercial Vehicles Market Revenue Share (%), by Country 2025 & 2033
- Figure 26: Asia Pacific Commercial Vehicles Market Revenue (billion), by Vehicle Type 2025 & 2033
- Figure 27: Asia Pacific Commercial Vehicles Market Revenue Share (%), by Vehicle Type 2025 & 2033
- Figure 28: Asia Pacific Commercial Vehicles Market Revenue (billion), by Propulsion Type 2025 & 2033
- Figure 29: Asia Pacific Commercial Vehicles Market Revenue Share (%), by Propulsion Type 2025 & 2033
- Figure 30: Asia Pacific Commercial Vehicles Market Revenue (billion), by Country 2025 & 2033
- Figure 31: Asia Pacific Commercial Vehicles Market Revenue Share (%), by Country 2025 & 2033
List of Tables
- Table 1: Global Commercial Vehicles Market Revenue billion Forecast, by Vehicle Type 2020 & 2033
- Table 2: Global Commercial Vehicles Market Revenue billion Forecast, by Propulsion Type 2020 & 2033
- Table 3: Global Commercial Vehicles Market Revenue billion Forecast, by Region 2020 & 2033
- Table 4: Global Commercial Vehicles Market Revenue billion Forecast, by Vehicle Type 2020 & 2033
- Table 5: Global Commercial Vehicles Market Revenue billion Forecast, by Propulsion Type 2020 & 2033
- Table 6: Global Commercial Vehicles Market Revenue billion Forecast, by Country 2020 & 2033
- Table 7: United States Commercial Vehicles Market Revenue (billion) Forecast, by Application 2020 & 2033
- Table 8: Canada Commercial Vehicles Market Revenue (billion) Forecast, by Application 2020 & 2033
- Table 9: Mexico Commercial Vehicles Market Revenue (billion) Forecast, by Application 2020 & 2033
- Table 10: Global Commercial Vehicles Market Revenue billion Forecast, by Vehicle Type 2020 & 2033
- Table 11: Global Commercial Vehicles Market Revenue billion Forecast, by Propulsion Type 2020 & 2033
- Table 12: Global Commercial Vehicles Market Revenue billion Forecast, by Country 2020 & 2033
- Table 13: Brazil Commercial Vehicles Market Revenue (billion) Forecast, by Application 2020 & 2033
- Table 14: Argentina Commercial Vehicles Market Revenue (billion) Forecast, by Application 2020 & 2033
- Table 15: Rest of South America Commercial Vehicles Market Revenue (billion) Forecast, by Application 2020 & 2033
- Table 16: Global Commercial Vehicles Market Revenue billion Forecast, by Vehicle Type 2020 & 2033
- Table 17: Global Commercial Vehicles Market Revenue billion Forecast, by Propulsion Type 2020 & 2033
- Table 18: Global Commercial Vehicles Market Revenue billion Forecast, by Country 2020 & 2033
- Table 19: United Kingdom Commercial Vehicles Market Revenue (billion) Forecast, by Application 2020 & 2033
- Table 20: Germany Commercial Vehicles Market Revenue (billion) Forecast, by Application 2020 & 2033
- Table 21: France Commercial Vehicles Market Revenue (billion) Forecast, by Application 2020 & 2033
- Table 22: Italy Commercial Vehicles Market Revenue (billion) Forecast, by Application 2020 & 2033
- Table 23: Spain Commercial Vehicles Market Revenue (billion) Forecast, by Application 2020 & 2033
- Table 24: Russia Commercial Vehicles Market Revenue (billion) Forecast, by Application 2020 & 2033
- Table 25: Benelux Commercial Vehicles Market Revenue (billion) Forecast, by Application 2020 & 2033
- Table 26: Nordics Commercial Vehicles Market Revenue (billion) Forecast, by Application 2020 & 2033
- Table 27: Rest of Europe Commercial Vehicles Market Revenue (billion) Forecast, by Application 2020 & 2033
- Table 28: Global Commercial Vehicles Market Revenue billion Forecast, by Vehicle Type 2020 & 2033
- Table 29: Global Commercial Vehicles Market Revenue billion Forecast, by Propulsion Type 2020 & 2033
- Table 30: Global Commercial Vehicles Market Revenue billion Forecast, by Country 2020 & 2033
- Table 31: Turkey Commercial Vehicles Market Revenue (billion) Forecast, by Application 2020 & 2033
- Table 32: Israel Commercial Vehicles Market Revenue (billion) Forecast, by Application 2020 & 2033
- Table 33: GCC Commercial Vehicles Market Revenue (billion) Forecast, by Application 2020 & 2033
- Table 34: North Africa Commercial Vehicles Market Revenue (billion) Forecast, by Application 2020 & 2033
- Table 35: South Africa Commercial Vehicles Market Revenue (billion) Forecast, by Application 2020 & 2033
- Table 36: Rest of Middle East & Africa Commercial Vehicles Market Revenue (billion) Forecast, by Application 2020 & 2033
- Table 37: Global Commercial Vehicles Market Revenue billion Forecast, by Vehicle Type 2020 & 2033
- Table 38: Global Commercial Vehicles Market Revenue billion Forecast, by Propulsion Type 2020 & 2033
- Table 39: Global Commercial Vehicles Market Revenue billion Forecast, by Country 2020 & 2033
- Table 40: China Commercial Vehicles Market Revenue (billion) Forecast, by Application 2020 & 2033
- Table 41: India Commercial Vehicles Market Revenue (billion) Forecast, by Application 2020 & 2033
- Table 42: Japan Commercial Vehicles Market Revenue (billion) Forecast, by Application 2020 & 2033
- Table 43: South Korea Commercial Vehicles Market Revenue (billion) Forecast, by Application 2020 & 2033
- Table 44: ASEAN Commercial Vehicles Market Revenue (billion) Forecast, by Application 2020 & 2033
- Table 45: Oceania Commercial Vehicles Market Revenue (billion) Forecast, by Application 2020 & 2033
- Table 46: Rest of Asia Pacific Commercial Vehicles Market Revenue (billion) Forecast, by Application 2020 & 2033
Frequently Asked Questions
1. What is the projected Compound Annual Growth Rate (CAGR) of the Commercial Vehicles Market?
The projected CAGR is approximately 5.74%.
2. Which companies are prominent players in the Commercial Vehicles Market?
Key companies in the market include Scania AB, Nissan Motor Co Ltd, General Motors Company, Dongfeng Motor Corporation, Volkswagen AG, Daimler AG (Mercedes-Benz AG), Tata Motors Limited, BAIC Motor Corporation Ltd, Volvo Grou, Mahindra & Mahindra Limited, BYD Auto Co Ltd, Saic General Motors Corporation Limited, Groupe Renault, Toyota Motor Corporation, Rivian Automotive Inc, Ford Motor Company.
3. What are the main segments of the Commercial Vehicles Market?
The market segments include Vehicle Type, Propulsion Type.
4. Can you provide details about the market size?
The market size is estimated to be USD 839.97 billion as of 2022.
5. What are some drivers contributing to market growth?
Growing Travel and Tourism Industry is Driving the Car Rental Market.
6. What are the notable trends driving market growth?
OTHER KEY INDUSTRY TRENDS COVERED IN THE REPORT.
7. Are there any restraints impacting market growth?
Increasing Popularity of Ride-Sharing Services Pose Challenges for the Conventional Car Rental Market.
8. Can you provide examples of recent developments in the market?
August 2023: General Motors will launch an all-electric Cadillac Escalade in late 2024August 2023: General Motors doubles down on plans for an electric future in the Middle East.August 2023: Toyota Kirloskar Motor launched the all-new MPV Vellfire strong hybrid electric vehicle (SHEV) for a starting price of INR 11.99 million and going to INR 12.99 million.
9. What pricing options are available for accessing the report?
Pricing options include single-user, multi-user, and enterprise licenses priced at USD 3800, USD 4500, and USD 5800 respectively.
10. Is the market size provided in terms of value or volume?
The market size is provided in terms of value, measured in billion.
11. Are there any specific market keywords associated with the report?
Yes, the market keyword associated with the report is "Commercial Vehicles Market," which aids in identifying and referencing the specific market segment covered.
12. How do I determine which pricing option suits my needs best?
The pricing options vary based on user requirements and access needs. Individual users may opt for single-user licenses, while businesses requiring broader access may choose multi-user or enterprise licenses for cost-effective access to the report.
13. Are there any additional resources or data provided in the Commercial Vehicles Market report?
While the report offers comprehensive insights, it's advisable to review the specific contents or supplementary materials provided to ascertain if additional resources or data are available.
14. How can I stay updated on further developments or reports in the Commercial Vehicles Market?
To stay informed about further developments, trends, and reports in the Commercial Vehicles Market, consider subscribing to industry newsletters, following relevant companies and organizations, or regularly checking reputable industry news sources and publications.
Methodology
Step 1 - Identification of Relevant Samples Size from Population Database


Step 2 - Approaches for Defining Global Market Size (Value, Volume* & Price*)

Note*: In applicable scenarios
Step 3 - Data Sources
Primary Research
- Web Analytics
- Survey Reports
- Research Institute
- Latest Research Reports
- Opinion Leaders
Secondary Research
- Annual Reports
- White Paper
- Latest Press Release
- Industry Association
- Paid Database
- Investor Presentations

Step 4 - Data Triangulation
Involves using different sources of information in order to increase the validity of a study
These sources are likely to be stakeholders in a program - participants, other researchers, program staff, other community members, and so on.
Then we put all data in single framework & apply various statistical tools to find out the dynamic on the market.
During the analysis stage, feedback from the stakeholder groups would be compared to determine areas of agreement as well as areas of divergence