

Key Insights
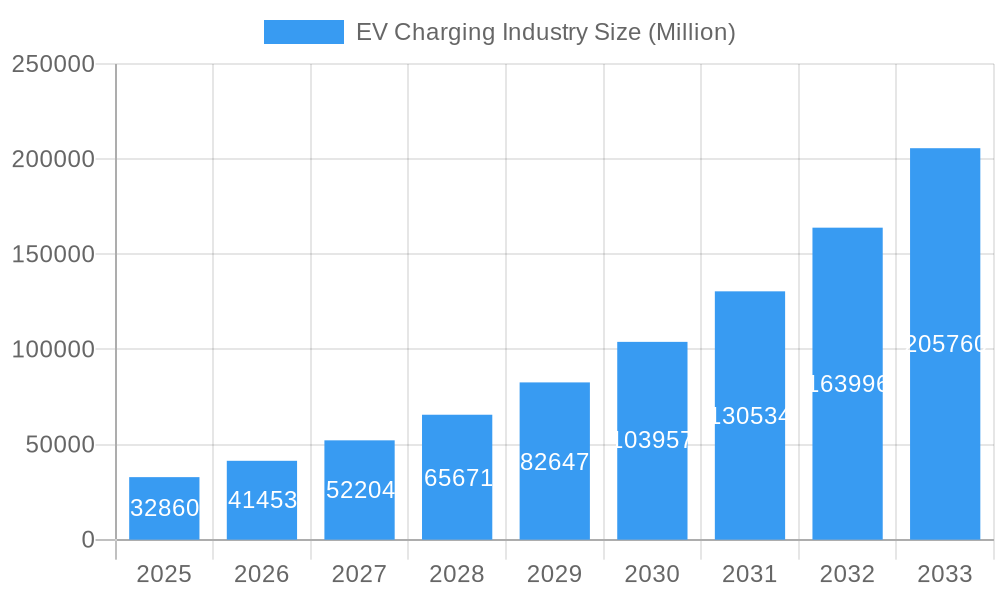
The global EV charging infrastructure market is experiencing explosive growth, projected to reach a substantial size driven by the rapid adoption of electric vehicles (EVs). The market's Compound Annual Growth Rate (CAGR) of 25.94% from 2019-2033 signifies a robust expansion, fueled by several key factors. Government incentives aimed at promoting EV adoption, coupled with rising environmental concerns and decreasing battery costs, are significantly boosting demand for charging stations. Furthermore, technological advancements in charging technologies, such as faster charging speeds and improved battery efficiency, are accelerating market penetration. The market is segmented by charger type (AC and DC), ownership (public and private), service type (charging services and battery swapping), infrastructure type (CHAdeMO, CCS, GB/T, Tesla Superchargers, and others), and vehicle type (passenger cars and commercial vehicles). The geographical spread reveals strong growth across North America, Europe, and the Asia-Pacific region, with China, the United States, and several European countries leading the charge. Competition within the market is fierce, with established players like ABB, ChargePoint, and Tesla vying for market share alongside emerging companies offering innovative charging solutions. The continued expansion of EV charging networks, especially in densely populated urban areas, is crucial for widespread EV adoption and will continue to drive market growth throughout the forecast period.
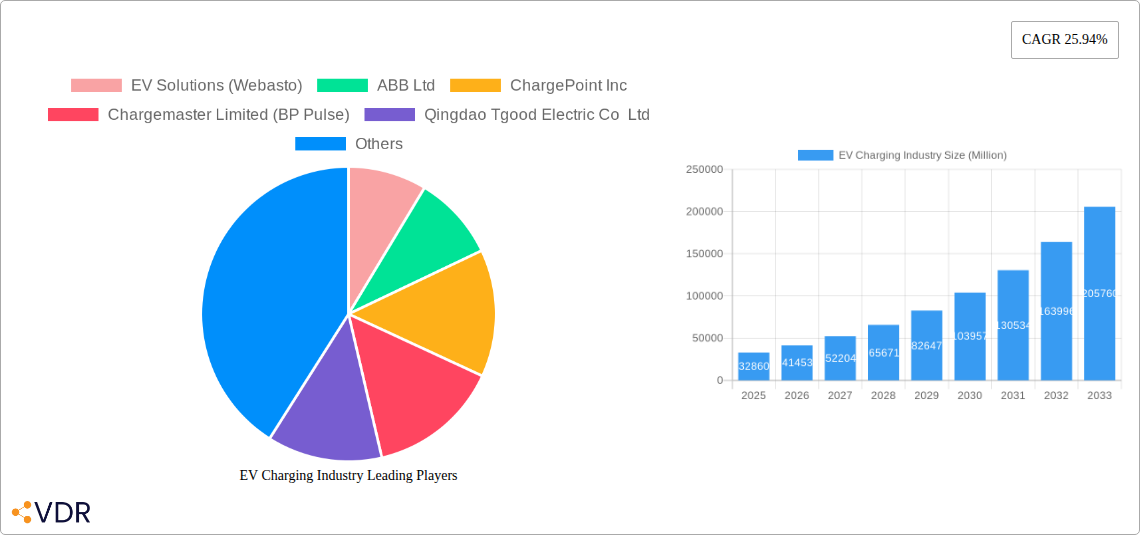
EV Charging Industry Market Size (In Billion)
The diverse range of charging solutions available caters to various EV models and user preferences, contributing to market dynamism. However, challenges remain, including the high initial investment costs for installing charging infrastructure, the need for robust grid infrastructure upgrades to accommodate increased electricity demand, and the ongoing standardization efforts across different charging technologies. Despite these hurdles, the long-term outlook remains exceptionally positive, with the market poised for continued expansion as EV adoption accelerates globally. The increasing focus on interoperability and the development of smart charging technologies will further enhance the market's growth trajectory in the coming years, facilitating seamless charging experiences for EV users. The ongoing expansion into developing economies will also unlock significant growth opportunities, making the EV charging infrastructure market a highly lucrative sector for investors and businesses alike.
EV Charging Industry Company Market Share
EV Charging Industry Market Report: 2019-2033
This comprehensive report provides an in-depth analysis of the global EV charging industry, encompassing market dynamics, growth trends, regional insights, and key player strategies. With a study period spanning 2019-2033, a base year of 2025, and a forecast period of 2025-2033, this report is an invaluable resource for industry professionals, investors, and stakeholders seeking to understand and capitalize on the burgeoning opportunities within this rapidly evolving sector. The report covers a diverse range of segments including AC and DC charging stations, public and private charging ownership, various charging service and infrastructure types, and passenger and commercial vehicle applications.
EV Charging Industry Market Dynamics & Structure
The global EV charging market is characterized by increasing market concentration as major players consolidate their positions through mergers and acquisitions (M&A). The value of M&A deals in the sector totaled xx Million in 2024, with a projected increase to xx Million by 2033. Technological innovation, particularly in fast-charging technology and smart charging solutions, is a key growth driver. Stringent government regulations aimed at promoting EV adoption and expanding charging infrastructure are also significantly influencing market dynamics. While technological advancements continue, barriers such as high upfront investment costs for infrastructure development and interoperability challenges persist.
- Market Concentration: High, with top 10 players holding xx% market share in 2024, projected to increase to xx% by 2033.
- Technological Innovation: Focus on high-power fast charging, smart charging management, and grid integration.
- Regulatory Framework: Government incentives and mandates driving infrastructure development.
- Competitive Substitutes: Limited direct substitutes; competition focuses on charging speed, reliability, and cost.
- End-User Demographics: Early adopters shifting towards mainstream EV users.
- M&A Trends: Consolidation among charging network operators and technology providers.
EV Charging Industry Growth Trends & Insights
The global EV charging market is experiencing robust growth, driven by the increasing adoption of electric vehicles and supportive government policies. The market size reached xx Million in 2024 and is projected to reach xx Million by 2033, exhibiting a Compound Annual Growth Rate (CAGR) of xx%. This growth is fueled by several factors including technological advancements in battery technology, decreasing EV prices, expanding charging infrastructure, and increasing consumer awareness of environmental concerns. The market penetration rate for EV charging stations is projected to increase from xx% in 2024 to xx% by 2033. Consumer behavior is shifting towards convenient and reliable charging options, with a growing preference for fast-charging stations and integrated charging solutions.
Dominant Regions, Countries, or Segments in EV Charging Industry
The North American and European regions currently dominate the EV charging market, driven by robust EV adoption rates, well-developed charging infrastructure, and supportive government policies. Within these regions, countries such as the United States, China, and Germany are at the forefront of market growth.
- By Charger Type: DC fast charging stations are witnessing faster growth compared to AC charging stations due to their ability to charge EVs more quickly. The market for DC charging stations is expected to reach xx Million by 2033.
- By Charging Ownership Type: Public charging stations are experiencing higher growth compared to private charging solutions, reflecting the increasing need for convenient public charging infrastructure. The public charging segment is forecast to represent xx% of the market by 2033.
- By Charging Service Type: EV charging services currently dominate the market, but battery swapping services are emerging as a promising segment.
- By Charging Infrastructure Type: CCS is emerging as a leading standard, while Tesla Superchargers hold a strong market share within Tesla's ecosystem.
- By Vehicle Type: The passenger car segment is the primary driver of market growth, but the commercial vehicle segment is gaining traction as more businesses adopt electric fleets.
EV Charging Industry Product Landscape
The EV charging market offers a range of products, from basic AC charging stations to high-powered DC fast chargers with advanced features such as smart charging management, load balancing, and grid integration capabilities. Manufacturers are focusing on improving charging speed, reliability, and user experience through innovative designs and technological advancements. Key selling propositions include charging speed, compatibility, user-friendly interfaces, and robust network connectivity. The integration of renewable energy sources for charging is gaining traction, reducing carbon footprints.
Key Drivers, Barriers & Challenges in EV Charging Industry
Key Drivers:
- Increasing EV adoption rates
- Government incentives and policies
- Technological advancements in charging technology
- Growing consumer awareness of environmental concerns
Challenges:
- High upfront costs of infrastructure deployment
- Interoperability issues between different charging standards
- Limited availability of charging stations in certain areas
- Concerns about grid capacity and stability. The impact of these challenges is estimated to cause a xx% reduction in overall market growth by 2030.
Emerging Opportunities in EV Charging Industry
- Expansion into developing markets with growing EV adoption.
- Development of innovative charging solutions like wireless charging and battery swapping.
- Integration of charging infrastructure with smart city initiatives.
- Growth in the commercial vehicle charging segment.
Growth Accelerators in the EV Charging Industry Industry
Technological advancements in battery technology, fast charging, and smart charging management are key catalysts for long-term market growth. Strategic partnerships between charging companies, auto manufacturers, and energy providers are also contributing to market expansion. Government support through incentives and regulatory frameworks plays a crucial role. The expanding EV fleet is directly proportional to the charging infrastructure requirement; thus, the industry is set for sustained growth.
Key Players Shaping the EV Charging Industry Market
- EV Solutions (Webasto)
- ABB Ltd
- ChargePoint Inc
- Chargemaster Limited (BP Pulse)
- Qingdao Tgood Electric Co Ltd
- Leviton Manufacturing Co Inc
- BYD Company
- Siemens AG
- Schneider Electric SE
- EFACEC Power Solutions SGPS
- Evbox (ENGIE)
- Wanbang Digital Energy Pte Ltd (Star Charge)
- Tesla Motors Inc
- SemaConnect Inc
- The Newmotion BV (Acquired by Shell)
Notable Milestones in EV Charging Industry Sector
- June 2023: Stellantis launched Free2move Charge, a comprehensive charging ecosystem.
- June 2023: Circontrol introduced the Genion One, enabling 100% green energy EV charging.
- June 2023: EVBox unveiled the EVBox Troniq High Power, a 400 kW charging station.
- March 2023: 7-Eleven launched 7Charge, its proprietary EV charging network.
In-Depth EV Charging Industry Market Outlook
The EV charging industry is poised for significant growth in the coming years, driven by the continued expansion of the EV market and supportive government policies. Strategic partnerships and technological advancements will play a crucial role in shaping the future of the industry, with a focus on interoperability, scalability, and integration with smart grids and renewable energy sources. The development of innovative charging solutions and the expansion into new markets will create significant opportunities for growth and investment. The long-term market potential is substantial, with projections indicating a significant increase in both the number of charging stations and the overall market value.
EV Charging Industry Segmentation
-
1. Vehicle Type
- 1.1. Passenger Cars
- 1.2. Commercial Vehicles
-
2. Charger Type
- 2.1. AC Charging Station
- 2.2. DC Charging Station
-
3. Charging Ownership Type
- 3.1. Public
- 3.2. Private
-
4. Charging Service Type
- 4.1. EV Charging Services
- 4.2. Battery Swapping Services
-
5. Charging Infrastructure Type
- 5.1. Chademo
- 5.2. CCS
- 5.3. GB/T Fast Charge
- 5.4. Tesla Superchargers
- 5.5. Other Charging Infrastructure Types
EV Charging Industry Segmentation By Geography
-
1. North America
- 1.1. United States
- 1.2. Canada
- 1.3. Rest of North America
-
2. Europe
- 2.1. Germany
- 2.2. United Kingdom
- 2.3. France
- 2.4. Italy
- 2.5. Rest of Europe
-
3. Asia Pacific
- 3.1. China
- 3.2. Japan
- 3.3. India
- 3.4. South Korea
- 3.5. Rest of Asia Pacific
-
4. Rest of the World
- 4.1. South America
- 4.2. Middle East and Africa

EV Charging Industry Regional Market Share
Geographic Coverage of EV Charging Industry
EV Charging Industry REPORT HIGHLIGHTS
| Aspects | Details |
|---|---|
| Study Period | 2020-2034 |
| Base Year | 2025 |
| Estimated Year | 2026 |
| Forecast Period | 2026-2034 |
| Historical Period | 2020-2025 |
| Growth Rate | CAGR of 25.94% from 2020-2034 |
| Segmentation |
|
Table of Contents
- 1. Introduction
- 1.1. Research Scope
- 1.2. Market Segmentation
- 1.3. Research Objective
- 1.4. Definitions and Assumptions
- 2. Executive Summary
- 2.1. Market Snapshot
- 3. Market Dynamics
- 3.1. Market Drivers
- 3.2. Market Restrains
- 3.3. Market Trends
- 3.4. Market Opportunities
- 4. Market Factor Analysis
- 4.1. Porters Five Forces
- 4.1.1. Bargaining Power of Suppliers
- 4.1.2. Bargaining Power of Buyers
- 4.1.3. Threat of New Entrants
- 4.1.4. Threat of Substitutes
- 4.1.5. Competitive Rivalry
- 4.2. PESTEL analysis
- 4.3. BCG Analysis
- 4.3.1. Stars (High Growth, High Market Share)
- 4.3.2. Cash Cows (Low Growth, High Market Share)
- 4.3.3. Question Mark (High Growth, Low Market Share)
- 4.3.4. Dogs (Low Growth, Low Market Share)
- 4.4. Ansoff Matrix Analysis
- 4.5. Supply Chain Analysis
- 4.6. Regulatory Landscape
- 4.7. Current Market Potential and Opportunity Assessment (TAM–SAM–SOM Framework)
- 4.8. VDR Analyst Note
- 4.1. Porters Five Forces
- 5. Market Analysis, Insights and Forecast 2021-2033
- 5.1. Market Analysis, Insights and Forecast - by Vehicle Type
- 5.1.1. Passenger Cars
- 5.1.2. Commercial Vehicles
- 5.2. Market Analysis, Insights and Forecast - by Charger Type
- 5.2.1. AC Charging Station
- 5.2.2. DC Charging Station
- 5.3. Market Analysis, Insights and Forecast - by Charging Ownership Type
- 5.3.1. Public
- 5.3.2. Private
- 5.4. Market Analysis, Insights and Forecast - by Charging Service Type
- 5.4.1. EV Charging Services
- 5.4.2. Battery Swapping Services
- 5.5. Market Analysis, Insights and Forecast - by Charging Infrastructure Type
- 5.5.1. Chademo
- 5.5.2. CCS
- 5.5.3. GB/T Fast Charge
- 5.5.4. Tesla Superchargers
- 5.5.5. Other Charging Infrastructure Types
- 5.6. Market Analysis, Insights and Forecast - by Region
- 5.6.1. North America
- 5.6.2. Europe
- 5.6.3. Asia Pacific
- 5.6.4. Rest of the World
- 5.1. Market Analysis, Insights and Forecast - by Vehicle Type
- 6. Global EV Charging Industry Analysis, Insights and Forecast, 2021-2033
- 6.1. Market Analysis, Insights and Forecast - by Vehicle Type
- 6.1.1. Passenger Cars
- 6.1.2. Commercial Vehicles
- 6.2. Market Analysis, Insights and Forecast - by Charger Type
- 6.2.1. AC Charging Station
- 6.2.2. DC Charging Station
- 6.3. Market Analysis, Insights and Forecast - by Charging Ownership Type
- 6.3.1. Public
- 6.3.2. Private
- 6.4. Market Analysis, Insights and Forecast - by Charging Service Type
- 6.4.1. EV Charging Services
- 6.4.2. Battery Swapping Services
- 6.5. Market Analysis, Insights and Forecast - by Charging Infrastructure Type
- 6.5.1. Chademo
- 6.5.2. CCS
- 6.5.3. GB/T Fast Charge
- 6.5.4. Tesla Superchargers
- 6.5.5. Other Charging Infrastructure Types
- 6.1. Market Analysis, Insights and Forecast - by Vehicle Type
- 7. North America EV Charging Industry Analysis, Insights and Forecast, 2021-2033
- 7.1. Market Analysis, Insights and Forecast - by Vehicle Type
- 7.1.1. Passenger Cars
- 7.1.2. Commercial Vehicles
- 7.2. Market Analysis, Insights and Forecast - by Charger Type
- 7.2.1. AC Charging Station
- 7.2.2. DC Charging Station
- 7.3. Market Analysis, Insights and Forecast - by Charging Ownership Type
- 7.3.1. Public
- 7.3.2. Private
- 7.4. Market Analysis, Insights and Forecast - by Charging Service Type
- 7.4.1. EV Charging Services
- 7.4.2. Battery Swapping Services
- 7.5. Market Analysis, Insights and Forecast - by Charging Infrastructure Type
- 7.5.1. Chademo
- 7.5.2. CCS
- 7.5.3. GB/T Fast Charge
- 7.5.4. Tesla Superchargers
- 7.5.5. Other Charging Infrastructure Types
- 7.1. Market Analysis, Insights and Forecast - by Vehicle Type
- 8. Europe EV Charging Industry Analysis, Insights and Forecast, 2021-2033
- 8.1. Market Analysis, Insights and Forecast - by Vehicle Type
- 8.1.1. Passenger Cars
- 8.1.2. Commercial Vehicles
- 8.2. Market Analysis, Insights and Forecast - by Charger Type
- 8.2.1. AC Charging Station
- 8.2.2. DC Charging Station
- 8.3. Market Analysis, Insights and Forecast - by Charging Ownership Type
- 8.3.1. Public
- 8.3.2. Private
- 8.4. Market Analysis, Insights and Forecast - by Charging Service Type
- 8.4.1. EV Charging Services
- 8.4.2. Battery Swapping Services
- 8.5. Market Analysis, Insights and Forecast - by Charging Infrastructure Type
- 8.5.1. Chademo
- 8.5.2. CCS
- 8.5.3. GB/T Fast Charge
- 8.5.4. Tesla Superchargers
- 8.5.5. Other Charging Infrastructure Types
- 8.1. Market Analysis, Insights and Forecast - by Vehicle Type
- 9. Asia Pacific EV Charging Industry Analysis, Insights and Forecast, 2021-2033
- 9.1. Market Analysis, Insights and Forecast - by Vehicle Type
- 9.1.1. Passenger Cars
- 9.1.2. Commercial Vehicles
- 9.2. Market Analysis, Insights and Forecast - by Charger Type
- 9.2.1. AC Charging Station
- 9.2.2. DC Charging Station
- 9.3. Market Analysis, Insights and Forecast - by Charging Ownership Type
- 9.3.1. Public
- 9.3.2. Private
- 9.4. Market Analysis, Insights and Forecast - by Charging Service Type
- 9.4.1. EV Charging Services
- 9.4.2. Battery Swapping Services
- 9.5. Market Analysis, Insights and Forecast - by Charging Infrastructure Type
- 9.5.1. Chademo
- 9.5.2. CCS
- 9.5.3. GB/T Fast Charge
- 9.5.4. Tesla Superchargers
- 9.5.5. Other Charging Infrastructure Types
- 9.1. Market Analysis, Insights and Forecast - by Vehicle Type
- 10. Rest of the World EV Charging Industry Analysis, Insights and Forecast, 2021-2033
- 10.1. Market Analysis, Insights and Forecast - by Vehicle Type
- 10.1.1. Passenger Cars
- 10.1.2. Commercial Vehicles
- 10.2. Market Analysis, Insights and Forecast - by Charger Type
- 10.2.1. AC Charging Station
- 10.2.2. DC Charging Station
- 10.3. Market Analysis, Insights and Forecast - by Charging Ownership Type
- 10.3.1. Public
- 10.3.2. Private
- 10.4. Market Analysis, Insights and Forecast - by Charging Service Type
- 10.4.1. EV Charging Services
- 10.4.2. Battery Swapping Services
- 10.5. Market Analysis, Insights and Forecast - by Charging Infrastructure Type
- 10.5.1. Chademo
- 10.5.2. CCS
- 10.5.3. GB/T Fast Charge
- 10.5.4. Tesla Superchargers
- 10.5.5. Other Charging Infrastructure Types
- 10.1. Market Analysis, Insights and Forecast - by Vehicle Type
- 11. Competitive Analysis
- 11.1. Company Profiles
- 11.1.1 EV Solutions (Webasto)
- 11.1.1.1. Company Overview
- 11.1.1.2. Products
- 11.1.1.3. Company Financials
- 11.1.1.4. SWOT Analysis
- 11.1.2 ABB Ltd
- 11.1.2.1. Company Overview
- 11.1.2.2. Products
- 11.1.2.3. Company Financials
- 11.1.2.4. SWOT Analysis
- 11.1.3 ChargePoint Inc
- 11.1.3.1. Company Overview
- 11.1.3.2. Products
- 11.1.3.3. Company Financials
- 11.1.3.4. SWOT Analysis
- 11.1.4 Chargemaster Limited (BP Pulse)
- 11.1.4.1. Company Overview
- 11.1.4.2. Products
- 11.1.4.3. Company Financials
- 11.1.4.4. SWOT Analysis
- 11.1.5 Qingdao Tgood Electric Co Ltd
- 11.1.5.1. Company Overview
- 11.1.5.2. Products
- 11.1.5.3. Company Financials
- 11.1.5.4. SWOT Analysis
- 11.1.6 Leviton Manufacturing Co Inc
- 11.1.6.1. Company Overview
- 11.1.6.2. Products
- 11.1.6.3. Company Financials
- 11.1.6.4. SWOT Analysis
- 11.1.7 BYD Company
- 11.1.7.1. Company Overview
- 11.1.7.2. Products
- 11.1.7.3. Company Financials
- 11.1.7.4. SWOT Analysis
- 11.1.8 Siemens AG
- 11.1.8.1. Company Overview
- 11.1.8.2. Products
- 11.1.8.3. Company Financials
- 11.1.8.4. SWOT Analysis
- 11.1.9 Schneider Electric SE
- 11.1.9.1. Company Overview
- 11.1.9.2. Products
- 11.1.9.3. Company Financials
- 11.1.9.4. SWOT Analysis
- 11.1.10 EFACEC Power Solutions SGPS
- 11.1.10.1. Company Overview
- 11.1.10.2. Products
- 11.1.10.3. Company Financials
- 11.1.10.4. SWOT Analysis
- 11.1.11 Evbox (ENGIE)
- 11.1.11.1. Company Overview
- 11.1.11.2. Products
- 11.1.11.3. Company Financials
- 11.1.11.4. SWOT Analysis
- 11.1.12 Wanbang Digital Energy Pte Ltd (Star Charge
- 11.1.12.1. Company Overview
- 11.1.12.2. Products
- 11.1.12.3. Company Financials
- 11.1.12.4. SWOT Analysis
- 11.1.13 Tesla Motors Inc
- 11.1.13.1. Company Overview
- 11.1.13.2. Products
- 11.1.13.3. Company Financials
- 11.1.13.4. SWOT Analysis
- 11.1.14 SemaConnect Inc
- 11.1.14.1. Company Overview
- 11.1.14.2. Products
- 11.1.14.3. Company Financials
- 11.1.14.4. SWOT Analysis
- 11.1.15 The Newmotion BV (Acquired by Shell)
- 11.1.15.1. Company Overview
- 11.1.15.2. Products
- 11.1.15.3. Company Financials
- 11.1.15.4. SWOT Analysis
- 11.1.1 EV Solutions (Webasto)
- 11.2. Market Entropy
- 11.2.1 Company's Key Areas Served
- 11.2.2 Recent Developments
- 11.3. Company Market Share Analysis 2025
- 11.3.1 Top 5 Companies Market Share Analysis
- 11.3.2 Top 3 Companies Market Share Analysis
- 11.4. List of Potential Customers
- 12. Research Methodology
List of Figures
- Figure 1: Global EV Charging Industry Revenue Breakdown (Million, %) by Region 2025 & 2033
- Figure 2: North America EV Charging Industry Revenue (Million), by Vehicle Type 2025 & 2033
- Figure 3: North America EV Charging Industry Revenue Share (%), by Vehicle Type 2025 & 2033
- Figure 4: North America EV Charging Industry Revenue (Million), by Charger Type 2025 & 2033
- Figure 5: North America EV Charging Industry Revenue Share (%), by Charger Type 2025 & 2033
- Figure 6: North America EV Charging Industry Revenue (Million), by Charging Ownership Type 2025 & 2033
- Figure 7: North America EV Charging Industry Revenue Share (%), by Charging Ownership Type 2025 & 2033
- Figure 8: North America EV Charging Industry Revenue (Million), by Charging Service Type 2025 & 2033
- Figure 9: North America EV Charging Industry Revenue Share (%), by Charging Service Type 2025 & 2033
- Figure 10: North America EV Charging Industry Revenue (Million), by Charging Infrastructure Type 2025 & 2033
- Figure 11: North America EV Charging Industry Revenue Share (%), by Charging Infrastructure Type 2025 & 2033
- Figure 12: North America EV Charging Industry Revenue (Million), by Country 2025 & 2033
- Figure 13: North America EV Charging Industry Revenue Share (%), by Country 2025 & 2033
- Figure 14: Europe EV Charging Industry Revenue (Million), by Vehicle Type 2025 & 2033
- Figure 15: Europe EV Charging Industry Revenue Share (%), by Vehicle Type 2025 & 2033
- Figure 16: Europe EV Charging Industry Revenue (Million), by Charger Type 2025 & 2033
- Figure 17: Europe EV Charging Industry Revenue Share (%), by Charger Type 2025 & 2033
- Figure 18: Europe EV Charging Industry Revenue (Million), by Charging Ownership Type 2025 & 2033
- Figure 19: Europe EV Charging Industry Revenue Share (%), by Charging Ownership Type 2025 & 2033
- Figure 20: Europe EV Charging Industry Revenue (Million), by Charging Service Type 2025 & 2033
- Figure 21: Europe EV Charging Industry Revenue Share (%), by Charging Service Type 2025 & 2033
- Figure 22: Europe EV Charging Industry Revenue (Million), by Charging Infrastructure Type 2025 & 2033
- Figure 23: Europe EV Charging Industry Revenue Share (%), by Charging Infrastructure Type 2025 & 2033
- Figure 24: Europe EV Charging Industry Revenue (Million), by Country 2025 & 2033
- Figure 25: Europe EV Charging Industry Revenue Share (%), by Country 2025 & 2033
- Figure 26: Asia Pacific EV Charging Industry Revenue (Million), by Vehicle Type 2025 & 2033
- Figure 27: Asia Pacific EV Charging Industry Revenue Share (%), by Vehicle Type 2025 & 2033
- Figure 28: Asia Pacific EV Charging Industry Revenue (Million), by Charger Type 2025 & 2033
- Figure 29: Asia Pacific EV Charging Industry Revenue Share (%), by Charger Type 2025 & 2033
- Figure 30: Asia Pacific EV Charging Industry Revenue (Million), by Charging Ownership Type 2025 & 2033
- Figure 31: Asia Pacific EV Charging Industry Revenue Share (%), by Charging Ownership Type 2025 & 2033
- Figure 32: Asia Pacific EV Charging Industry Revenue (Million), by Charging Service Type 2025 & 2033
- Figure 33: Asia Pacific EV Charging Industry Revenue Share (%), by Charging Service Type 2025 & 2033
- Figure 34: Asia Pacific EV Charging Industry Revenue (Million), by Charging Infrastructure Type 2025 & 2033
- Figure 35: Asia Pacific EV Charging Industry Revenue Share (%), by Charging Infrastructure Type 2025 & 2033
- Figure 36: Asia Pacific EV Charging Industry Revenue (Million), by Country 2025 & 2033
- Figure 37: Asia Pacific EV Charging Industry Revenue Share (%), by Country 2025 & 2033
- Figure 38: Rest of the World EV Charging Industry Revenue (Million), by Vehicle Type 2025 & 2033
- Figure 39: Rest of the World EV Charging Industry Revenue Share (%), by Vehicle Type 2025 & 2033
- Figure 40: Rest of the World EV Charging Industry Revenue (Million), by Charger Type 2025 & 2033
- Figure 41: Rest of the World EV Charging Industry Revenue Share (%), by Charger Type 2025 & 2033
- Figure 42: Rest of the World EV Charging Industry Revenue (Million), by Charging Ownership Type 2025 & 2033
- Figure 43: Rest of the World EV Charging Industry Revenue Share (%), by Charging Ownership Type 2025 & 2033
- Figure 44: Rest of the World EV Charging Industry Revenue (Million), by Charging Service Type 2025 & 2033
- Figure 45: Rest of the World EV Charging Industry Revenue Share (%), by Charging Service Type 2025 & 2033
- Figure 46: Rest of the World EV Charging Industry Revenue (Million), by Charging Infrastructure Type 2025 & 2033
- Figure 47: Rest of the World EV Charging Industry Revenue Share (%), by Charging Infrastructure Type 2025 & 2033
- Figure 48: Rest of the World EV Charging Industry Revenue (Million), by Country 2025 & 2033
- Figure 49: Rest of the World EV Charging Industry Revenue Share (%), by Country 2025 & 2033
List of Tables
- Table 1: Global EV Charging Industry Revenue Million Forecast, by Vehicle Type 2020 & 2033
- Table 2: Global EV Charging Industry Revenue Million Forecast, by Charger Type 2020 & 2033
- Table 3: Global EV Charging Industry Revenue Million Forecast, by Charging Ownership Type 2020 & 2033
- Table 4: Global EV Charging Industry Revenue Million Forecast, by Charging Service Type 2020 & 2033
- Table 5: Global EV Charging Industry Revenue Million Forecast, by Charging Infrastructure Type 2020 & 2033
- Table 6: Global EV Charging Industry Revenue Million Forecast, by Region 2020 & 2033
- Table 7: Global EV Charging Industry Revenue Million Forecast, by Vehicle Type 2020 & 2033
- Table 8: Global EV Charging Industry Revenue Million Forecast, by Charger Type 2020 & 2033
- Table 9: Global EV Charging Industry Revenue Million Forecast, by Charging Ownership Type 2020 & 2033
- Table 10: Global EV Charging Industry Revenue Million Forecast, by Charging Service Type 2020 & 2033
- Table 11: Global EV Charging Industry Revenue Million Forecast, by Charging Infrastructure Type 2020 & 2033
- Table 12: Global EV Charging Industry Revenue Million Forecast, by Country 2020 & 2033
- Table 13: United States EV Charging Industry Revenue (Million) Forecast, by Application 2020 & 2033
- Table 14: Canada EV Charging Industry Revenue (Million) Forecast, by Application 2020 & 2033
- Table 15: Rest of North America EV Charging Industry Revenue (Million) Forecast, by Application 2020 & 2033
- Table 16: Global EV Charging Industry Revenue Million Forecast, by Vehicle Type 2020 & 2033
- Table 17: Global EV Charging Industry Revenue Million Forecast, by Charger Type 2020 & 2033
- Table 18: Global EV Charging Industry Revenue Million Forecast, by Charging Ownership Type 2020 & 2033
- Table 19: Global EV Charging Industry Revenue Million Forecast, by Charging Service Type 2020 & 2033
- Table 20: Global EV Charging Industry Revenue Million Forecast, by Charging Infrastructure Type 2020 & 2033
- Table 21: Global EV Charging Industry Revenue Million Forecast, by Country 2020 & 2033
- Table 22: Germany EV Charging Industry Revenue (Million) Forecast, by Application 2020 & 2033
- Table 23: United Kingdom EV Charging Industry Revenue (Million) Forecast, by Application 2020 & 2033
- Table 24: France EV Charging Industry Revenue (Million) Forecast, by Application 2020 & 2033
- Table 25: Italy EV Charging Industry Revenue (Million) Forecast, by Application 2020 & 2033
- Table 26: Rest of Europe EV Charging Industry Revenue (Million) Forecast, by Application 2020 & 2033
- Table 27: Global EV Charging Industry Revenue Million Forecast, by Vehicle Type 2020 & 2033
- Table 28: Global EV Charging Industry Revenue Million Forecast, by Charger Type 2020 & 2033
- Table 29: Global EV Charging Industry Revenue Million Forecast, by Charging Ownership Type 2020 & 2033
- Table 30: Global EV Charging Industry Revenue Million Forecast, by Charging Service Type 2020 & 2033
- Table 31: Global EV Charging Industry Revenue Million Forecast, by Charging Infrastructure Type 2020 & 2033
- Table 32: Global EV Charging Industry Revenue Million Forecast, by Country 2020 & 2033
- Table 33: China EV Charging Industry Revenue (Million) Forecast, by Application 2020 & 2033
- Table 34: Japan EV Charging Industry Revenue (Million) Forecast, by Application 2020 & 2033
- Table 35: India EV Charging Industry Revenue (Million) Forecast, by Application 2020 & 2033
- Table 36: South Korea EV Charging Industry Revenue (Million) Forecast, by Application 2020 & 2033
- Table 37: Rest of Asia Pacific EV Charging Industry Revenue (Million) Forecast, by Application 2020 & 2033
- Table 38: Global EV Charging Industry Revenue Million Forecast, by Vehicle Type 2020 & 2033
- Table 39: Global EV Charging Industry Revenue Million Forecast, by Charger Type 2020 & 2033
- Table 40: Global EV Charging Industry Revenue Million Forecast, by Charging Ownership Type 2020 & 2033
- Table 41: Global EV Charging Industry Revenue Million Forecast, by Charging Service Type 2020 & 2033
- Table 42: Global EV Charging Industry Revenue Million Forecast, by Charging Infrastructure Type 2020 & 2033
- Table 43: Global EV Charging Industry Revenue Million Forecast, by Country 2020 & 2033
- Table 44: South America EV Charging Industry Revenue (Million) Forecast, by Application 2020 & 2033
- Table 45: Middle East and Africa EV Charging Industry Revenue (Million) Forecast, by Application 2020 & 2033
Frequently Asked Questions
1. What is the projected Compound Annual Growth Rate (CAGR) of the EV Charging Industry?
The projected CAGR is approximately 25.94%.
2. Which companies are prominent players in the EV Charging Industry?
Key companies in the market include EV Solutions (Webasto), ABB Ltd, ChargePoint Inc, Chargemaster Limited (BP Pulse), Qingdao Tgood Electric Co Ltd, Leviton Manufacturing Co Inc, BYD Company, Siemens AG, Schneider Electric SE, EFACEC Power Solutions SGPS, Evbox (ENGIE), Wanbang Digital Energy Pte Ltd (Star Charge, Tesla Motors Inc, SemaConnect Inc, The Newmotion BV (Acquired by Shell).
3. What are the main segments of the EV Charging Industry?
The market segments include Vehicle Type, Charger Type, Charging Ownership Type, Charging Service Type, Charging Infrastructure Type.
4. Can you provide details about the market size?
The market size is estimated to be USD 32.86 Million as of 2022.
5. What are some drivers contributing to market growth?
Rising EV Sales and Decreasing EV Prices are Driving the Market.
6. What are the notable trends driving market growth?
Passenger Cars are Leading the Electric Vehicle Charging Station Market.
7. Are there any restraints impacting market growth?
High Initial Cost of Installing and Maintaining a Standard EV Charging Station is a Challenge.
8. Can you provide examples of recent developments in the market?
June 2023: Stellantis introduced Free2move Charge, a comprehensive ecosystem that provides seamless charging and energy management solutions for electric vehicle (EV) customers. This holistic approach caters to EV needs across various scenarios, including home charging, business charging, and on-the-go charging. The initiative is overseen by the newly established Stellantis Charging & Energy Business Unit, emphasizing Stellantis’s commitment to supporting the growing EV market.
9. What pricing options are available for accessing the report?
Pricing options include single-user, multi-user, and enterprise licenses priced at USD 4750, USD 5250, and USD 8750 respectively.
10. Is the market size provided in terms of value or volume?
The market size is provided in terms of value, measured in Million.
11. Are there any specific market keywords associated with the report?
Yes, the market keyword associated with the report is "EV Charging Industry," which aids in identifying and referencing the specific market segment covered.
12. How do I determine which pricing option suits my needs best?
The pricing options vary based on user requirements and access needs. Individual users may opt for single-user licenses, while businesses requiring broader access may choose multi-user or enterprise licenses for cost-effective access to the report.
13. Are there any additional resources or data provided in the EV Charging Industry report?
While the report offers comprehensive insights, it's advisable to review the specific contents or supplementary materials provided to ascertain if additional resources or data are available.
14. How can I stay updated on further developments or reports in the EV Charging Industry?
To stay informed about further developments, trends, and reports in the EV Charging Industry, consider subscribing to industry newsletters, following relevant companies and organizations, or regularly checking reputable industry news sources and publications.
Methodology
Step 1 - Identification of Relevant Samples Size from Population Database


Step 2 - Approaches for Defining Global Market Size (Value, Volume* & Price*)

Note*: In applicable scenarios
Step 3 - Data Sources
Primary Research
- Web Analytics
- Survey Reports
- Research Institute
- Latest Research Reports
- Opinion Leaders
Secondary Research
- Annual Reports
- White Paper
- Latest Press Release
- Industry Association
- Paid Database
- Investor Presentations

Step 4 - Data Triangulation
Involves using different sources of information in order to increase the validity of a study
These sources are likely to be stakeholders in a program - participants, other researchers, program staff, other community members, and so on.
Then we put all data in single framework & apply various statistical tools to find out the dynamic on the market.
During the analysis stage, feedback from the stakeholder groups would be compared to determine areas of agreement as well as areas of divergence