
Key Insights
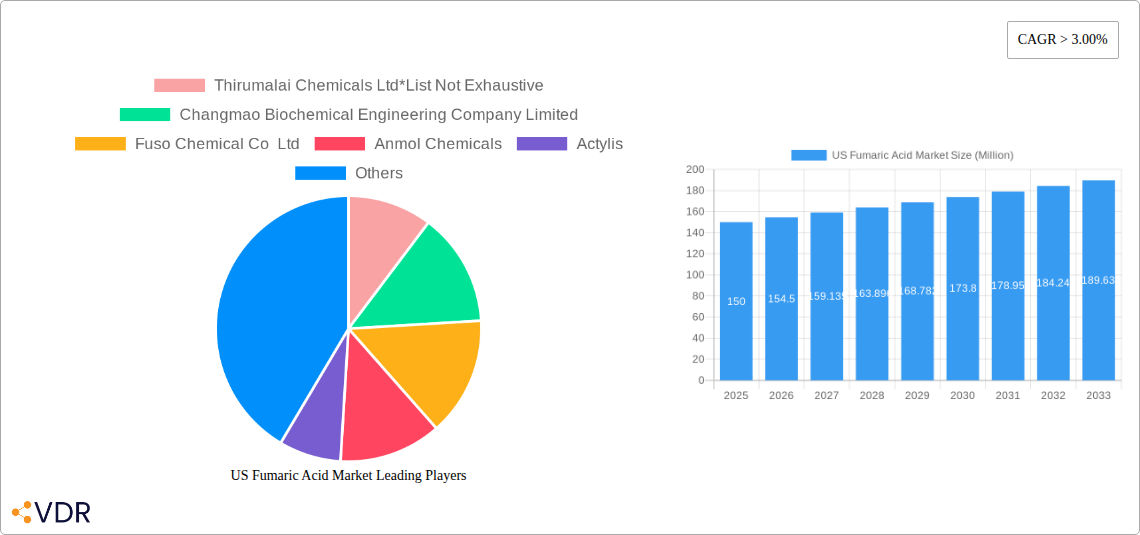
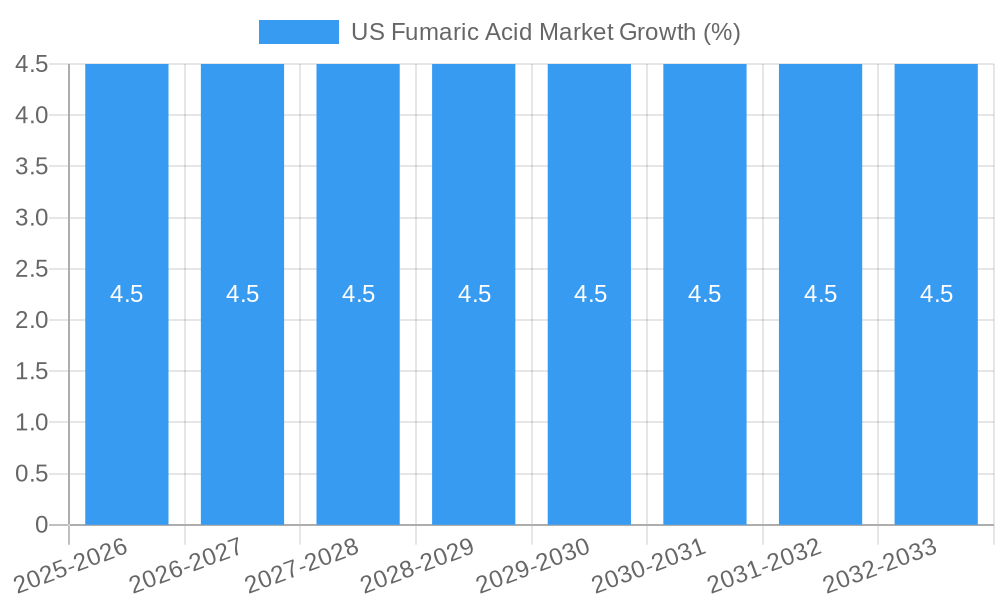
The US fumaric acid market, valued at approximately $150 million in 2025, is projected to experience robust growth, exhibiting a Compound Annual Growth Rate (CAGR) exceeding 3% from 2025 to 2033. This expansion is fueled by increasing demand across diverse sectors. The food and beverage industry, a major driver, utilizes fumaric acid as an acidulant and flavor enhancer, leveraging its functionality in bakery products, beverages, and processed foods. Growth in the food processing segment is further propelled by consumer preference for clean-label ingredients and natural food preservatives. Simultaneously, the burgeoning cosmetics and personal care industries are adopting fumaric acid for its skin-conditioning properties and use in various formulations. The technical grade segment, encompassing applications in unsaturated polyester resins, alkyd resins, and rosin paper sizing, also contributes significantly to market expansion, driven by the construction and packaging industries' growth. While supply chain constraints and fluctuating raw material prices pose challenges, technological advancements in production processes and the exploration of novel applications are expected to mitigate these restraints and contribute to sustained market growth throughout the forecast period.
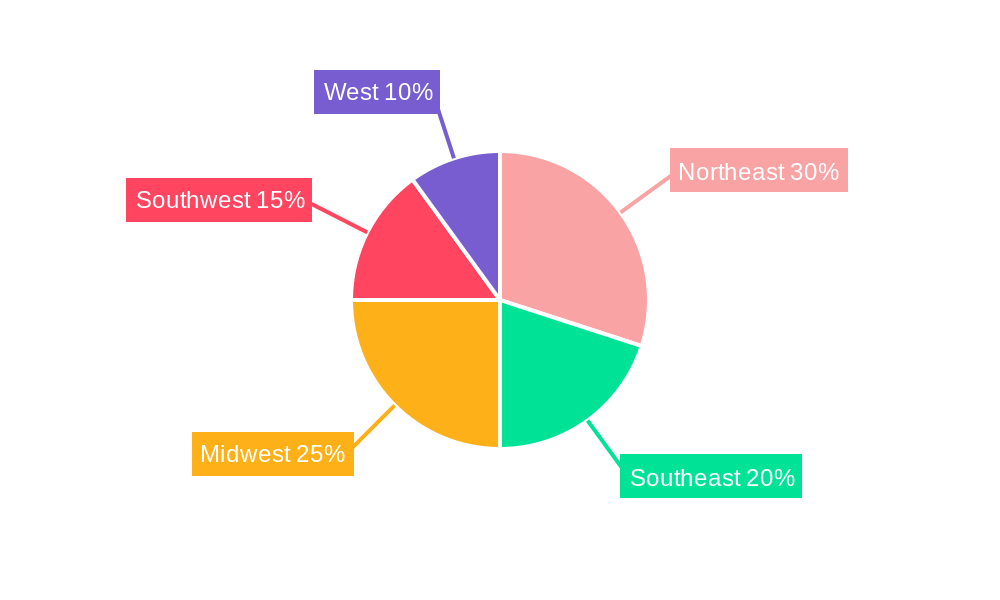
The regional distribution within the US reveals a higher market concentration in the Northeast and West regions, reflecting established manufacturing facilities and strong demand from key end-user industries. The Midwest and South regions are expected to witness considerable growth potential given the presence of growing food processing and chemical industries. Major players like Thirumalai Chemicals, Changmao Biochemical, Fuso Chemical, and Anmol Chemicals are actively shaping the competitive landscape through strategic expansions, product innovations, and partnerships. The market's future trajectory will be significantly influenced by evolving consumer preferences, technological innovations within manufacturing, and the overall economic climate. Increased focus on sustainability and eco-friendly production methods is expected to further influence the market dynamics in the coming years.
US Fumaric Acid Market: A Comprehensive Report (2019-2033)
This comprehensive report provides an in-depth analysis of the US fumaric acid market, covering market dynamics, growth trends, regional segmentation, product landscape, key players, and future outlook. The report utilizes data from 2019-2024 (historical period), with a base year of 2025 and a forecast period spanning 2025-2033. It's an essential resource for industry professionals, investors, and strategic decision-makers seeking a clear understanding of this dynamic market. The US fumaric acid market is segmented by type (Food Grade, Technical Grade), application (Food & Beverage Processing, Rosin Paper Sizing, Unsaturated Polyester Resin, Alkyd Resin, Personal Care and Cosmetics, Other Applications), and end-user industry (Food and Beverage, Cosmetics, Pharmaceutical, Chemical, Other End-user Industries).
US Fumaric Acid Market Market Dynamics & Structure
This section analyzes the competitive landscape of the US fumaric acid market, exploring market concentration, technological advancements, regulatory influences, and competitive substitutions. The report delves into market share distribution amongst key players, M&A activity (with quantified deal volumes), and qualitative factors impacting innovation and market expansion.
- Market Concentration: The US fumaric acid market exhibits a [xx]% market concentration level in 2025, with [xx] major players controlling a significant portion of the market share.
- Technological Innovation: Innovation in production processes, focusing on efficiency and sustainability, is driving market growth. However, high initial investment costs pose a barrier for smaller players.
- Regulatory Framework: FDA regulations regarding food-grade fumaric acid significantly influence market dynamics. Compliance necessitates stringent quality control and necessitates ongoing regulatory monitoring.
- Competitive Substitutes: [List and briefly describe competitive substitutes and their market impact].
- End-User Demographics: Growing consumer demand for processed foods, cosmetics, and pharmaceuticals fuels market growth across various end-user segments.
- M&A Trends: The report quantifies M&A activities in the sector, highlighting [xx] deals from 2019-2024, suggesting a [xx]% increase in consolidation activities within the market.
US Fumaric Acid Market Growth Trends & Insights
This section presents a detailed analysis of the US fumaric acid market's evolution, growth trajectory, and adoption patterns. Leveraging extensive market data, the report provides insights into market size, CAGR (Compound Annual Growth Rate), penetration rates, and the impact of technological disruptions and changing consumer preferences. The market is projected to reach [xx Million] by 2033, exhibiting a CAGR of [xx]% during the forecast period. Factors such as increasing demand from specific end-use segments and technological improvements contributing to cost reduction will continue to fuel market expansion.
Dominant Regions, Countries, or Segments in US Fumaric Acid Market
This section pinpoints the leading regions, countries, and market segments within the US fumaric acid market driving substantial growth. The analysis incorporates quantitative data (market share and growth potential) and qualitative factors (economic policies, infrastructure development, etc.). The [Specify Region, e.g., Northeast] region is projected to maintain its dominance due to [xx].
- Key Drivers (Food Grade Segment): Growing demand from the food and beverage industry, driven by the use of fumaric acid as an acidity regulator and food additive.
- Key Drivers (Technical Grade Segment): Significant application in the production of unsaturated polyester resins, alkyd resins and other industrial chemicals.
- Dominant Application: The Unsaturated Polyester Resin application segment is anticipated to witness the fastest growth during the forecast period due to [xx].
- Dominant End-User Industry: The Food & Beverage industry dominates the end-user landscape, representing [xx]% of the market share in 2025.
US Fumaric Acid Market Product Landscape
The US fumaric acid market features a range of products categorized by grade (food and technical) exhibiting varying purity levels and applications. Recent innovations center on improving production efficiency and sustainability, leading to enhanced product quality and reduced environmental impact. This has led to the development of higher-purity fumaric acid products catering to specialized applications in food processing and pharmaceutical industries.
Key Drivers, Barriers & Challenges in US Fumaric Acid Market
Key Drivers: Growing demand from the food and beverage industry, particularly for food-grade fumaric acid, increasing use in industrial applications, and technological advancements in production processes leading to cost reductions and efficiency gains.
Key Challenges and Restraints: Fluctuations in raw material prices, stringent regulatory compliance requirements, and intense competition from alternative chemicals pose challenges to market expansion. Supply chain disruptions due to geopolitical factors also present a significant hurdle to sustained growth.
Emerging Opportunities in US Fumaric Acid Market
The market presents opportunities in expanding applications such as animal feed, surfactants, and plasticizers. Furthermore, developing sustainable production methods and exploring new applications in niche markets could drive further growth. The increasing focus on bio-based materials presents a key opportunity for sustainable fumaric acid production.
Growth Accelerators in the US Fumaric Acid Market Industry
Strategic partnerships aimed at optimizing supply chains and expanding market reach, coupled with technological advancements aimed at reducing production costs and enhancing efficiency, are anticipated to be major growth catalysts in the coming years. Increased investment in R&D to develop innovative applications will contribute to further market expansion.
Key Players Shaping the US Fumaric Acid Market Market
- Thirumalai Chemicals Ltd
- Changmao Biochemical Engineering Company Limited
- Fuso Chemical Co Ltd
- Anmol Chemicals
- Actylis
- Merck KGaA
- NIPPON SHOKUBAI CO LTD
- Polynt SpA
Notable Milestones in US Fumaric Acid Market Sector
- 2021: [Insert notable milestone with details]
- 2023: [Insert notable milestone with details]
- 2024: [Insert notable milestone with details]
In-Depth US Fumaric Acid Market Market Outlook
The US fumaric acid market is poised for continued growth driven by expanding applications, rising demand from key end-use sectors, and ongoing technological advancements. Strategic collaborations, capacity expansions, and focus on sustainable production methods will shape market dynamics over the forecast period. Companies focusing on innovation and catering to specific niche applications will gain a competitive edge.
US Fumaric Acid Market Segmentation
-
1. Type
- 1.1. Food Grade
- 1.2. Technical Grade
-
2. Application
- 2.1. Food & Beverage Processing
- 2.2. Rosin Paper Sizing
- 2.3. Unsaturated Polyester Resin
- 2.4. Alkyd Resin
- 2.5. Personal Care and Cosmetics
- 2.6. Other Ap
-
3. End-user Industry
- 3.1. Food and Beverage
- 3.2. Cosmetics
- 3.3. Pharmaceutical
- 3.4. Chemical
- 3.5. Other End-user Industries (Rubber, Paint)
US Fumaric Acid Market Segmentation By Geography
-
1. North America
- 1.1. United States
- 1.2. Canada
- 1.3. Mexico
-
2. South America
- 2.1. Brazil
- 2.2. Argentina
- 2.3. Rest of South America
-
3. Europe
- 3.1. United Kingdom
- 3.2. Germany
- 3.3. France
- 3.4. Italy
- 3.5. Spain
- 3.6. Russia
- 3.7. Benelux
- 3.8. Nordics
- 3.9. Rest of Europe
-
4. Middle East & Africa
- 4.1. Turkey
- 4.2. Israel
- 4.3. GCC
- 4.4. North Africa
- 4.5. South Africa
- 4.6. Rest of Middle East & Africa
-
5. Asia Pacific
- 5.1. China
- 5.2. India
- 5.3. Japan
- 5.4. South Korea
- 5.5. ASEAN
- 5.6. Oceania
- 5.7. Rest of Asia Pacific
US Fumaric Acid Market REPORT HIGHLIGHTS
| Aspects | Details |
|---|---|
| Study Period | 2019-2033 |
| Base Year | 2024 |
| Estimated Year | 2025 |
| Forecast Period | 2025-2033 |
| Historical Period | 2019-2024 |
| Growth Rate | CAGR of > 3.00% from 2019-2033 |
| Segmentation |
|
Table of Contents
- 1. Introduction
- 1.1. Research Scope
- 1.2. Market Segmentation
- 1.3. Research Methodology
- 1.4. Definitions and Assumptions
- 2. Executive Summary
- 2.1. Introduction
- 3. Market Dynamics
- 3.1. Introduction
- 3.2. Market Drivers
- 3.2.1. Increasing Demand from Food and Beverage Industry; Growing Application in Pharmaceutical Industry; Other Drivers
- 3.3. Market Restrains
- 3.3.1. Health hazard Related to Fumaric Acid; Other Restraints
- 3.4. Market Trends
- 3.4.1. Food and Beverage Sector to Dominate the Market
- 4. Market Factor Analysis
- 4.1. Porters Five Forces
- 4.2. Supply/Value Chain
- 4.3. PESTEL analysis
- 4.4. Market Entropy
- 4.5. Patent/Trademark Analysis
- 5. Global US Fumaric Acid Market Analysis, Insights and Forecast, 2019-2031
- 5.1. Market Analysis, Insights and Forecast - by Type
- 5.1.1. Food Grade
- 5.1.2. Technical Grade
- 5.2. Market Analysis, Insights and Forecast - by Application
- 5.2.1. Food & Beverage Processing
- 5.2.2. Rosin Paper Sizing
- 5.2.3. Unsaturated Polyester Resin
- 5.2.4. Alkyd Resin
- 5.2.5. Personal Care and Cosmetics
- 5.2.6. Other Ap
- 5.3. Market Analysis, Insights and Forecast - by End-user Industry
- 5.3.1. Food and Beverage
- 5.3.2. Cosmetics
- 5.3.3. Pharmaceutical
- 5.3.4. Chemical
- 5.3.5. Other End-user Industries (Rubber, Paint)
- 5.4. Market Analysis, Insights and Forecast - by Region
- 5.4.1. North America
- 5.4.2. South America
- 5.4.3. Europe
- 5.4.4. Middle East & Africa
- 5.4.5. Asia Pacific
- 5.1. Market Analysis, Insights and Forecast - by Type
- 6. North America US Fumaric Acid Market Analysis, Insights and Forecast, 2019-2031
- 6.1. Market Analysis, Insights and Forecast - by Type
- 6.1.1. Food Grade
- 6.1.2. Technical Grade
- 6.2. Market Analysis, Insights and Forecast - by Application
- 6.2.1. Food & Beverage Processing
- 6.2.2. Rosin Paper Sizing
- 6.2.3. Unsaturated Polyester Resin
- 6.2.4. Alkyd Resin
- 6.2.5. Personal Care and Cosmetics
- 6.2.6. Other Ap
- 6.3. Market Analysis, Insights and Forecast - by End-user Industry
- 6.3.1. Food and Beverage
- 6.3.2. Cosmetics
- 6.3.3. Pharmaceutical
- 6.3.4. Chemical
- 6.3.5. Other End-user Industries (Rubber, Paint)
- 6.1. Market Analysis, Insights and Forecast - by Type
- 7. South America US Fumaric Acid Market Analysis, Insights and Forecast, 2019-2031
- 7.1. Market Analysis, Insights and Forecast - by Type
- 7.1.1. Food Grade
- 7.1.2. Technical Grade
- 7.2. Market Analysis, Insights and Forecast - by Application
- 7.2.1. Food & Beverage Processing
- 7.2.2. Rosin Paper Sizing
- 7.2.3. Unsaturated Polyester Resin
- 7.2.4. Alkyd Resin
- 7.2.5. Personal Care and Cosmetics
- 7.2.6. Other Ap
- 7.3. Market Analysis, Insights and Forecast - by End-user Industry
- 7.3.1. Food and Beverage
- 7.3.2. Cosmetics
- 7.3.3. Pharmaceutical
- 7.3.4. Chemical
- 7.3.5. Other End-user Industries (Rubber, Paint)
- 7.1. Market Analysis, Insights and Forecast - by Type
- 8. Europe US Fumaric Acid Market Analysis, Insights and Forecast, 2019-2031
- 8.1. Market Analysis, Insights and Forecast - by Type
- 8.1.1. Food Grade
- 8.1.2. Technical Grade
- 8.2. Market Analysis, Insights and Forecast - by Application
- 8.2.1. Food & Beverage Processing
- 8.2.2. Rosin Paper Sizing
- 8.2.3. Unsaturated Polyester Resin
- 8.2.4. Alkyd Resin
- 8.2.5. Personal Care and Cosmetics
- 8.2.6. Other Ap
- 8.3. Market Analysis, Insights and Forecast - by End-user Industry
- 8.3.1. Food and Beverage
- 8.3.2. Cosmetics
- 8.3.3. Pharmaceutical
- 8.3.4. Chemical
- 8.3.5. Other End-user Industries (Rubber, Paint)
- 8.1. Market Analysis, Insights and Forecast - by Type
- 9. Middle East & Africa US Fumaric Acid Market Analysis, Insights and Forecast, 2019-2031
- 9.1. Market Analysis, Insights and Forecast - by Type
- 9.1.1. Food Grade
- 9.1.2. Technical Grade
- 9.2. Market Analysis, Insights and Forecast - by Application
- 9.2.1. Food & Beverage Processing
- 9.2.2. Rosin Paper Sizing
- 9.2.3. Unsaturated Polyester Resin
- 9.2.4. Alkyd Resin
- 9.2.5. Personal Care and Cosmetics
- 9.2.6. Other Ap
- 9.3. Market Analysis, Insights and Forecast - by End-user Industry
- 9.3.1. Food and Beverage
- 9.3.2. Cosmetics
- 9.3.3. Pharmaceutical
- 9.3.4. Chemical
- 9.3.5. Other End-user Industries (Rubber, Paint)
- 9.1. Market Analysis, Insights and Forecast - by Type
- 10. Asia Pacific US Fumaric Acid Market Analysis, Insights and Forecast, 2019-2031
- 10.1. Market Analysis, Insights and Forecast - by Type
- 10.1.1. Food Grade
- 10.1.2. Technical Grade
- 10.2. Market Analysis, Insights and Forecast - by Application
- 10.2.1. Food & Beverage Processing
- 10.2.2. Rosin Paper Sizing
- 10.2.3. Unsaturated Polyester Resin
- 10.2.4. Alkyd Resin
- 10.2.5. Personal Care and Cosmetics
- 10.2.6. Other Ap
- 10.3. Market Analysis, Insights and Forecast - by End-user Industry
- 10.3.1. Food and Beverage
- 10.3.2. Cosmetics
- 10.3.3. Pharmaceutical
- 10.3.4. Chemical
- 10.3.5. Other End-user Industries (Rubber, Paint)
- 10.1. Market Analysis, Insights and Forecast - by Type
- 11. Northeast US Fumaric Acid Market Analysis, Insights and Forecast, 2019-2031
- 12. Southeast US Fumaric Acid Market Analysis, Insights and Forecast, 2019-2031
- 13. Midwest US Fumaric Acid Market Analysis, Insights and Forecast, 2019-2031
- 14. Southwest US Fumaric Acid Market Analysis, Insights and Forecast, 2019-2031
- 15. West US Fumaric Acid Market Analysis, Insights and Forecast, 2019-2031
- 16. Competitive Analysis
- 16.1. Global Market Share Analysis 2024
- 16.2. Company Profiles
- 16.2.1 Thirumalai Chemicals Ltd*List Not Exhaustive
- 16.2.1.1. Overview
- 16.2.1.2. Products
- 16.2.1.3. SWOT Analysis
- 16.2.1.4. Recent Developments
- 16.2.1.5. Financials (Based on Availability)
- 16.2.2 Changmao Biochemical Engineering Company Limited
- 16.2.2.1. Overview
- 16.2.2.2. Products
- 16.2.2.3. SWOT Analysis
- 16.2.2.4. Recent Developments
- 16.2.2.5. Financials (Based on Availability)
- 16.2.3 Fuso Chemical Co Ltd
- 16.2.3.1. Overview
- 16.2.3.2. Products
- 16.2.3.3. SWOT Analysis
- 16.2.3.4. Recent Developments
- 16.2.3.5. Financials (Based on Availability)
- 16.2.4 Anmol Chemicals
- 16.2.4.1. Overview
- 16.2.4.2. Products
- 16.2.4.3. SWOT Analysis
- 16.2.4.4. Recent Developments
- 16.2.4.5. Financials (Based on Availability)
- 16.2.5 Actylis
- 16.2.5.1. Overview
- 16.2.5.2. Products
- 16.2.5.3. SWOT Analysis
- 16.2.5.4. Recent Developments
- 16.2.5.5. Financials (Based on Availability)
- 16.2.6 Merck KGaA
- 16.2.6.1. Overview
- 16.2.6.2. Products
- 16.2.6.3. SWOT Analysis
- 16.2.6.4. Recent Developments
- 16.2.6.5. Financials (Based on Availability)
- 16.2.7 NIPPON SHOKUBAI CO LTD
- 16.2.7.1. Overview
- 16.2.7.2. Products
- 16.2.7.3. SWOT Analysis
- 16.2.7.4. Recent Developments
- 16.2.7.5. Financials (Based on Availability)
- 16.2.8 Polynt SpA
- 16.2.8.1. Overview
- 16.2.8.2. Products
- 16.2.8.3. SWOT Analysis
- 16.2.8.4. Recent Developments
- 16.2.8.5. Financials (Based on Availability)
- 16.2.1 Thirumalai Chemicals Ltd*List Not Exhaustive
List of Figures
- Figure 1: Global US Fumaric Acid Market Revenue Breakdown (Million, %) by Region 2024 & 2032
- Figure 2: United states US Fumaric Acid Market Revenue (Million), by Country 2024 & 2032
- Figure 3: United states US Fumaric Acid Market Revenue Share (%), by Country 2024 & 2032
- Figure 4: North America US Fumaric Acid Market Revenue (Million), by Type 2024 & 2032
- Figure 5: North America US Fumaric Acid Market Revenue Share (%), by Type 2024 & 2032
- Figure 6: North America US Fumaric Acid Market Revenue (Million), by Application 2024 & 2032
- Figure 7: North America US Fumaric Acid Market Revenue Share (%), by Application 2024 & 2032
- Figure 8: North America US Fumaric Acid Market Revenue (Million), by End-user Industry 2024 & 2032
- Figure 9: North America US Fumaric Acid Market Revenue Share (%), by End-user Industry 2024 & 2032
- Figure 10: North America US Fumaric Acid Market Revenue (Million), by Country 2024 & 2032
- Figure 11: North America US Fumaric Acid Market Revenue Share (%), by Country 2024 & 2032
- Figure 12: South America US Fumaric Acid Market Revenue (Million), by Type 2024 & 2032
- Figure 13: South America US Fumaric Acid Market Revenue Share (%), by Type 2024 & 2032
- Figure 14: South America US Fumaric Acid Market Revenue (Million), by Application 2024 & 2032
- Figure 15: South America US Fumaric Acid Market Revenue Share (%), by Application 2024 & 2032
- Figure 16: South America US Fumaric Acid Market Revenue (Million), by End-user Industry 2024 & 2032
- Figure 17: South America US Fumaric Acid Market Revenue Share (%), by End-user Industry 2024 & 2032
- Figure 18: South America US Fumaric Acid Market Revenue (Million), by Country 2024 & 2032
- Figure 19: South America US Fumaric Acid Market Revenue Share (%), by Country 2024 & 2032
- Figure 20: Europe US Fumaric Acid Market Revenue (Million), by Type 2024 & 2032
- Figure 21: Europe US Fumaric Acid Market Revenue Share (%), by Type 2024 & 2032
- Figure 22: Europe US Fumaric Acid Market Revenue (Million), by Application 2024 & 2032
- Figure 23: Europe US Fumaric Acid Market Revenue Share (%), by Application 2024 & 2032
- Figure 24: Europe US Fumaric Acid Market Revenue (Million), by End-user Industry 2024 & 2032
- Figure 25: Europe US Fumaric Acid Market Revenue Share (%), by End-user Industry 2024 & 2032
- Figure 26: Europe US Fumaric Acid Market Revenue (Million), by Country 2024 & 2032
- Figure 27: Europe US Fumaric Acid Market Revenue Share (%), by Country 2024 & 2032
- Figure 28: Middle East & Africa US Fumaric Acid Market Revenue (Million), by Type 2024 & 2032
- Figure 29: Middle East & Africa US Fumaric Acid Market Revenue Share (%), by Type 2024 & 2032
- Figure 30: Middle East & Africa US Fumaric Acid Market Revenue (Million), by Application 2024 & 2032
- Figure 31: Middle East & Africa US Fumaric Acid Market Revenue Share (%), by Application 2024 & 2032
- Figure 32: Middle East & Africa US Fumaric Acid Market Revenue (Million), by End-user Industry 2024 & 2032
- Figure 33: Middle East & Africa US Fumaric Acid Market Revenue Share (%), by End-user Industry 2024 & 2032
- Figure 34: Middle East & Africa US Fumaric Acid Market Revenue (Million), by Country 2024 & 2032
- Figure 35: Middle East & Africa US Fumaric Acid Market Revenue Share (%), by Country 2024 & 2032
- Figure 36: Asia Pacific US Fumaric Acid Market Revenue (Million), by Type 2024 & 2032
- Figure 37: Asia Pacific US Fumaric Acid Market Revenue Share (%), by Type 2024 & 2032
- Figure 38: Asia Pacific US Fumaric Acid Market Revenue (Million), by Application 2024 & 2032
- Figure 39: Asia Pacific US Fumaric Acid Market Revenue Share (%), by Application 2024 & 2032
- Figure 40: Asia Pacific US Fumaric Acid Market Revenue (Million), by End-user Industry 2024 & 2032
- Figure 41: Asia Pacific US Fumaric Acid Market Revenue Share (%), by End-user Industry 2024 & 2032
- Figure 42: Asia Pacific US Fumaric Acid Market Revenue (Million), by Country 2024 & 2032
- Figure 43: Asia Pacific US Fumaric Acid Market Revenue Share (%), by Country 2024 & 2032
List of Tables
- Table 1: Global US Fumaric Acid Market Revenue Million Forecast, by Region 2019 & 2032
- Table 2: Global US Fumaric Acid Market Revenue Million Forecast, by Type 2019 & 2032
- Table 3: Global US Fumaric Acid Market Revenue Million Forecast, by Application 2019 & 2032
- Table 4: Global US Fumaric Acid Market Revenue Million Forecast, by End-user Industry 2019 & 2032
- Table 5: Global US Fumaric Acid Market Revenue Million Forecast, by Region 2019 & 2032
- Table 6: Global US Fumaric Acid Market Revenue Million Forecast, by Country 2019 & 2032
- Table 7: Northeast US Fumaric Acid Market Revenue (Million) Forecast, by Application 2019 & 2032
- Table 8: Southeast US Fumaric Acid Market Revenue (Million) Forecast, by Application 2019 & 2032
- Table 9: Midwest US Fumaric Acid Market Revenue (Million) Forecast, by Application 2019 & 2032
- Table 10: Southwest US Fumaric Acid Market Revenue (Million) Forecast, by Application 2019 & 2032
- Table 11: West US Fumaric Acid Market Revenue (Million) Forecast, by Application 2019 & 2032
- Table 12: Global US Fumaric Acid Market Revenue Million Forecast, by Type 2019 & 2032
- Table 13: Global US Fumaric Acid Market Revenue Million Forecast, by Application 2019 & 2032
- Table 14: Global US Fumaric Acid Market Revenue Million Forecast, by End-user Industry 2019 & 2032
- Table 15: Global US Fumaric Acid Market Revenue Million Forecast, by Country 2019 & 2032
- Table 16: United States US Fumaric Acid Market Revenue (Million) Forecast, by Application 2019 & 2032
- Table 17: Canada US Fumaric Acid Market Revenue (Million) Forecast, by Application 2019 & 2032
- Table 18: Mexico US Fumaric Acid Market Revenue (Million) Forecast, by Application 2019 & 2032
- Table 19: Global US Fumaric Acid Market Revenue Million Forecast, by Type 2019 & 2032
- Table 20: Global US Fumaric Acid Market Revenue Million Forecast, by Application 2019 & 2032
- Table 21: Global US Fumaric Acid Market Revenue Million Forecast, by End-user Industry 2019 & 2032
- Table 22: Global US Fumaric Acid Market Revenue Million Forecast, by Country 2019 & 2032
- Table 23: Brazil US Fumaric Acid Market Revenue (Million) Forecast, by Application 2019 & 2032
- Table 24: Argentina US Fumaric Acid Market Revenue (Million) Forecast, by Application 2019 & 2032
- Table 25: Rest of South America US Fumaric Acid Market Revenue (Million) Forecast, by Application 2019 & 2032
- Table 26: Global US Fumaric Acid Market Revenue Million Forecast, by Type 2019 & 2032
- Table 27: Global US Fumaric Acid Market Revenue Million Forecast, by Application 2019 & 2032
- Table 28: Global US Fumaric Acid Market Revenue Million Forecast, by End-user Industry 2019 & 2032
- Table 29: Global US Fumaric Acid Market Revenue Million Forecast, by Country 2019 & 2032
- Table 30: United Kingdom US Fumaric Acid Market Revenue (Million) Forecast, by Application 2019 & 2032
- Table 31: Germany US Fumaric Acid Market Revenue (Million) Forecast, by Application 2019 & 2032
- Table 32: France US Fumaric Acid Market Revenue (Million) Forecast, by Application 2019 & 2032
- Table 33: Italy US Fumaric Acid Market Revenue (Million) Forecast, by Application 2019 & 2032
- Table 34: Spain US Fumaric Acid Market Revenue (Million) Forecast, by Application 2019 & 2032
- Table 35: Russia US Fumaric Acid Market Revenue (Million) Forecast, by Application 2019 & 2032
- Table 36: Benelux US Fumaric Acid Market Revenue (Million) Forecast, by Application 2019 & 2032
- Table 37: Nordics US Fumaric Acid Market Revenue (Million) Forecast, by Application 2019 & 2032
- Table 38: Rest of Europe US Fumaric Acid Market Revenue (Million) Forecast, by Application 2019 & 2032
- Table 39: Global US Fumaric Acid Market Revenue Million Forecast, by Type 2019 & 2032
- Table 40: Global US Fumaric Acid Market Revenue Million Forecast, by Application 2019 & 2032
- Table 41: Global US Fumaric Acid Market Revenue Million Forecast, by End-user Industry 2019 & 2032
- Table 42: Global US Fumaric Acid Market Revenue Million Forecast, by Country 2019 & 2032
- Table 43: Turkey US Fumaric Acid Market Revenue (Million) Forecast, by Application 2019 & 2032
- Table 44: Israel US Fumaric Acid Market Revenue (Million) Forecast, by Application 2019 & 2032
- Table 45: GCC US Fumaric Acid Market Revenue (Million) Forecast, by Application 2019 & 2032
- Table 46: North Africa US Fumaric Acid Market Revenue (Million) Forecast, by Application 2019 & 2032
- Table 47: South Africa US Fumaric Acid Market Revenue (Million) Forecast, by Application 2019 & 2032
- Table 48: Rest of Middle East & Africa US Fumaric Acid Market Revenue (Million) Forecast, by Application 2019 & 2032
- Table 49: Global US Fumaric Acid Market Revenue Million Forecast, by Type 2019 & 2032
- Table 50: Global US Fumaric Acid Market Revenue Million Forecast, by Application 2019 & 2032
- Table 51: Global US Fumaric Acid Market Revenue Million Forecast, by End-user Industry 2019 & 2032
- Table 52: Global US Fumaric Acid Market Revenue Million Forecast, by Country 2019 & 2032
- Table 53: China US Fumaric Acid Market Revenue (Million) Forecast, by Application 2019 & 2032
- Table 54: India US Fumaric Acid Market Revenue (Million) Forecast, by Application 2019 & 2032
- Table 55: Japan US Fumaric Acid Market Revenue (Million) Forecast, by Application 2019 & 2032
- Table 56: South Korea US Fumaric Acid Market Revenue (Million) Forecast, by Application 2019 & 2032
- Table 57: ASEAN US Fumaric Acid Market Revenue (Million) Forecast, by Application 2019 & 2032
- Table 58: Oceania US Fumaric Acid Market Revenue (Million) Forecast, by Application 2019 & 2032
- Table 59: Rest of Asia Pacific US Fumaric Acid Market Revenue (Million) Forecast, by Application 2019 & 2032
Frequently Asked Questions
1. What is the projected Compound Annual Growth Rate (CAGR) of the US Fumaric Acid Market?
The projected CAGR is approximately > 3.00%.
2. Which companies are prominent players in the US Fumaric Acid Market?
Key companies in the market include Thirumalai Chemicals Ltd*List Not Exhaustive, Changmao Biochemical Engineering Company Limited, Fuso Chemical Co Ltd, Anmol Chemicals, Actylis, Merck KGaA, NIPPON SHOKUBAI CO LTD, Polynt SpA.
3. What are the main segments of the US Fumaric Acid Market?
The market segments include Type, Application, End-user Industry.
4. Can you provide details about the market size?
The market size is estimated to be USD XX Million as of 2022.
5. What are some drivers contributing to market growth?
Increasing Demand from Food and Beverage Industry; Growing Application in Pharmaceutical Industry; Other Drivers.
6. What are the notable trends driving market growth?
Food and Beverage Sector to Dominate the Market.
7. Are there any restraints impacting market growth?
Health hazard Related to Fumaric Acid; Other Restraints.
8. Can you provide examples of recent developments in the market?
N/A
9. What pricing options are available for accessing the report?
Pricing options include single-user, multi-user, and enterprise licenses priced at USD 3800, USD 4500, and USD 5800 respectively.
10. Is the market size provided in terms of value or volume?
The market size is provided in terms of value, measured in Million.
11. Are there any specific market keywords associated with the report?
Yes, the market keyword associated with the report is "US Fumaric Acid Market," which aids in identifying and referencing the specific market segment covered.
12. How do I determine which pricing option suits my needs best?
The pricing options vary based on user requirements and access needs. Individual users may opt for single-user licenses, while businesses requiring broader access may choose multi-user or enterprise licenses for cost-effective access to the report.
13. Are there any additional resources or data provided in the US Fumaric Acid Market report?
While the report offers comprehensive insights, it's advisable to review the specific contents or supplementary materials provided to ascertain if additional resources or data are available.
14. How can I stay updated on further developments or reports in the US Fumaric Acid Market?
To stay informed about further developments, trends, and reports in the US Fumaric Acid Market, consider subscribing to industry newsletters, following relevant companies and organizations, or regularly checking reputable industry news sources and publications.
Methodology
Step 1 - Identification of Relevant Samples Size from Population Database


Step 2 - Approaches for Defining Global Market Size (Value, Volume* & Price*)

Note*: In applicable scenarios
Step 3 - Data Sources
Primary Research
- Web Analytics
- Survey Reports
- Research Institute
- Latest Research Reports
- Opinion Leaders
Secondary Research
- Annual Reports
- White Paper
- Latest Press Release
- Industry Association
- Paid Database
- Investor Presentations

Step 4 - Data Triangulation
Involves using different sources of information in order to increase the validity of a study
These sources are likely to be stakeholders in a program - participants, other researchers, program staff, other community members, and so on.
Then we put all data in single framework & apply various statistical tools to find out the dynamic on the market.
During the analysis stage, feedback from the stakeholder groups would be compared to determine areas of agreement as well as areas of divergence


