
Key Insights
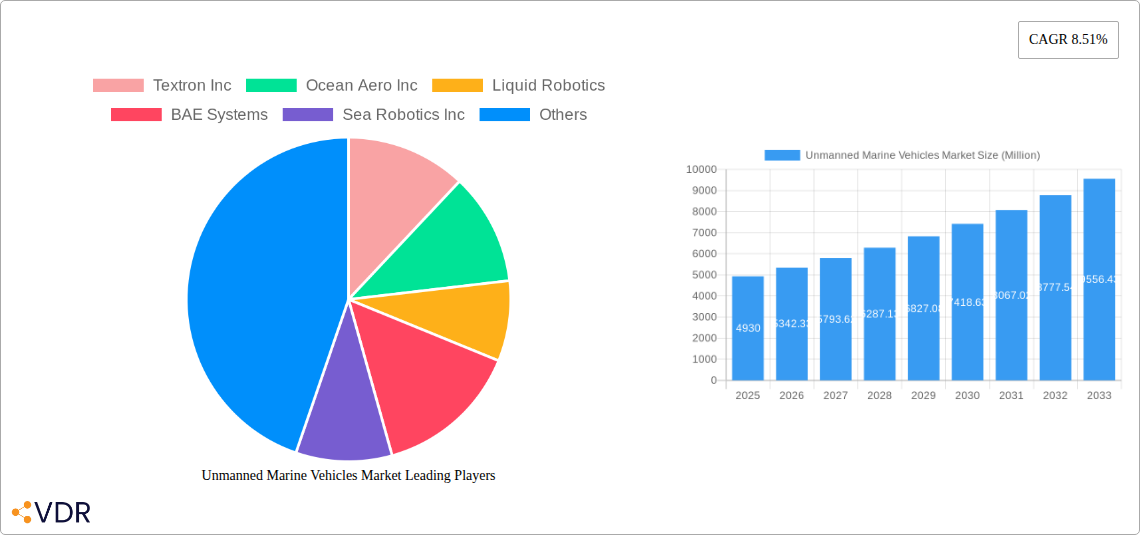
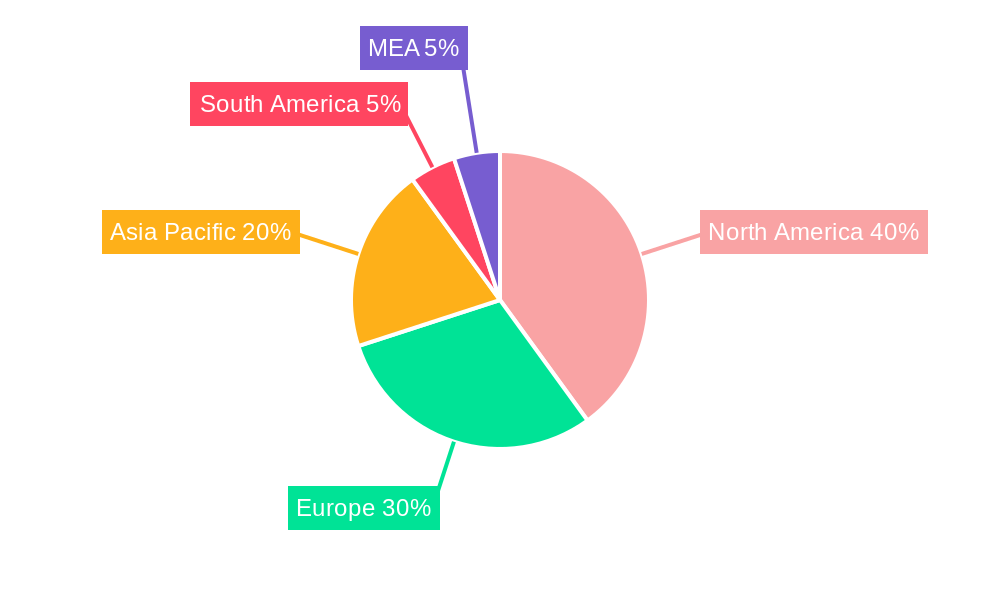
The Unmanned Marine Vehicles (UMV) market is experiencing robust growth, projected to reach a substantial size by 2033. Driven by increasing demand for cost-effective solutions in defense, research, and commercial applications, the market exhibits a Compound Annual Growth Rate (CAGR) of 8.51%. This growth is fueled by technological advancements in autonomous navigation, sensor integration, and underwater communication, leading to the development of more sophisticated and versatile UMVs. The market is segmented by vehicle type (surface and underwater), control type (remotely operated and autonomous), and application (defense, research, commercial, and others). The defense sector currently holds a significant share, driven by the need for improved maritime surveillance and mine countermeasures. However, the commercial sector is experiencing rapid growth, driven by applications in oceanographic research, offshore operations, and environmental monitoring. The North American market, particularly the United States, holds a dominant position due to significant investment in technological innovation and robust defense spending. However, the Asia-Pacific region is projected to witness the highest growth rate, spurred by increasing infrastructure development and rising awareness of the benefits of UMVs in diverse applications.
Continued growth in the UMV market will be influenced by factors such as increasing government investments in autonomous systems, the growing need for efficient and safe maritime operations, and the expanding applications of UMVs in various industries. However, factors such as high initial investment costs, regulatory hurdles concerning autonomous navigation and data security, and potential cybersecurity vulnerabilities pose challenges to market expansion. The competitive landscape is characterized by a mix of established defense contractors and innovative technology companies, leading to continuous innovation and the development of advanced UMV capabilities. Strategic collaborations, mergers, and acquisitions are likely to shape the competitive dynamics in the coming years. The market’s future hinges on overcoming the technological and regulatory challenges, while simultaneously capitalizing on the burgeoning demand across various sectors. This will require a collaborative effort between governments, industries, and research institutions to foster innovation and adoption of UMV technologies.
Unmanned Marine Vehicles Market: A Comprehensive Market Report (2019-2033)
This comprehensive report provides an in-depth analysis of the Unmanned Marine Vehicles (UMV) market, encompassing its current state, future trajectory, and key players. The study covers the parent market of Unmanned Vehicles and the child market of Unmanned Marine Vehicles, offering granular insights for informed decision-making. The report uses 2025 as the base year and projects market trends up to 2033, with historical data from 2019-2024. The market size is presented in Million units.
Unmanned Marine Vehicles Market Dynamics & Structure
The Unmanned Marine Vehicles market is characterized by moderate concentration, with several key players holding significant market share, while numerous smaller companies contribute to innovation. Technological advancements, particularly in autonomy, sensor technology, and AI-driven navigation, are driving market expansion. Stringent regulatory frameworks concerning safety and data security present both challenges and opportunities for innovation. Competitive product substitutes, such as traditional manned vessels, continue to exist, but their high operational costs and limitations in hazardous environments are creating a growing preference for UMVs. End-user demographics show strong demand from defense, research, and commercial sectors, with emerging applications continuously expanding the market. M&A activity in the sector has been moderate in recent years, with approximately xx deals recorded between 2019 and 2024, representing a xx% average annual increase.
- Market Concentration: Moderately concentrated, with top 5 players holding xx% market share in 2025.
- Technological Innovation: Focus on AI, improved autonomy, and enhanced sensor capabilities.
- Regulatory Landscape: Stringent safety and data security regulations impacting market growth.
- Competitive Substitutes: Traditional manned vessels, facing competition due to cost and operational limitations.
- End-User Demographics: Defense (xx%), Research (xx%), Commercial (xx%), Other (xx%) in 2025.
- M&A Activity: xx deals between 2019-2024, with an average annual growth of xx%.
Unmanned Marine Vehicles Market Growth Trends & Insights
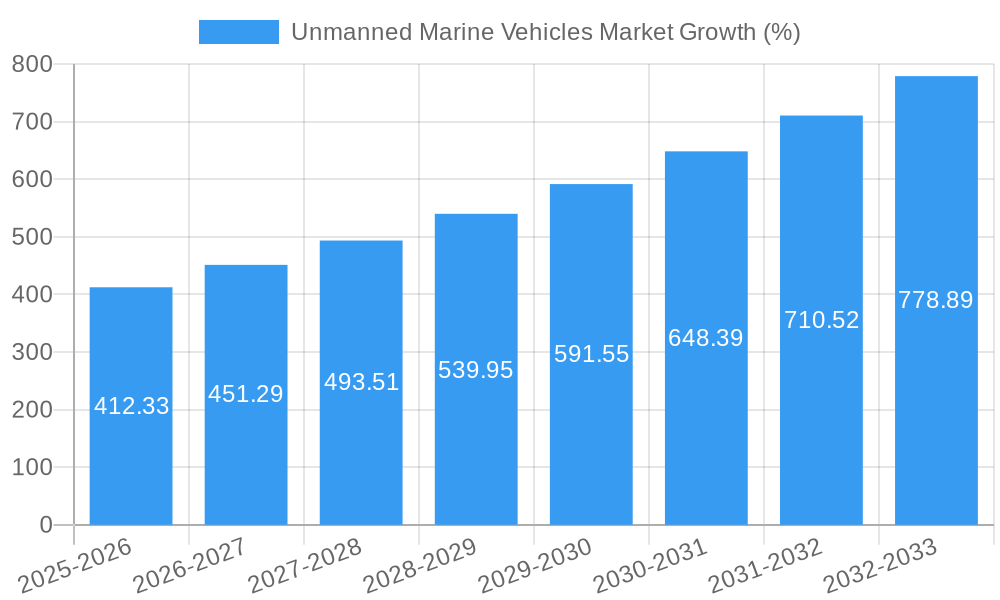
The global UMV market is experiencing robust growth, driven by increasing demand across diverse applications. From 2019 to 2024, the market exhibited a CAGR of xx%, reaching xx Million units in 2024. This growth is projected to continue at a CAGR of xx% from 2025 to 2033, reaching xx Million units by 2033. The adoption rate of autonomous UMVs is significantly increasing, driven by advancements in AI and machine learning, reducing operational costs and increasing mission effectiveness. Furthermore, consumer behavior shifts towards environmentally friendly solutions and the need for improved efficiency in maritime operations are fueling market expansion. The technological disruption stemming from the integration of advanced sensor technologies and data analytics is significantly impacting market growth, enabling more sophisticated and autonomous operations. Market penetration in certain regions and applications remains low, indicating significant future growth potential.
Dominant Regions, Countries, or Segments in Unmanned Marine Vehicles Market
The North American region currently dominates the UMV market, driven by substantial investments in defense and research applications, coupled with robust technological innovation. The strong presence of key players and supportive government policies contribute to this dominance. However, the Asia-Pacific region is projected to experience the highest growth rate in the forecast period, propelled by increasing investments in infrastructure development, maritime surveillance, and commercial activities. Within the segment breakdown:
Type: The Surface Vehicle segment holds the largest market share (xx%) in 2025 due to its versatility and relative ease of operation. However, the Underwater Vehicle segment is projected to witness faster growth (xx% CAGR) due to expanding applications in offshore exploration and inspection.
Control Type: The Remotely Operated segment currently dominates (xx% market share in 2025), but Autonomous vehicles are experiencing rapid growth, expected to reach xx% market share by 2033.
Application: The Defense segment accounts for the highest share (xx% in 2025) due to increased military spending and the need for advanced maritime surveillance capabilities. The Commercial segment, however, is expected to exhibit the fastest growth, driven by rising adoption across offshore industries.
Key Drivers: High defense spending, infrastructure development in Asia-Pacific, and growing commercial applications (e.g., offshore oil & gas, aquaculture).
Dominance Factors: Technological advancements in North America, supportive government policies, and strong presence of leading UMV manufacturers.
Unmanned Marine Vehicles Market Product Landscape
The UMV market showcases a diverse range of products, featuring variations in size, payload capacity, autonomy levels, and sensor integration. Recent innovations include improved underwater communication systems, enhanced sensor fusion techniques, and more robust power management systems. Key innovations focus on increasing operational range, improving endurance, and enhancing data processing capabilities. Unique selling propositions revolve around superior maneuverability, increased payload capacity, and enhanced data analysis capabilities compared to traditional solutions.
Key Drivers, Barriers & Challenges in Unmanned Marine Vehicles Market
Key Drivers:
- Increased defense spending: Governments are investing heavily in unmanned systems for maritime surveillance and defense applications.
- Growing commercial applications: UMVs are increasingly being used in offshore oil & gas, aquaculture, and other commercial sectors.
- Technological advancements: Improvements in autonomy, sensor technologies, and AI are driving down costs and increasing capabilities.
Challenges & Restraints:
- High initial investment costs: The upfront investment for UMVs can be substantial, posing a barrier to entry for smaller companies.
- Regulatory hurdles: Navigating complex regulatory landscapes can delay market entry and increase operational costs.
- Supply chain disruptions: Global supply chain issues can impact the availability of components and increase production costs.
Emerging Opportunities in Unmanned Marine Vehicles Market
- Expansion into new applications: Opportunities exist in environmental monitoring, search and rescue, and scientific research.
- Development of hybrid UMVs: Combining the strengths of different UMV types offers enhanced capabilities.
- Integration of advanced AI and machine learning: This can lead to more autonomous and efficient UMV operations.
Growth Accelerators in the Unmanned Marine Vehicles Market Industry
Technological breakthroughs, particularly in areas such as AI-powered navigation and advanced sensor technologies, are key growth catalysts. Strategic partnerships between technology companies and UMV manufacturers are accelerating innovation and market penetration. The expansion of UMV applications into new sectors, such as environmental monitoring and scientific research, fuels sustained market growth.
Key Players Shaping the Unmanned Marine Vehicles Market Market
- Textron Inc
- Ocean Aero Inc
- Liquid Robotics
- BAE Systems
- Sea Robotics Inc
- ECA Group
- Rafael Advanced Defense Systems
- Atlas Elektronik
- Thales Group
- General Dynamics
- Northrop Grumman
- Pelorus Naval Systems
- ASV Global
- Teledyne Technologies Inc
Notable Milestones in Unmanned Marine Vehicles Market Sector
- August 2022: Austal USA partners with Saildrone to build autonomous surface vehicles for the U.S. Navy.
- November 2021: Teledyne Marine partners with Seatronics to expand distribution of underwater imaging equipment.
- July 2021: Textron Systems pre-awarded an Advanced Reconnaissance Vehicle prototype agreement by the U.S. Marine Corps.
- March 2021: BAE Systems announces its Riptide UUV-12 unmanned undersea vehicle portfolio.
In-Depth Unmanned Marine Vehicles Market Market Outlook
The Unmanned Marine Vehicles market is poised for significant growth, fueled by continuous technological advancements, increasing demand across diverse sectors, and favorable government policies. Strategic partnerships and expansions into new applications will further drive market expansion. The potential for autonomous operations, data-driven insights, and environmentally friendly solutions ensures a bright future for the UMV industry. The market's long-term outlook is positive, presenting significant opportunities for both established players and new entrants.
Unmanned Marine Vehicles Market Segmentation
-
1. Type
- 1.1. Surface Vehicle
- 1.2. Underwater Vehicle
-
2. Control Type
- 2.1. Remotely Operated
- 2.2. Autonomous
-
3. Application
- 3.1. Defense
- 3.2. Research
- 3.3. Commercial
- 3.4. Other Applications
Unmanned Marine Vehicles Market Segmentation By Geography
-
1. North America
- 1.1. United States
- 1.2. Canada
-
2. Europe
- 2.1. Germany
- 2.2. Italy
- 2.3. France
- 2.4. Rest of Europe
-
3. Asia Pacific
- 3.1. China
- 3.2. Japan
- 3.3. India
- 3.4. Australia
- 3.5. Rest of Asia Pacific
-
4. Latin America
- 4.1. Brazil
- 4.2. Rest of Latin America
-
5. Middle East and Africa
- 5.1. South Africa
- 5.2. Rest of Middle East and Africa
Unmanned Marine Vehicles Market REPORT HIGHLIGHTS
| Aspects | Details |
|---|---|
| Study Period | 2019-2033 |
| Base Year | 2024 |
| Estimated Year | 2025 |
| Forecast Period | 2025-2033 |
| Historical Period | 2019-2024 |
| Growth Rate | CAGR of 8.51% from 2019-2033 |
| Segmentation |
|
Table of Contents
- 1. Introduction
- 1.1. Research Scope
- 1.2. Market Segmentation
- 1.3. Research Methodology
- 1.4. Definitions and Assumptions
- 2. Executive Summary
- 2.1. Introduction
- 3. Market Dynamics
- 3.1. Introduction
- 3.2. Market Drivers
- 3.2.1. Oceanic Surveillance for Defense Purposes; Increased Usage of Unmanned Marine Vehicles for Underwater Mapping for Marine Geoscience Studies
- 3.3. Market Restrains
- 3.3.1. High Cost for the Equipment and Maintenance Issues
- 3.4. Market Trends
- 3.4.1. The Defense Industry is Expected to Grow Significantly in the Market
- 4. Market Factor Analysis
- 4.1. Porters Five Forces
- 4.2. Supply/Value Chain
- 4.3. PESTEL analysis
- 4.4. Market Entropy
- 4.5. Patent/Trademark Analysis
- 5. Global Unmanned Marine Vehicles Market Analysis, Insights and Forecast, 2019-2031
- 5.1. Market Analysis, Insights and Forecast - by Type
- 5.1.1. Surface Vehicle
- 5.1.2. Underwater Vehicle
- 5.2. Market Analysis, Insights and Forecast - by Control Type
- 5.2.1. Remotely Operated
- 5.2.2. Autonomous
- 5.3. Market Analysis, Insights and Forecast - by Application
- 5.3.1. Defense
- 5.3.2. Research
- 5.3.3. Commercial
- 5.3.4. Other Applications
- 5.4. Market Analysis, Insights and Forecast - by Region
- 5.4.1. North America
- 5.4.2. Europe
- 5.4.3. Asia Pacific
- 5.4.4. Latin America
- 5.4.5. Middle East and Africa
- 5.1. Market Analysis, Insights and Forecast - by Type
- 6. North America Unmanned Marine Vehicles Market Analysis, Insights and Forecast, 2019-2031
- 6.1. Market Analysis, Insights and Forecast - by Type
- 6.1.1. Surface Vehicle
- 6.1.2. Underwater Vehicle
- 6.2. Market Analysis, Insights and Forecast - by Control Type
- 6.2.1. Remotely Operated
- 6.2.2. Autonomous
- 6.3. Market Analysis, Insights and Forecast - by Application
- 6.3.1. Defense
- 6.3.2. Research
- 6.3.3. Commercial
- 6.3.4. Other Applications
- 6.1. Market Analysis, Insights and Forecast - by Type
- 7. Europe Unmanned Marine Vehicles Market Analysis, Insights and Forecast, 2019-2031
- 7.1. Market Analysis, Insights and Forecast - by Type
- 7.1.1. Surface Vehicle
- 7.1.2. Underwater Vehicle
- 7.2. Market Analysis, Insights and Forecast - by Control Type
- 7.2.1. Remotely Operated
- 7.2.2. Autonomous
- 7.3. Market Analysis, Insights and Forecast - by Application
- 7.3.1. Defense
- 7.3.2. Research
- 7.3.3. Commercial
- 7.3.4. Other Applications
- 7.1. Market Analysis, Insights and Forecast - by Type
- 8. Asia Pacific Unmanned Marine Vehicles Market Analysis, Insights and Forecast, 2019-2031
- 8.1. Market Analysis, Insights and Forecast - by Type
- 8.1.1. Surface Vehicle
- 8.1.2. Underwater Vehicle
- 8.2. Market Analysis, Insights and Forecast - by Control Type
- 8.2.1. Remotely Operated
- 8.2.2. Autonomous
- 8.3. Market Analysis, Insights and Forecast - by Application
- 8.3.1. Defense
- 8.3.2. Research
- 8.3.3. Commercial
- 8.3.4. Other Applications
- 8.1. Market Analysis, Insights and Forecast - by Type
- 9. Latin America Unmanned Marine Vehicles Market Analysis, Insights and Forecast, 2019-2031
- 9.1. Market Analysis, Insights and Forecast - by Type
- 9.1.1. Surface Vehicle
- 9.1.2. Underwater Vehicle
- 9.2. Market Analysis, Insights and Forecast - by Control Type
- 9.2.1. Remotely Operated
- 9.2.2. Autonomous
- 9.3. Market Analysis, Insights and Forecast - by Application
- 9.3.1. Defense
- 9.3.2. Research
- 9.3.3. Commercial
- 9.3.4. Other Applications
- 9.1. Market Analysis, Insights and Forecast - by Type
- 10. Middle East and Africa Unmanned Marine Vehicles Market Analysis, Insights and Forecast, 2019-2031
- 10.1. Market Analysis, Insights and Forecast - by Type
- 10.1.1. Surface Vehicle
- 10.1.2. Underwater Vehicle
- 10.2. Market Analysis, Insights and Forecast - by Control Type
- 10.2.1. Remotely Operated
- 10.2.2. Autonomous
- 10.3. Market Analysis, Insights and Forecast - by Application
- 10.3.1. Defense
- 10.3.2. Research
- 10.3.3. Commercial
- 10.3.4. Other Applications
- 10.1. Market Analysis, Insights and Forecast - by Type
- 11. North America Unmanned Marine Vehicles Market Analysis, Insights and Forecast, 2019-2031
- 11.1. Market Analysis, Insights and Forecast - By Country/Sub-region
- 11.1.1 United States
- 11.1.2 Canada
- 11.1.3 Mexico
- 12. Europe Unmanned Marine Vehicles Market Analysis, Insights and Forecast, 2019-2031
- 12.1. Market Analysis, Insights and Forecast - By Country/Sub-region
- 12.1.1 Germany
- 12.1.2 United Kingdom
- 12.1.3 France
- 12.1.4 Spain
- 12.1.5 Italy
- 12.1.6 Spain
- 12.1.7 Belgium
- 12.1.8 Netherland
- 12.1.9 Nordics
- 12.1.10 Rest of Europe
- 13. Asia Pacific Unmanned Marine Vehicles Market Analysis, Insights and Forecast, 2019-2031
- 13.1. Market Analysis, Insights and Forecast - By Country/Sub-region
- 13.1.1 China
- 13.1.2 Japan
- 13.1.3 India
- 13.1.4 South Korea
- 13.1.5 Southeast Asia
- 13.1.6 Australia
- 13.1.7 Indonesia
- 13.1.8 Phillipes
- 13.1.9 Singapore
- 13.1.10 Thailandc
- 13.1.11 Rest of Asia Pacific
- 14. South America Unmanned Marine Vehicles Market Analysis, Insights and Forecast, 2019-2031
- 14.1. Market Analysis, Insights and Forecast - By Country/Sub-region
- 14.1.1 Brazil
- 14.1.2 Argentina
- 14.1.3 Peru
- 14.1.4 Chile
- 14.1.5 Colombia
- 14.1.6 Ecuador
- 14.1.7 Venezuela
- 14.1.8 Rest of South America
- 15. North America Unmanned Marine Vehicles Market Analysis, Insights and Forecast, 2019-2031
- 15.1. Market Analysis, Insights and Forecast - By Country/Sub-region
- 15.1.1 United States
- 15.1.2 Canada
- 15.1.3 Mexico
- 16. MEA Unmanned Marine Vehicles Market Analysis, Insights and Forecast, 2019-2031
- 16.1. Market Analysis, Insights and Forecast - By Country/Sub-region
- 16.1.1 United Arab Emirates
- 16.1.2 Saudi Arabia
- 16.1.3 South Africa
- 16.1.4 Rest of Middle East and Africa
- 17. Competitive Analysis
- 17.1. Global Market Share Analysis 2024
- 17.2. Company Profiles
- 17.2.1 Textron Inc
- 17.2.1.1. Overview
- 17.2.1.2. Products
- 17.2.1.3. SWOT Analysis
- 17.2.1.4. Recent Developments
- 17.2.1.5. Financials (Based on Availability)
- 17.2.2 Ocean Aero Inc
- 17.2.2.1. Overview
- 17.2.2.2. Products
- 17.2.2.3. SWOT Analysis
- 17.2.2.4. Recent Developments
- 17.2.2.5. Financials (Based on Availability)
- 17.2.3 Liquid Robotics
- 17.2.3.1. Overview
- 17.2.3.2. Products
- 17.2.3.3. SWOT Analysis
- 17.2.3.4. Recent Developments
- 17.2.3.5. Financials (Based on Availability)
- 17.2.4 BAE Systems
- 17.2.4.1. Overview
- 17.2.4.2. Products
- 17.2.4.3. SWOT Analysis
- 17.2.4.4. Recent Developments
- 17.2.4.5. Financials (Based on Availability)
- 17.2.5 Sea Robotics Inc
- 17.2.5.1. Overview
- 17.2.5.2. Products
- 17.2.5.3. SWOT Analysis
- 17.2.5.4. Recent Developments
- 17.2.5.5. Financials (Based on Availability)
- 17.2.6 ECA Group
- 17.2.6.1. Overview
- 17.2.6.2. Products
- 17.2.6.3. SWOT Analysis
- 17.2.6.4. Recent Developments
- 17.2.6.5. Financials (Based on Availability)
- 17.2.7 Rafael Advanced Defense Systems
- 17.2.7.1. Overview
- 17.2.7.2. Products
- 17.2.7.3. SWOT Analysis
- 17.2.7.4. Recent Developments
- 17.2.7.5. Financials (Based on Availability)
- 17.2.8 Atlas Elektronik
- 17.2.8.1. Overview
- 17.2.8.2. Products
- 17.2.8.3. SWOT Analysis
- 17.2.8.4. Recent Developments
- 17.2.8.5. Financials (Based on Availability)
- 17.2.9 Thales Group
- 17.2.9.1. Overview
- 17.2.9.2. Products
- 17.2.9.3. SWOT Analysis
- 17.2.9.4. Recent Developments
- 17.2.9.5. Financials (Based on Availability)
- 17.2.10 General Dynamics
- 17.2.10.1. Overview
- 17.2.10.2. Products
- 17.2.10.3. SWOT Analysis
- 17.2.10.4. Recent Developments
- 17.2.10.5. Financials (Based on Availability)
- 17.2.11 Northrop Grumman
- 17.2.11.1. Overview
- 17.2.11.2. Products
- 17.2.11.3. SWOT Analysis
- 17.2.11.4. Recent Developments
- 17.2.11.5. Financials (Based on Availability)
- 17.2.12 Pelorus Naval Systems
- 17.2.12.1. Overview
- 17.2.12.2. Products
- 17.2.12.3. SWOT Analysis
- 17.2.12.4. Recent Developments
- 17.2.12.5. Financials (Based on Availability)
- 17.2.13 ASV Globa
- 17.2.13.1. Overview
- 17.2.13.2. Products
- 17.2.13.3. SWOT Analysis
- 17.2.13.4. Recent Developments
- 17.2.13.5. Financials (Based on Availability)
- 17.2.14 Teledyne Technologies Inc
- 17.2.14.1. Overview
- 17.2.14.2. Products
- 17.2.14.3. SWOT Analysis
- 17.2.14.4. Recent Developments
- 17.2.14.5. Financials (Based on Availability)
- 17.2.1 Textron Inc
List of Figures
- Figure 1: Global Unmanned Marine Vehicles Market Revenue Breakdown (Million, %) by Region 2024 & 2032
- Figure 2: Global Unmanned Marine Vehicles Market Volume Breakdown (K Unit, %) by Region 2024 & 2032
- Figure 3: North America Unmanned Marine Vehicles Market Revenue (Million), by Country 2024 & 2032
- Figure 4: North America Unmanned Marine Vehicles Market Volume (K Unit), by Country 2024 & 2032
- Figure 5: North America Unmanned Marine Vehicles Market Revenue Share (%), by Country 2024 & 2032
- Figure 6: North America Unmanned Marine Vehicles Market Volume Share (%), by Country 2024 & 2032
- Figure 7: Europe Unmanned Marine Vehicles Market Revenue (Million), by Country 2024 & 2032
- Figure 8: Europe Unmanned Marine Vehicles Market Volume (K Unit), by Country 2024 & 2032
- Figure 9: Europe Unmanned Marine Vehicles Market Revenue Share (%), by Country 2024 & 2032
- Figure 10: Europe Unmanned Marine Vehicles Market Volume Share (%), by Country 2024 & 2032
- Figure 11: Asia Pacific Unmanned Marine Vehicles Market Revenue (Million), by Country 2024 & 2032
- Figure 12: Asia Pacific Unmanned Marine Vehicles Market Volume (K Unit), by Country 2024 & 2032
- Figure 13: Asia Pacific Unmanned Marine Vehicles Market Revenue Share (%), by Country 2024 & 2032
- Figure 14: Asia Pacific Unmanned Marine Vehicles Market Volume Share (%), by Country 2024 & 2032
- Figure 15: South America Unmanned Marine Vehicles Market Revenue (Million), by Country 2024 & 2032
- Figure 16: South America Unmanned Marine Vehicles Market Volume (K Unit), by Country 2024 & 2032
- Figure 17: South America Unmanned Marine Vehicles Market Revenue Share (%), by Country 2024 & 2032
- Figure 18: South America Unmanned Marine Vehicles Market Volume Share (%), by Country 2024 & 2032
- Figure 19: North America Unmanned Marine Vehicles Market Revenue (Million), by Country 2024 & 2032
- Figure 20: North America Unmanned Marine Vehicles Market Volume (K Unit), by Country 2024 & 2032
- Figure 21: North America Unmanned Marine Vehicles Market Revenue Share (%), by Country 2024 & 2032
- Figure 22: North America Unmanned Marine Vehicles Market Volume Share (%), by Country 2024 & 2032
- Figure 23: MEA Unmanned Marine Vehicles Market Revenue (Million), by Country 2024 & 2032
- Figure 24: MEA Unmanned Marine Vehicles Market Volume (K Unit), by Country 2024 & 2032
- Figure 25: MEA Unmanned Marine Vehicles Market Revenue Share (%), by Country 2024 & 2032
- Figure 26: MEA Unmanned Marine Vehicles Market Volume Share (%), by Country 2024 & 2032
- Figure 27: North America Unmanned Marine Vehicles Market Revenue (Million), by Type 2024 & 2032
- Figure 28: North America Unmanned Marine Vehicles Market Volume (K Unit), by Type 2024 & 2032
- Figure 29: North America Unmanned Marine Vehicles Market Revenue Share (%), by Type 2024 & 2032
- Figure 30: North America Unmanned Marine Vehicles Market Volume Share (%), by Type 2024 & 2032
- Figure 31: North America Unmanned Marine Vehicles Market Revenue (Million), by Control Type 2024 & 2032
- Figure 32: North America Unmanned Marine Vehicles Market Volume (K Unit), by Control Type 2024 & 2032
- Figure 33: North America Unmanned Marine Vehicles Market Revenue Share (%), by Control Type 2024 & 2032
- Figure 34: North America Unmanned Marine Vehicles Market Volume Share (%), by Control Type 2024 & 2032
- Figure 35: North America Unmanned Marine Vehicles Market Revenue (Million), by Application 2024 & 2032
- Figure 36: North America Unmanned Marine Vehicles Market Volume (K Unit), by Application 2024 & 2032
- Figure 37: North America Unmanned Marine Vehicles Market Revenue Share (%), by Application 2024 & 2032
- Figure 38: North America Unmanned Marine Vehicles Market Volume Share (%), by Application 2024 & 2032
- Figure 39: North America Unmanned Marine Vehicles Market Revenue (Million), by Country 2024 & 2032
- Figure 40: North America Unmanned Marine Vehicles Market Volume (K Unit), by Country 2024 & 2032
- Figure 41: North America Unmanned Marine Vehicles Market Revenue Share (%), by Country 2024 & 2032
- Figure 42: North America Unmanned Marine Vehicles Market Volume Share (%), by Country 2024 & 2032
- Figure 43: Europe Unmanned Marine Vehicles Market Revenue (Million), by Type 2024 & 2032
- Figure 44: Europe Unmanned Marine Vehicles Market Volume (K Unit), by Type 2024 & 2032
- Figure 45: Europe Unmanned Marine Vehicles Market Revenue Share (%), by Type 2024 & 2032
- Figure 46: Europe Unmanned Marine Vehicles Market Volume Share (%), by Type 2024 & 2032
- Figure 47: Europe Unmanned Marine Vehicles Market Revenue (Million), by Control Type 2024 & 2032
- Figure 48: Europe Unmanned Marine Vehicles Market Volume (K Unit), by Control Type 2024 & 2032
- Figure 49: Europe Unmanned Marine Vehicles Market Revenue Share (%), by Control Type 2024 & 2032
- Figure 50: Europe Unmanned Marine Vehicles Market Volume Share (%), by Control Type 2024 & 2032
- Figure 51: Europe Unmanned Marine Vehicles Market Revenue (Million), by Application 2024 & 2032
- Figure 52: Europe Unmanned Marine Vehicles Market Volume (K Unit), by Application 2024 & 2032
- Figure 53: Europe Unmanned Marine Vehicles Market Revenue Share (%), by Application 2024 & 2032
- Figure 54: Europe Unmanned Marine Vehicles Market Volume Share (%), by Application 2024 & 2032
- Figure 55: Europe Unmanned Marine Vehicles Market Revenue (Million), by Country 2024 & 2032
- Figure 56: Europe Unmanned Marine Vehicles Market Volume (K Unit), by Country 2024 & 2032
- Figure 57: Europe Unmanned Marine Vehicles Market Revenue Share (%), by Country 2024 & 2032
- Figure 58: Europe Unmanned Marine Vehicles Market Volume Share (%), by Country 2024 & 2032
- Figure 59: Asia Pacific Unmanned Marine Vehicles Market Revenue (Million), by Type 2024 & 2032
- Figure 60: Asia Pacific Unmanned Marine Vehicles Market Volume (K Unit), by Type 2024 & 2032
- Figure 61: Asia Pacific Unmanned Marine Vehicles Market Revenue Share (%), by Type 2024 & 2032
- Figure 62: Asia Pacific Unmanned Marine Vehicles Market Volume Share (%), by Type 2024 & 2032
- Figure 63: Asia Pacific Unmanned Marine Vehicles Market Revenue (Million), by Control Type 2024 & 2032
- Figure 64: Asia Pacific Unmanned Marine Vehicles Market Volume (K Unit), by Control Type 2024 & 2032
- Figure 65: Asia Pacific Unmanned Marine Vehicles Market Revenue Share (%), by Control Type 2024 & 2032
- Figure 66: Asia Pacific Unmanned Marine Vehicles Market Volume Share (%), by Control Type 2024 & 2032
- Figure 67: Asia Pacific Unmanned Marine Vehicles Market Revenue (Million), by Application 2024 & 2032
- Figure 68: Asia Pacific Unmanned Marine Vehicles Market Volume (K Unit), by Application 2024 & 2032
- Figure 69: Asia Pacific Unmanned Marine Vehicles Market Revenue Share (%), by Application 2024 & 2032
- Figure 70: Asia Pacific Unmanned Marine Vehicles Market Volume Share (%), by Application 2024 & 2032
- Figure 71: Asia Pacific Unmanned Marine Vehicles Market Revenue (Million), by Country 2024 & 2032
- Figure 72: Asia Pacific Unmanned Marine Vehicles Market Volume (K Unit), by Country 2024 & 2032
- Figure 73: Asia Pacific Unmanned Marine Vehicles Market Revenue Share (%), by Country 2024 & 2032
- Figure 74: Asia Pacific Unmanned Marine Vehicles Market Volume Share (%), by Country 2024 & 2032
- Figure 75: Latin America Unmanned Marine Vehicles Market Revenue (Million), by Type 2024 & 2032
- Figure 76: Latin America Unmanned Marine Vehicles Market Volume (K Unit), by Type 2024 & 2032
- Figure 77: Latin America Unmanned Marine Vehicles Market Revenue Share (%), by Type 2024 & 2032
- Figure 78: Latin America Unmanned Marine Vehicles Market Volume Share (%), by Type 2024 & 2032
- Figure 79: Latin America Unmanned Marine Vehicles Market Revenue (Million), by Control Type 2024 & 2032
- Figure 80: Latin America Unmanned Marine Vehicles Market Volume (K Unit), by Control Type 2024 & 2032
- Figure 81: Latin America Unmanned Marine Vehicles Market Revenue Share (%), by Control Type 2024 & 2032
- Figure 82: Latin America Unmanned Marine Vehicles Market Volume Share (%), by Control Type 2024 & 2032
- Figure 83: Latin America Unmanned Marine Vehicles Market Revenue (Million), by Application 2024 & 2032
- Figure 84: Latin America Unmanned Marine Vehicles Market Volume (K Unit), by Application 2024 & 2032
- Figure 85: Latin America Unmanned Marine Vehicles Market Revenue Share (%), by Application 2024 & 2032
- Figure 86: Latin America Unmanned Marine Vehicles Market Volume Share (%), by Application 2024 & 2032
- Figure 87: Latin America Unmanned Marine Vehicles Market Revenue (Million), by Country 2024 & 2032
- Figure 88: Latin America Unmanned Marine Vehicles Market Volume (K Unit), by Country 2024 & 2032
- Figure 89: Latin America Unmanned Marine Vehicles Market Revenue Share (%), by Country 2024 & 2032
- Figure 90: Latin America Unmanned Marine Vehicles Market Volume Share (%), by Country 2024 & 2032
- Figure 91: Middle East and Africa Unmanned Marine Vehicles Market Revenue (Million), by Type 2024 & 2032
- Figure 92: Middle East and Africa Unmanned Marine Vehicles Market Volume (K Unit), by Type 2024 & 2032
- Figure 93: Middle East and Africa Unmanned Marine Vehicles Market Revenue Share (%), by Type 2024 & 2032
- Figure 94: Middle East and Africa Unmanned Marine Vehicles Market Volume Share (%), by Type 2024 & 2032
- Figure 95: Middle East and Africa Unmanned Marine Vehicles Market Revenue (Million), by Control Type 2024 & 2032
- Figure 96: Middle East and Africa Unmanned Marine Vehicles Market Volume (K Unit), by Control Type 2024 & 2032
- Figure 97: Middle East and Africa Unmanned Marine Vehicles Market Revenue Share (%), by Control Type 2024 & 2032
- Figure 98: Middle East and Africa Unmanned Marine Vehicles Market Volume Share (%), by Control Type 2024 & 2032
- Figure 99: Middle East and Africa Unmanned Marine Vehicles Market Revenue (Million), by Application 2024 & 2032
- Figure 100: Middle East and Africa Unmanned Marine Vehicles Market Volume (K Unit), by Application 2024 & 2032
- Figure 101: Middle East and Africa Unmanned Marine Vehicles Market Revenue Share (%), by Application 2024 & 2032
- Figure 102: Middle East and Africa Unmanned Marine Vehicles Market Volume Share (%), by Application 2024 & 2032
- Figure 103: Middle East and Africa Unmanned Marine Vehicles Market Revenue (Million), by Country 2024 & 2032
- Figure 104: Middle East and Africa Unmanned Marine Vehicles Market Volume (K Unit), by Country 2024 & 2032
- Figure 105: Middle East and Africa Unmanned Marine Vehicles Market Revenue Share (%), by Country 2024 & 2032
- Figure 106: Middle East and Africa Unmanned Marine Vehicles Market Volume Share (%), by Country 2024 & 2032
List of Tables
- Table 1: Global Unmanned Marine Vehicles Market Revenue Million Forecast, by Region 2019 & 2032
- Table 2: Global Unmanned Marine Vehicles Market Volume K Unit Forecast, by Region 2019 & 2032
- Table 3: Global Unmanned Marine Vehicles Market Revenue Million Forecast, by Type 2019 & 2032
- Table 4: Global Unmanned Marine Vehicles Market Volume K Unit Forecast, by Type 2019 & 2032
- Table 5: Global Unmanned Marine Vehicles Market Revenue Million Forecast, by Control Type 2019 & 2032
- Table 6: Global Unmanned Marine Vehicles Market Volume K Unit Forecast, by Control Type 2019 & 2032
- Table 7: Global Unmanned Marine Vehicles Market Revenue Million Forecast, by Application 2019 & 2032
- Table 8: Global Unmanned Marine Vehicles Market Volume K Unit Forecast, by Application 2019 & 2032
- Table 9: Global Unmanned Marine Vehicles Market Revenue Million Forecast, by Region 2019 & 2032
- Table 10: Global Unmanned Marine Vehicles Market Volume K Unit Forecast, by Region 2019 & 2032
- Table 11: Global Unmanned Marine Vehicles Market Revenue Million Forecast, by Country 2019 & 2032
- Table 12: Global Unmanned Marine Vehicles Market Volume K Unit Forecast, by Country 2019 & 2032
- Table 13: United States Unmanned Marine Vehicles Market Revenue (Million) Forecast, by Application 2019 & 2032
- Table 14: United States Unmanned Marine Vehicles Market Volume (K Unit) Forecast, by Application 2019 & 2032
- Table 15: Canada Unmanned Marine Vehicles Market Revenue (Million) Forecast, by Application 2019 & 2032
- Table 16: Canada Unmanned Marine Vehicles Market Volume (K Unit) Forecast, by Application 2019 & 2032
- Table 17: Mexico Unmanned Marine Vehicles Market Revenue (Million) Forecast, by Application 2019 & 2032
- Table 18: Mexico Unmanned Marine Vehicles Market Volume (K Unit) Forecast, by Application 2019 & 2032
- Table 19: Global Unmanned Marine Vehicles Market Revenue Million Forecast, by Country 2019 & 2032
- Table 20: Global Unmanned Marine Vehicles Market Volume K Unit Forecast, by Country 2019 & 2032
- Table 21: Germany Unmanned Marine Vehicles Market Revenue (Million) Forecast, by Application 2019 & 2032
- Table 22: Germany Unmanned Marine Vehicles Market Volume (K Unit) Forecast, by Application 2019 & 2032
- Table 23: United Kingdom Unmanned Marine Vehicles Market Revenue (Million) Forecast, by Application 2019 & 2032
- Table 24: United Kingdom Unmanned Marine Vehicles Market Volume (K Unit) Forecast, by Application 2019 & 2032
- Table 25: France Unmanned Marine Vehicles Market Revenue (Million) Forecast, by Application 2019 & 2032
- Table 26: France Unmanned Marine Vehicles Market Volume (K Unit) Forecast, by Application 2019 & 2032
- Table 27: Spain Unmanned Marine Vehicles Market Revenue (Million) Forecast, by Application 2019 & 2032
- Table 28: Spain Unmanned Marine Vehicles Market Volume (K Unit) Forecast, by Application 2019 & 2032
- Table 29: Italy Unmanned Marine Vehicles Market Revenue (Million) Forecast, by Application 2019 & 2032
- Table 30: Italy Unmanned Marine Vehicles Market Volume (K Unit) Forecast, by Application 2019 & 2032
- Table 31: Spain Unmanned Marine Vehicles Market Revenue (Million) Forecast, by Application 2019 & 2032
- Table 32: Spain Unmanned Marine Vehicles Market Volume (K Unit) Forecast, by Application 2019 & 2032
- Table 33: Belgium Unmanned Marine Vehicles Market Revenue (Million) Forecast, by Application 2019 & 2032
- Table 34: Belgium Unmanned Marine Vehicles Market Volume (K Unit) Forecast, by Application 2019 & 2032
- Table 35: Netherland Unmanned Marine Vehicles Market Revenue (Million) Forecast, by Application 2019 & 2032
- Table 36: Netherland Unmanned Marine Vehicles Market Volume (K Unit) Forecast, by Application 2019 & 2032
- Table 37: Nordics Unmanned Marine Vehicles Market Revenue (Million) Forecast, by Application 2019 & 2032
- Table 38: Nordics Unmanned Marine Vehicles Market Volume (K Unit) Forecast, by Application 2019 & 2032
- Table 39: Rest of Europe Unmanned Marine Vehicles Market Revenue (Million) Forecast, by Application 2019 & 2032
- Table 40: Rest of Europe Unmanned Marine Vehicles Market Volume (K Unit) Forecast, by Application 2019 & 2032
- Table 41: Global Unmanned Marine Vehicles Market Revenue Million Forecast, by Country 2019 & 2032
- Table 42: Global Unmanned Marine Vehicles Market Volume K Unit Forecast, by Country 2019 & 2032
- Table 43: China Unmanned Marine Vehicles Market Revenue (Million) Forecast, by Application 2019 & 2032
- Table 44: China Unmanned Marine Vehicles Market Volume (K Unit) Forecast, by Application 2019 & 2032
- Table 45: Japan Unmanned Marine Vehicles Market Revenue (Million) Forecast, by Application 2019 & 2032
- Table 46: Japan Unmanned Marine Vehicles Market Volume (K Unit) Forecast, by Application 2019 & 2032
- Table 47: India Unmanned Marine Vehicles Market Revenue (Million) Forecast, by Application 2019 & 2032
- Table 48: India Unmanned Marine Vehicles Market Volume (K Unit) Forecast, by Application 2019 & 2032
- Table 49: South Korea Unmanned Marine Vehicles Market Revenue (Million) Forecast, by Application 2019 & 2032
- Table 50: South Korea Unmanned Marine Vehicles Market Volume (K Unit) Forecast, by Application 2019 & 2032
- Table 51: Southeast Asia Unmanned Marine Vehicles Market Revenue (Million) Forecast, by Application 2019 & 2032
- Table 52: Southeast Asia Unmanned Marine Vehicles Market Volume (K Unit) Forecast, by Application 2019 & 2032
- Table 53: Australia Unmanned Marine Vehicles Market Revenue (Million) Forecast, by Application 2019 & 2032
- Table 54: Australia Unmanned Marine Vehicles Market Volume (K Unit) Forecast, by Application 2019 & 2032
- Table 55: Indonesia Unmanned Marine Vehicles Market Revenue (Million) Forecast, by Application 2019 & 2032
- Table 56: Indonesia Unmanned Marine Vehicles Market Volume (K Unit) Forecast, by Application 2019 & 2032
- Table 57: Phillipes Unmanned Marine Vehicles Market Revenue (Million) Forecast, by Application 2019 & 2032
- Table 58: Phillipes Unmanned Marine Vehicles Market Volume (K Unit) Forecast, by Application 2019 & 2032
- Table 59: Singapore Unmanned Marine Vehicles Market Revenue (Million) Forecast, by Application 2019 & 2032
- Table 60: Singapore Unmanned Marine Vehicles Market Volume (K Unit) Forecast, by Application 2019 & 2032
- Table 61: Thailandc Unmanned Marine Vehicles Market Revenue (Million) Forecast, by Application 2019 & 2032
- Table 62: Thailandc Unmanned Marine Vehicles Market Volume (K Unit) Forecast, by Application 2019 & 2032
- Table 63: Rest of Asia Pacific Unmanned Marine Vehicles Market Revenue (Million) Forecast, by Application 2019 & 2032
- Table 64: Rest of Asia Pacific Unmanned Marine Vehicles Market Volume (K Unit) Forecast, by Application 2019 & 2032
- Table 65: Global Unmanned Marine Vehicles Market Revenue Million Forecast, by Country 2019 & 2032
- Table 66: Global Unmanned Marine Vehicles Market Volume K Unit Forecast, by Country 2019 & 2032
- Table 67: Brazil Unmanned Marine Vehicles Market Revenue (Million) Forecast, by Application 2019 & 2032
- Table 68: Brazil Unmanned Marine Vehicles Market Volume (K Unit) Forecast, by Application 2019 & 2032
- Table 69: Argentina Unmanned Marine Vehicles Market Revenue (Million) Forecast, by Application 2019 & 2032
- Table 70: Argentina Unmanned Marine Vehicles Market Volume (K Unit) Forecast, by Application 2019 & 2032
- Table 71: Peru Unmanned Marine Vehicles Market Revenue (Million) Forecast, by Application 2019 & 2032
- Table 72: Peru Unmanned Marine Vehicles Market Volume (K Unit) Forecast, by Application 2019 & 2032
- Table 73: Chile Unmanned Marine Vehicles Market Revenue (Million) Forecast, by Application 2019 & 2032
- Table 74: Chile Unmanned Marine Vehicles Market Volume (K Unit) Forecast, by Application 2019 & 2032
- Table 75: Colombia Unmanned Marine Vehicles Market Revenue (Million) Forecast, by Application 2019 & 2032
- Table 76: Colombia Unmanned Marine Vehicles Market Volume (K Unit) Forecast, by Application 2019 & 2032
- Table 77: Ecuador Unmanned Marine Vehicles Market Revenue (Million) Forecast, by Application 2019 & 2032
- Table 78: Ecuador Unmanned Marine Vehicles Market Volume (K Unit) Forecast, by Application 2019 & 2032
- Table 79: Venezuela Unmanned Marine Vehicles Market Revenue (Million) Forecast, by Application 2019 & 2032
- Table 80: Venezuela Unmanned Marine Vehicles Market Volume (K Unit) Forecast, by Application 2019 & 2032
- Table 81: Rest of South America Unmanned Marine Vehicles Market Revenue (Million) Forecast, by Application 2019 & 2032
- Table 82: Rest of South America Unmanned Marine Vehicles Market Volume (K Unit) Forecast, by Application 2019 & 2032
- Table 83: Global Unmanned Marine Vehicles Market Revenue Million Forecast, by Country 2019 & 2032
- Table 84: Global Unmanned Marine Vehicles Market Volume K Unit Forecast, by Country 2019 & 2032
- Table 85: United States Unmanned Marine Vehicles Market Revenue (Million) Forecast, by Application 2019 & 2032
- Table 86: United States Unmanned Marine Vehicles Market Volume (K Unit) Forecast, by Application 2019 & 2032
- Table 87: Canada Unmanned Marine Vehicles Market Revenue (Million) Forecast, by Application 2019 & 2032
- Table 88: Canada Unmanned Marine Vehicles Market Volume (K Unit) Forecast, by Application 2019 & 2032
- Table 89: Mexico Unmanned Marine Vehicles Market Revenue (Million) Forecast, by Application 2019 & 2032
- Table 90: Mexico Unmanned Marine Vehicles Market Volume (K Unit) Forecast, by Application 2019 & 2032
- Table 91: Global Unmanned Marine Vehicles Market Revenue Million Forecast, by Country 2019 & 2032
- Table 92: Global Unmanned Marine Vehicles Market Volume K Unit Forecast, by Country 2019 & 2032
- Table 93: United Arab Emirates Unmanned Marine Vehicles Market Revenue (Million) Forecast, by Application 2019 & 2032
- Table 94: United Arab Emirates Unmanned Marine Vehicles Market Volume (K Unit) Forecast, by Application 2019 & 2032
- Table 95: Saudi Arabia Unmanned Marine Vehicles Market Revenue (Million) Forecast, by Application 2019 & 2032
- Table 96: Saudi Arabia Unmanned Marine Vehicles Market Volume (K Unit) Forecast, by Application 2019 & 2032
- Table 97: South Africa Unmanned Marine Vehicles Market Revenue (Million) Forecast, by Application 2019 & 2032
- Table 98: South Africa Unmanned Marine Vehicles Market Volume (K Unit) Forecast, by Application 2019 & 2032
- Table 99: Rest of Middle East and Africa Unmanned Marine Vehicles Market Revenue (Million) Forecast, by Application 2019 & 2032
- Table 100: Rest of Middle East and Africa Unmanned Marine Vehicles Market Volume (K Unit) Forecast, by Application 2019 & 2032
- Table 101: Global Unmanned Marine Vehicles Market Revenue Million Forecast, by Type 2019 & 2032
- Table 102: Global Unmanned Marine Vehicles Market Volume K Unit Forecast, by Type 2019 & 2032
- Table 103: Global Unmanned Marine Vehicles Market Revenue Million Forecast, by Control Type 2019 & 2032
- Table 104: Global Unmanned Marine Vehicles Market Volume K Unit Forecast, by Control Type 2019 & 2032
- Table 105: Global Unmanned Marine Vehicles Market Revenue Million Forecast, by Application 2019 & 2032
- Table 106: Global Unmanned Marine Vehicles Market Volume K Unit Forecast, by Application 2019 & 2032
- Table 107: Global Unmanned Marine Vehicles Market Revenue Million Forecast, by Country 2019 & 2032
- Table 108: Global Unmanned Marine Vehicles Market Volume K Unit Forecast, by Country 2019 & 2032
- Table 109: United States Unmanned Marine Vehicles Market Revenue (Million) Forecast, by Application 2019 & 2032
- Table 110: United States Unmanned Marine Vehicles Market Volume (K Unit) Forecast, by Application 2019 & 2032
- Table 111: Canada Unmanned Marine Vehicles Market Revenue (Million) Forecast, by Application 2019 & 2032
- Table 112: Canada Unmanned Marine Vehicles Market Volume (K Unit) Forecast, by Application 2019 & 2032
- Table 113: Global Unmanned Marine Vehicles Market Revenue Million Forecast, by Type 2019 & 2032
- Table 114: Global Unmanned Marine Vehicles Market Volume K Unit Forecast, by Type 2019 & 2032
- Table 115: Global Unmanned Marine Vehicles Market Revenue Million Forecast, by Control Type 2019 & 2032
- Table 116: Global Unmanned Marine Vehicles Market Volume K Unit Forecast, by Control Type 2019 & 2032
- Table 117: Global Unmanned Marine Vehicles Market Revenue Million Forecast, by Application 2019 & 2032
- Table 118: Global Unmanned Marine Vehicles Market Volume K Unit Forecast, by Application 2019 & 2032
- Table 119: Global Unmanned Marine Vehicles Market Revenue Million Forecast, by Country 2019 & 2032
- Table 120: Global Unmanned Marine Vehicles Market Volume K Unit Forecast, by Country 2019 & 2032
- Table 121: Germany Unmanned Marine Vehicles Market Revenue (Million) Forecast, by Application 2019 & 2032
- Table 122: Germany Unmanned Marine Vehicles Market Volume (K Unit) Forecast, by Application 2019 & 2032
- Table 123: Italy Unmanned Marine Vehicles Market Revenue (Million) Forecast, by Application 2019 & 2032
- Table 124: Italy Unmanned Marine Vehicles Market Volume (K Unit) Forecast, by Application 2019 & 2032
- Table 125: France Unmanned Marine Vehicles Market Revenue (Million) Forecast, by Application 2019 & 2032
- Table 126: France Unmanned Marine Vehicles Market Volume (K Unit) Forecast, by Application 2019 & 2032
- Table 127: Rest of Europe Unmanned Marine Vehicles Market Revenue (Million) Forecast, by Application 2019 & 2032
- Table 128: Rest of Europe Unmanned Marine Vehicles Market Volume (K Unit) Forecast, by Application 2019 & 2032
- Table 129: Global Unmanned Marine Vehicles Market Revenue Million Forecast, by Type 2019 & 2032
- Table 130: Global Unmanned Marine Vehicles Market Volume K Unit Forecast, by Type 2019 & 2032
- Table 131: Global Unmanned Marine Vehicles Market Revenue Million Forecast, by Control Type 2019 & 2032
- Table 132: Global Unmanned Marine Vehicles Market Volume K Unit Forecast, by Control Type 2019 & 2032
- Table 133: Global Unmanned Marine Vehicles Market Revenue Million Forecast, by Application 2019 & 2032
- Table 134: Global Unmanned Marine Vehicles Market Volume K Unit Forecast, by Application 2019 & 2032
- Table 135: Global Unmanned Marine Vehicles Market Revenue Million Forecast, by Country 2019 & 2032
- Table 136: Global Unmanned Marine Vehicles Market Volume K Unit Forecast, by Country 2019 & 2032
- Table 137: China Unmanned Marine Vehicles Market Revenue (Million) Forecast, by Application 2019 & 2032
- Table 138: China Unmanned Marine Vehicles Market Volume (K Unit) Forecast, by Application 2019 & 2032
- Table 139: Japan Unmanned Marine Vehicles Market Revenue (Million) Forecast, by Application 2019 & 2032
- Table 140: Japan Unmanned Marine Vehicles Market Volume (K Unit) Forecast, by Application 2019 & 2032
- Table 141: India Unmanned Marine Vehicles Market Revenue (Million) Forecast, by Application 2019 & 2032
- Table 142: India Unmanned Marine Vehicles Market Volume (K Unit) Forecast, by Application 2019 & 2032
- Table 143: Australia Unmanned Marine Vehicles Market Revenue (Million) Forecast, by Application 2019 & 2032
- Table 144: Australia Unmanned Marine Vehicles Market Volume (K Unit) Forecast, by Application 2019 & 2032
- Table 145: Rest of Asia Pacific Unmanned Marine Vehicles Market Revenue (Million) Forecast, by Application 2019 & 2032
- Table 146: Rest of Asia Pacific Unmanned Marine Vehicles Market Volume (K Unit) Forecast, by Application 2019 & 2032
- Table 147: Global Unmanned Marine Vehicles Market Revenue Million Forecast, by Type 2019 & 2032
- Table 148: Global Unmanned Marine Vehicles Market Volume K Unit Forecast, by Type 2019 & 2032
- Table 149: Global Unmanned Marine Vehicles Market Revenue Million Forecast, by Control Type 2019 & 2032
- Table 150: Global Unmanned Marine Vehicles Market Volume K Unit Forecast, by Control Type 2019 & 2032
- Table 151: Global Unmanned Marine Vehicles Market Revenue Million Forecast, by Application 2019 & 2032
- Table 152: Global Unmanned Marine Vehicles Market Volume K Unit Forecast, by Application 2019 & 2032
- Table 153: Global Unmanned Marine Vehicles Market Revenue Million Forecast, by Country 2019 & 2032
- Table 154: Global Unmanned Marine Vehicles Market Volume K Unit Forecast, by Country 2019 & 2032
- Table 155: Brazil Unmanned Marine Vehicles Market Revenue (Million) Forecast, by Application 2019 & 2032
- Table 156: Brazil Unmanned Marine Vehicles Market Volume (K Unit) Forecast, by Application 2019 & 2032
- Table 157: Rest of Latin America Unmanned Marine Vehicles Market Revenue (Million) Forecast, by Application 2019 & 2032
- Table 158: Rest of Latin America Unmanned Marine Vehicles Market Volume (K Unit) Forecast, by Application 2019 & 2032
- Table 159: Global Unmanned Marine Vehicles Market Revenue Million Forecast, by Type 2019 & 2032
- Table 160: Global Unmanned Marine Vehicles Market Volume K Unit Forecast, by Type 2019 & 2032
- Table 161: Global Unmanned Marine Vehicles Market Revenue Million Forecast, by Control Type 2019 & 2032
- Table 162: Global Unmanned Marine Vehicles Market Volume K Unit Forecast, by Control Type 2019 & 2032
- Table 163: Global Unmanned Marine Vehicles Market Revenue Million Forecast, by Application 2019 & 2032
- Table 164: Global Unmanned Marine Vehicles Market Volume K Unit Forecast, by Application 2019 & 2032
- Table 165: Global Unmanned Marine Vehicles Market Revenue Million Forecast, by Country 2019 & 2032
- Table 166: Global Unmanned Marine Vehicles Market Volume K Unit Forecast, by Country 2019 & 2032
- Table 167: South Africa Unmanned Marine Vehicles Market Revenue (Million) Forecast, by Application 2019 & 2032
- Table 168: South Africa Unmanned Marine Vehicles Market Volume (K Unit) Forecast, by Application 2019 & 2032
- Table 169: Rest of Middle East and Africa Unmanned Marine Vehicles Market Revenue (Million) Forecast, by Application 2019 & 2032
- Table 170: Rest of Middle East and Africa Unmanned Marine Vehicles Market Volume (K Unit) Forecast, by Application 2019 & 2032
Frequently Asked Questions
1. What is the projected Compound Annual Growth Rate (CAGR) of the Unmanned Marine Vehicles Market?
The projected CAGR is approximately 8.51%.
2. Which companies are prominent players in the Unmanned Marine Vehicles Market?
Key companies in the market include Textron Inc, Ocean Aero Inc, Liquid Robotics, BAE Systems, Sea Robotics Inc, ECA Group, Rafael Advanced Defense Systems, Atlas Elektronik, Thales Group, General Dynamics, Northrop Grumman, Pelorus Naval Systems, ASV Globa, Teledyne Technologies Inc.
3. What are the main segments of the Unmanned Marine Vehicles Market?
The market segments include Type, Control Type, Application.
4. Can you provide details about the market size?
The market size is estimated to be USD 4.93 Million as of 2022.
5. What are some drivers contributing to market growth?
Oceanic Surveillance for Defense Purposes; Increased Usage of Unmanned Marine Vehicles for Underwater Mapping for Marine Geoscience Studies.
6. What are the notable trends driving market growth?
The Defense Industry is Expected to Grow Significantly in the Market.
7. Are there any restraints impacting market growth?
High Cost for the Equipment and Maintenance Issues.
8. Can you provide examples of recent developments in the market?
August 2022 - Austal USA announced to partner with California-based Saildrone for building Saildrone Surveyor autonomous 'uncrewed' surface vehicle in Alabama. The partnership aims to provide a cutting-edge solution for maritime domain awareness, hydrographic survey, and other missions requiring persistent wide area coverage to the U.S. Navy and other government agency customers.
9. What pricing options are available for accessing the report?
Pricing options include single-user, multi-user, and enterprise licenses priced at USD 4750, USD 5250, and USD 8750 respectively.
10. Is the market size provided in terms of value or volume?
The market size is provided in terms of value, measured in Million and volume, measured in K Unit.
11. Are there any specific market keywords associated with the report?
Yes, the market keyword associated with the report is "Unmanned Marine Vehicles Market," which aids in identifying and referencing the specific market segment covered.
12. How do I determine which pricing option suits my needs best?
The pricing options vary based on user requirements and access needs. Individual users may opt for single-user licenses, while businesses requiring broader access may choose multi-user or enterprise licenses for cost-effective access to the report.
13. Are there any additional resources or data provided in the Unmanned Marine Vehicles Market report?
While the report offers comprehensive insights, it's advisable to review the specific contents or supplementary materials provided to ascertain if additional resources or data are available.
14. How can I stay updated on further developments or reports in the Unmanned Marine Vehicles Market?
To stay informed about further developments, trends, and reports in the Unmanned Marine Vehicles Market, consider subscribing to industry newsletters, following relevant companies and organizations, or regularly checking reputable industry news sources and publications.
Methodology
Step 1 - Identification of Relevant Samples Size from Population Database


Step 2 - Approaches for Defining Global Market Size (Value, Volume* & Price*)

Note*: In applicable scenarios
Step 3 - Data Sources
Primary Research
- Web Analytics
- Survey Reports
- Research Institute
- Latest Research Reports
- Opinion Leaders
Secondary Research
- Annual Reports
- White Paper
- Latest Press Release
- Industry Association
- Paid Database
- Investor Presentations

Step 4 - Data Triangulation
Involves using different sources of information in order to increase the validity of a study
These sources are likely to be stakeholders in a program - participants, other researchers, program staff, other community members, and so on.
Then we put all data in single framework & apply various statistical tools to find out the dynamic on the market.
During the analysis stage, feedback from the stakeholder groups would be compared to determine areas of agreement as well as areas of divergence


